Introduction
The relation between the bilingual linguistic experience and cognitive control has been the object of extensive research over the last 15 years. The acquisition and use of more than one language provide an ideal context for the study of cognitive plasticity, because the two languages of a bilingual are always active to some degree and interact with one another (Marian & Spivey, Reference Marian and Spivey2003; Blumenfeld & Marian, Reference Blumenfeld and Marian2013; Thierry & Wu, Reference Thierry and Wu2007; Wu & Thierry, Reference Wu and Thierry2010; Thierry & Sanoudaki, Reference Thierry and Sanoudaki2012). The mechanisms underlying the ability to select the relevant language and to inhibit the irrelevant one may lead to a transfer of abilities to other cognitive domains, such as the ones responsible for selective attention and goal orientation, i.e., executive functions. Therefore, some aspects that characterise the linguistic experience may result in cognitive enhancement on non-verbal tasks engaging cognitive control. The hypothesis of a relationship between bilingual experience and cognitive control has been the subject of extended research and controversy, as we discuss below; for this reason, in this study we consider theoretical and methodological aspects of that research that may limit its empirical generalizability. Specifically, we compare different groups of bilinguals that represent a range of bilingual experiences, in order to identify what critical variables may affect cognitive abilities; in addition, we adopt a theoretically motivated experimental task that targets specific aspects of cognitive control, and we employ analytical techniques that account for the effects of individual variability.
The neurosciences and cognitive psychology provide evidence for a relationship between language processing and executive functions and for brain differences between bilinguals and monolinguals. There are overlaps and patterns of dynamic connectivity between brain areas dedicated to language processing and to cognitive control (Fedorenko & Thompson-Schill, Reference Fedorenko and Thompson-Schill2014; Fedorenko, Reference Fedorenko2014). Patterns of cortical activation, thickness and connectivity specific to bilinguals correlate with properties such as age of language acquisition and language proficiency (Buchweitz & Prat, Reference Buchweitz and Prat2013; Abutalebi, Della Rosa, Ding, Weekes, Costa & Green, Reference Abutalebi, Della Rosa, Ding, Weekes, Costa and Green2013; Ye and Zhou, Reference Ye and Zhou2009; García-Pentón, Pérez-Fernández, Iturria-Medina, Gillon-Dowens & Carreiras, Reference García-Pentón, Pérez Fernández, Iturria-Medina, Gillon-Dowens and Carreiras2014; Klein, Mok, Chen & Watkins, Reference Klein, Mok, Chen and Watkins2014). In addition, monolingual and bilingual participants show different patterns of activation during cognitive control tasks (Stocco & Prat, Reference Stocco and Prat2014; Rodríguez-Pujadas, Sanjuán, Ventura-Campos, Román, Martin, Barceló, Costa & Ávila, Reference Rodríguez-Pujadas, Sanjuán, Ventura-Campos, Román, Martin, Barceló, Costa and Ávila2013). These findings attest that specific aspects of the bilingual experience have a widespread impact on the brain's functionality.
In contrast, behavioural evidence for advantages in cognitive abilities related to the bilingual experience is less conclusive and highly controversial. Many studies have compared monolinguals and bilinguals using tests such as the Simon task, the flanker task, and the Stroop task, which engage attentional processes as they require the selection of an appropriate response in cases of conflicting information. Some of these found that bilinguals performed better than monolinguals and therefore support a ‘bilingual advantage’ (Bialystok, Craik, Klein & Viswanathan, Reference Bialystok, Craik, Klein and Viswanathan2004; Bialystok, Craik & Luk, Reference Bialystok, Craik and Luk2008; Costa, Hernandez & Sebastián-Gallés, Reference Costa, Hernández and Sebastián-Gallés2008; Costa & Sebastián-Gallés, Reference Costa and Sebastián-Gallés2014; Bialystok, Craik & Luk, Reference Bialystok, Craik and Luk2012). However, others did not find any such effect (Paap & Greenberg, Reference Paap and Greenberg2013; Paap & Sawi, Reference Paap and Sawi2014; Gathercole, Thomas, Kennedy, Prys, Young, Vinas Guasch, Roberts, Hughes & Jones, Reference Gathercole, Thomas, Kennedy, Prys, Young, Vinas Guasch, Roberts, Hughes and Jones2014; Paap, Reference Paap and Sawi2014). These divergent results may be the consequence of variables such as socio-economic status or immigrant status, or effects of small sample sizes (Paap, Johnson & Sawi, Reference Paap, Johnson and Sawi2015).
But these potential confounds only represent the tip of the iceberg of two theoretical challenges in the study of bilingualism: the large variability within and between bilingual groups, and the lack of a theory-driven approach to measuring cognitive control through laboratory tasks. In addition, this research also faces the main problem for the study of executive functions: individual variability, i.e., the fact that the ability to control attention varies significantly across individuals (Braver, Gray & Burgess, Reference Braver, Gray, Burgess, Conway, Jarrold, Kane, Miyake and Towse2007; Braver, Reference Braver2012). We now elaborate on these three points in turn.
First, rather than a dichotomous distinction between bilinguals and monolinguals, the bilingual experience can be better understood as a continuum, multi-variate dimension (Luk & Bialystok, Reference Luk and Bialystok2013; Bak, Reference Bak2016). Bilingualism is in fact associated with a diversity of experiences in which multiple variables play a role (e.g., early or late age of acquisition, high or low proficiency). The particular type(s) of experience that may affect cognitive abilities such as executive functions need to be identified along these dimensions. At the same time, though, they are likely to interact with one another to create unique and diversified experiential profiles, and obscuring their impact on non-linguistic cognitive aspects. It is important, therefore, to examine the role of each dimension of the bilingual experience (e.g., age of acquisition, proficiency, exposure); however, a significant body of research on bilingualism presents mixed bilingual samples (i.e., groups of individuals with different language combinations and backgrounds, broadly matched for age of acquisition and proficiency, e.g., Bialystok, Craik & Ruocco, Reference Bialystok, Craik and Ruocco2006; Bialystok, Craik & Ryan, Reference Bialystok, Craik and Ryan2006, Bialystok et al., Reference Bialystok, Craik and Luk2008; Morales, Gómez-Ariza & Bajo, Reference Morales, Gómez-Ariza and Bajo2013; Moradzadeh, Blumenthal & Wiseheart, Reference Moradzadeh, Blumenthal and Wiseheart2014; Paap & Sawi, Reference Paap and Sawi2014) or ‘monolingual’ participants who know an additional language, albeit with low to medium proficiency (e.g., Bialystok et al., Reference Bialystok, Craik, Klein and Viswanathan2004; Bialystok, Craik & Ryan, Reference Bialystok, Craik and Ryan2006; Marzecová, Bukowski, Correa, Boros, Lupiáñez & Wodniecka, Reference Marzecová, Bukowski, Correa, Boros, Lupiáñez and Wodniecka2013; Morales et al., Reference Morales, Gómez-Ariza and Bajo2013; Paap & Greenberg, Reference Paap and Greenberg2013; Paap & Sawi, Reference Paap and Sawi2014).
Secondly, research on bilingual cognitive control has been hampered by the lack of a theory-driven approach to measures of cognitive control. Tasks used in such research have little convergent validity, in that the measures they provide are poorly correlated, as highlighted by studies on bilinguals (Paap & Sawi, Reference Paap and Sawi2014) and monolinguals: for instance, the Stroop and the Simon effects may not correlate because they engage cognitive control processes in different ways, as reflected by the fact that they have different time-courses (Pratte, Rouder, Morey & Feng, Reference Pratte, Rouder, Morey and Feng2010; Speckman, Rouder, Morey & Pratte, Reference Speckman, Rouder, Morey and Pratte2008). In the flanker task, differences between bilingual and monolingual participants depend on the manipulation of the amount of conflict that the task presents (Costa, Hernández, Costa-Faidella & Sebastián-Gallés, Reference Costa, Hernández, Costa-Faidella and Sebastián-Gallés2009). In addition, most research has used tasks that are ‘impure’, in the sense that they involve cognitive components other than executive functions, such as spatial attention and a variety of perceptual and motor mechanisms (Valian, Reference Valian2014).
Researchers originally adopted these tasks because they assumed that the relationship between executive functions and bilingualism is based on one mechanism, namely inhibition, as proposed by the Inhibitory Control Model (Green, Reference Green1998). According to this model, bilinguals inhibit the language they are not using at every level of linguistic representation. However, this “segregational approach” to executive functions (or “divide and conquer approach”; Stocco & Prat, Reference Stocco and Prat2014), which tries to separate and address single mechanisms of cognitive control, has been criticised (Hartsuiker, Reference Hartsuiker2015; Gade, Reference Gade2015). For instance, some studies have shown differences between monolinguals and bilinguals in measures of disengagement of attention, rather than in inhibition (Grundy & Keyvani-Chahi, Reference Grundy and Keyvani-Chahi2017). Recent findings highlight the “unity and diversity” of executive functions mechanisms (Miyake & Friedman, Reference Miyake and Friedman2012): that is to say, the correlations between distinct components of cognitive control such as updating, shifting and inhibition. These components dynamically adapt to the specific demands of different interactional contexts, and differ greatly across situations as well as individuals (Green & Abutalebi, Reference Green and Abutalebi2013). Accordingly, some studies have used approaches such as latent-variable analysis to find the common properties measured by executive functions tasks (Friedman, Reference Friedman2016). But these approaches are data-driven, i.e., do not make explicit reference to the individual components that are recognised by theories of executive functions. Therefore it seems that the choice of the dependent variable in laboratory studies is not always based on a principled approach to executive functions and the specific components, beyond inhibition, that could be implicated in bilingual language processing (Jared, Reference Jared2015).
Consistent with the “unity and diversity” approach, Braver and colleagues have proposed an explicit dual-component model of cognitive control: the dual mechanisms framework (Braver et al., Reference Braver, Gray, Burgess, Conway, Jarrold, Kane, Miyake and Towse2007; Braver, Reference Braver2012). This model was originally elaborated to answer to the question of individual variability in executive functions. According to this framework, cognitive control operates through two separate components: ‘proactive control’ and ‘reactive control’. ‘Proactive control’ is specialised to the active maintenance of goal-relevant information, which directs attention, perception and action. ‘Reactive control’ is engaged as a ‘late correction’ mechanism after a sudden event that re-directs attention, similar to the inhibitory mechanism put forth by Green (Reference Green1998). Importantly, Braver and colleagues argue that the existence of distinct, but interconnected, components of cognitive control allow information processing to be optimized in a flexible way, because each control mechanism is associated with a cognitive cost. Proactive control is highly reliable but cognitively expensive, because it requires sustained activation of contextual information. In contrast, reactive control activates relevant information only transiently; so it is less expensive, but potentially unreliable. The dynamics of these two components are also responsible for the variability in control strategies within and across individuals, and as such provide an explanation for the individual variability that is central to the “unity and diversity” account.
The dual mechanisms framework is potentially relevant for the study of bilingualism not only because it overcomes the limitations of the Inhibitory Control Model, as mentioned above, but also because it reflects models of language control in language switching. Studies on language mixing such as Ma, Li and Guo (Reference Ma, Li and Guo2016) and Wu and Thierry (Reference Wu and Thierry2017) associate a proactive mechanism of language control to mix costs (i.e., the difference between naming latencies in a single-language context and in a mixed-language context in language switching paradigms) and an inhibitory mechanism to switch cost (i.e., the difference between naming latencies when switching languages in successive trials in language switching paradigms).
The dual mechanisms framework has been evaluated in different populations in both neuroimaging and behavioural studies. Proactive and reactive control correlate with flexible patterns of activation of the prefrontal cortex in neurologically normal adults (Braver, Paxton, Locke & Barch, Reference Braver, Paxton, Locke and Barch2009). Moreover, the AX-Continuous Performance Task (AX-CPT), a task of continuous performance designed to measure the interplay of these two control mechanisms, revealed differences between younger and older adults (Braver et al., Reference Braver, Paxton, Locke and Barch2009; Paxton, Barch, Storandt & Braver, Reference Paxton, Barch, Storandt and Braver2006). These findings suggest that people differ in the extent to which they modulate proactive and reactive control to optimize performance (Braver, Barch, Keys, Carter, Cohen, Kaye, Janowsky, Taylor, Yesavage, Mumenthaler, Jagust & Reed, Reference Braver, Barch, Keys, Carter, Cohen, Kaye, Janowsky, Taylor, Yesavage, Mumenthaler, Jagust and Reed2001; Braver et al., Reference Braver, Gray, Burgess, Conway, Jarrold, Kane, Miyake and Towse2007, Reference Braver, Paxton, Locke and Barch2009).
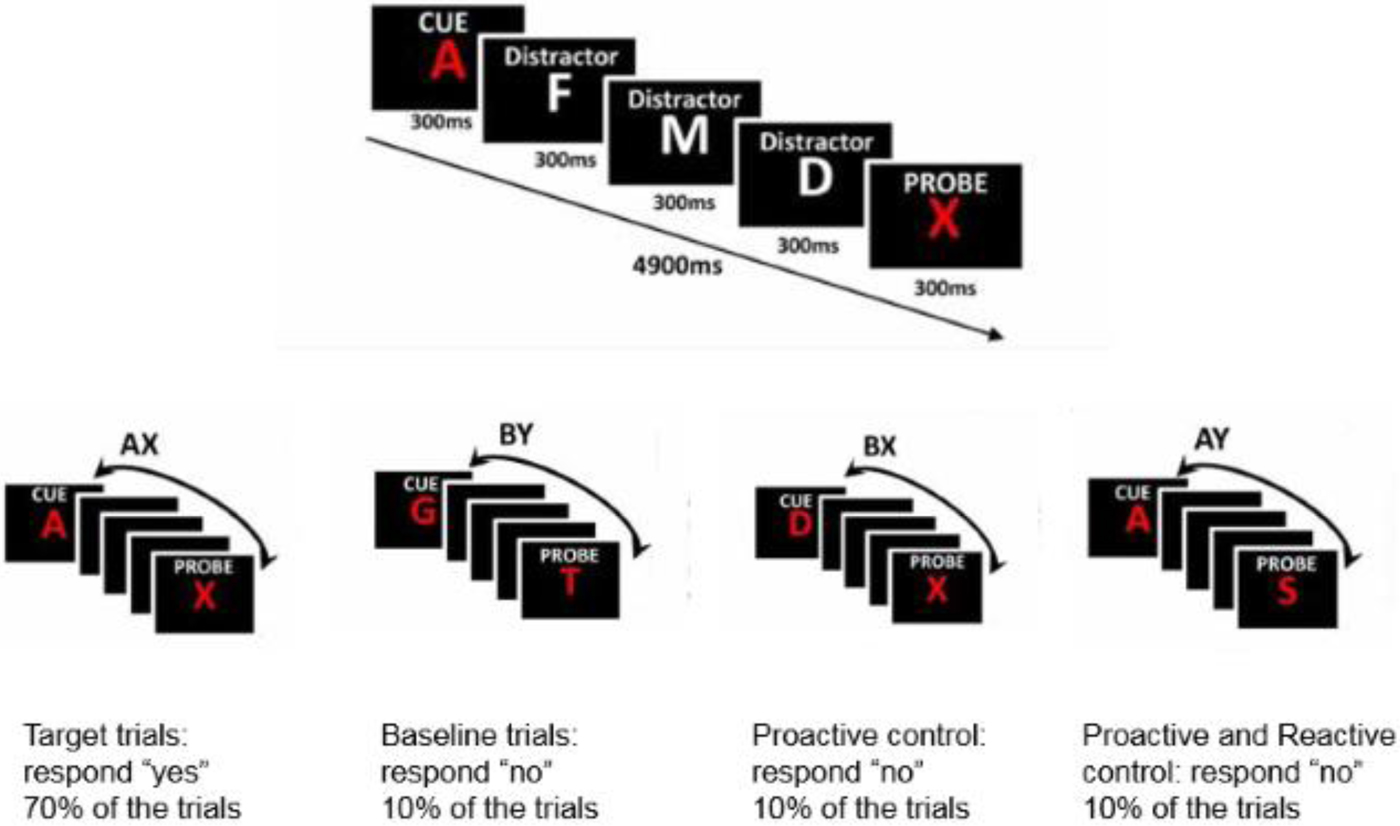
Specifically, the AX-CPT presents participants with sequences of letters, which include pairs of cues and probes. Participants have to press “yes” if they see an X (probe) following an A (cue). For any other cue-probe combination, they have to press “no”. Moreover, between the cue and the probe a sequence of letters appear as distractors, and participants have to press “no” to each of them (see Fig. 1). There are four combinations of cues and probes: “AX” trials (correct cue and correct probe); “AY” trials (correct cue but incorrect probe, where Y stands for any probe other than X); “BX” trials, in which the cue is incorrect but the probe is correct (B stands for any cue other than A), and “BY” trials, in which neither the cue nor the probe is correct.
Design of the AX-CPT: procedure (top) and types of trials (bottom). Adapted from Morales et al. (Reference Morales, Gómez-Ariza and Bajo2013).

In the AX-CPT task, “AX” trials occur 70% of the time in order to bias participants to respond “yes”; “AY”, “BX”, “BY” trials each occur 10% of the time (and therefore their frequency is matched). In “AY” trials, participants first invoke proactive control to keep in memory the A cue and be prepared to respond “yes”, but then they need to suppress this tendency when they see the Y probe – that is to say, they need to engage reactive control. In “BX” trials, in contrast, participants tend to answer “yes” when they see the X probe, but they can suppress this tendency by relying on the information provided by the B cue, i.e., through proactive control alone. Both “AY” and “BX” trials therefore engage proactive control, but “AY” trials also engage reactive control (Paxton et al., Reference Paxton, Barch, Storandt and Braver2006). Finally, “BY” trials can be considered as baseline trials, as neither the cue nor the probe prompt a “yes” response. Like the majority of executive functions task, the AX-CPT also involves perceptual and motor mechanisms, and the mapping between reactive and proactive control components and type of trial has received criticism (Grundy & Timmer, Reference Grundy, Timmer and Schwieter2016); however, this task seems to allow the assessment of how individuals combine the two (proactive and reactive) control mechanisms in order to respond appropriately to the different trials.
Morales and colleagues (Morales et al., Reference Morales, Gómez-Ariza and Bajo2013; Morales, Yudes, Gómez-Ariza & Bajo, Reference Morales, Yudes, Gómez-Ariza and Bajo2015) used evidence from this task to argue that bilinguals showed an advantage over monolinguals in their ability to modulate proactive and reactive control. Their hypothesis is in line with studies on language switching (Ma et al., Reference Ma, Li and Guo2016; Wu & Thierry, Reference Wu and Thierry2017) that highlight the importance of both proactive and reactive control mechanisms in language selection. Specifically, Morales and colleagues hypothesized that the language selection mechanism responsible for suppressing irrelevant linguistic representations is related to reactive control, whereas the ability to monitor the context and to maintain activation of the relevant language is related to proactive control, and moreover that the two mechanisms need to be combined to manage two languages efficiently. Consequently, they predicted that bilinguals would show different patterns of performance on the AX-CPT task from monolinguals.
In one study, they administered the AX-CPT to a group of monolinguals and to a group of highly proficient early bilinguals with different language combinations. Their analysis of aggregated accuracy scores showed that bilinguals made fewer errors than monolinguals on the “AY” trials, and that the groups did not differ on the other types of trial (“AX”, “BX”, “BY”) (Morales et al., Reference Morales, Gómez-Ariza and Bajo2013). To examine whether the bilingual advantage was the result of better reactive control alone, Morales and colleagues also administered a stop-signal task. This task specifically addresses reactive control by requiring participants to respond to stimuli but to suppress their response when a stop signal is presented. In this task, they found no differences between the two groups, suggesting that better performance on the “AY” trials indeed reflects a superior modulation of two cognitive control processes. In a second study, they found the same pattern of results with respect to accuracy (but not with respect to reaction times) and extended them through the analysis of ERP components related to reactive control, which showed differential activation between bilingual and monolingual participants (Morales et al., Reference Morales, Yudes, Gómez-Ariza and Bajo2015).
Taken together, the existing evidence suggests that to adequately address the relationship between bilingualism and executive control, it is necessary both to adopt an explicit model of the relationship between language control and executive functions, and to use a task (such as the AX-CPT) that can discriminate the relevant components. Nonetheless, the selection of an appropriate task alone may not be sufficient: evidence about a modulation of cognitive abilities dependent on language experience may also be susceptible to substantial individual variability in executive functions.
Individual variability is a main challenge in the study of executive functions. One way to take individual variability into account is to use appropriate sample sizes. In these respects, Morales et al.’s (Reference Morales, Gómez-Ariza and Bajo2013, Reference Morales, Yudes, Gómez-Ariza and Bajo2015) conclusions may be affected by the small sample sizes (in the first study they examined 21 bilinguals and 23 monolinguals, in their second study they tested 25 bilinguals and 27 monolinguals). A stronger approach to addressing individual variability is to factor it into data analysis. Mixed-model ANOVA, as used by Morales et al., is a widespread analytical technique, but it allows only the specification of by-subject random effects (or by-item random effects). Mixed-effects models, in contrast, allow for the specification of complete, theoretically motivated random effects structures (Barr, Levy, Scheepers & Tily, Reference Barr, Levy, Scheepers and Tily2013). Studies that are based on ANOVA, as in much research on bilingualism and executive functions (e.g., Bialystok & Martin, Reference Bialystok and Martin2004; Prior & MacWhinney, Reference Prior and Macwhinney2009; Mishra, Hilchey, Singh & Klein, Reference Mishra, Hilchey, Singh and Klein2012; Blumenfeld & Marian, Reference Blumenfeld and Marian2014), may therefore be limited in their ability to determine the effects of individual variability in the critical components of executive functions. Critically, their conclusions may result from the unwarranted attribution of the variability present in their data to the group level, rather than to the individual level.
Moreover, ANOVA is based on the aggregation of data-points, and it misrepresents accuracy data as normally distributed; mixed-effects models, instead, are adequate to the analysis of binomial data such as accuracy (Barr et al., Reference Barr, Levy, Scheepers and Tily2013, Dixon, Reference Dixon2008). The analysis of aggregated accuracy data using ANOVA, combined with reduced sample size, as in Morales et al. (Reference Morales, Gómez-Ariza and Bajo2013, Reference Morales, Yudes, Gómez-Ariza and Bajo2015), contributes to increases in Type I error rates (i.e., false positives).
Our study targets these problematic aspects in research on bilingualism and executive functions by adopting a theoretically motivated experimental test of executive functions (i.e., the AX-CPT) and analytical techniques that are robust to inter-individual variability. By doing so, we ask whether any group differences stand up to an appropriate factorization of individual variability through the use of mixed-model regression and a complete random effect structure. Moreover, we compare patterns of performance across bilingual populations that differ between each other with respect to important aspects of their linguistic experience, such as age of acquisition and proficiency. We also adopt larger sample sizes than many previous studies, such as Morales et al. (i.e., n > 30 in each group; see Paap, Johnson & Sawi, Reference Paap, Johnson and Sawi2015, for review and discussion).
In order to understand the role of specific dimensions of the bilingual experience, we compare four groups of Italian bilinguals whose experience ranges from early (i.e., they acquired their two languages before the age of 6) highly proficient bilingualism, to late (i.e., they acquired their second language after childhood) low proficient bilingualism. Specifically, we compared early highly proficient bilinguals (Italian–Sardinian), late highly proficient bilinguals (Italian–English), early passive bilinguals (Italian–Sardinian Passive), and late passive bilinguals (Italian late passive bilinguals). With respect to Sardinian full and passive bilinguals, so far only two studies have addressed the cognitive effects of bilingualism in the Sardinian context. Focusing on children, Lauchlan and colleagues found an advantage among Italian–Sardinian children, with respect to Italian monolinguals, in a cognitive control test and in a vocabulary test (but not in a digit span test nor in an arithmetic test, Lauchlan, Parisi & Fadda, Reference Lauchlan, Parisi and Fadda2012). Another study similarly showed only limited differences in linguistic and cognitive tests between bilingual and monolingual children (Garraffa, Beveridge & Sorace, Reference Garraffa, Beveridge and Sorace2015). As a minority language, Sardinian is learnt and used informally, mainly at home and with friends, whereas Italian is the main language used at work and to access the media, and the medium of education. Our Italian–Sardinian highly proficient bilinguals reported learning both Italian and Sardinian during childhood, being fluent in both languages and using them daily. In contrast, our Italian–Sardinian Passive bilinguals reported on average limited productive proficiency in Sardinian, but high comprehension abilities, and consistent passive exposure (in particular oral) throughout their lifetime.
In contrast to Italian–Sardinian bilinguals, for our Italian–English bilinguals, high L2 proficiency was the result of formal education and of extensive, albeit recent, immersion (average length of residence in an English speaking country was 3.5 years, see section below). Finally, our Italian late passive bilingual participants also learnt English in school, but did not have advanced proficiency in English nor in any language other than Italian, and no experience of prolonged immersion in an English-speaking environment. However, they all had a basic or medium proficiency in English, as required in school and university, and a consistent experience of passive use of the language (in particular written) throughout their studies. This last group presents a linguistic experience that locates it on a low end of a continuum of bilingual experiences (passive, late bilingualism). The inclusion of this group of participants reflects the fact that comparisons should be based on specific dimensions of the linguistic experience of participants, in order to determine how these dimensions may affect cognitive abilities. Moreover, the inclusion of this group reflects the pervasive nature of multilingualism, and the empirical limitations of a dichotomous approach to bilingualism (i.e., bilingual vs monolingual).
We hypothesise that the AX-CPT task is sensitive to differences in cognitive control, and may reveal differences between our bilingual groups, in relation to their different experiences (age of acquisition, active and passive proficiency). Specifically, we examine if there is an advantage in accuracy among one or more groups in the “AY” condition, which measures the ability to combine the two mechanisms of cognitive control, while we expect all groups to perform equally well on “AX”, “BX” and “BY” trials (which do not implicate both control mechanisms). If group differences based on linguistic experience are more prominent than individual variability in executive functions measures, these differences should emerge also after we have excluded explanations in terms of individual variability, i.e., the overall variability across individuals (e.g., overall faster or slower RT), but also – and crucially – the variability across individuals in the relative performance across conditions (e.g., variability across individuals in relative differences in accuracy in each condition compared to baseline).
Therefore, we use Morales et al.’s (Reference Morales, Gómez-Ariza and Bajo2013) procedure and initially adopt their analysis, i.e., an ANOVA on participants’ overall proportion of accurate responses. We then examine how the inclusion of individual variability affects the pattern of results, by adopting a mixed-model regression analysis to examine accuracy on individual trials, and comparing different random effect structures.
2. Method
2.1 Participants
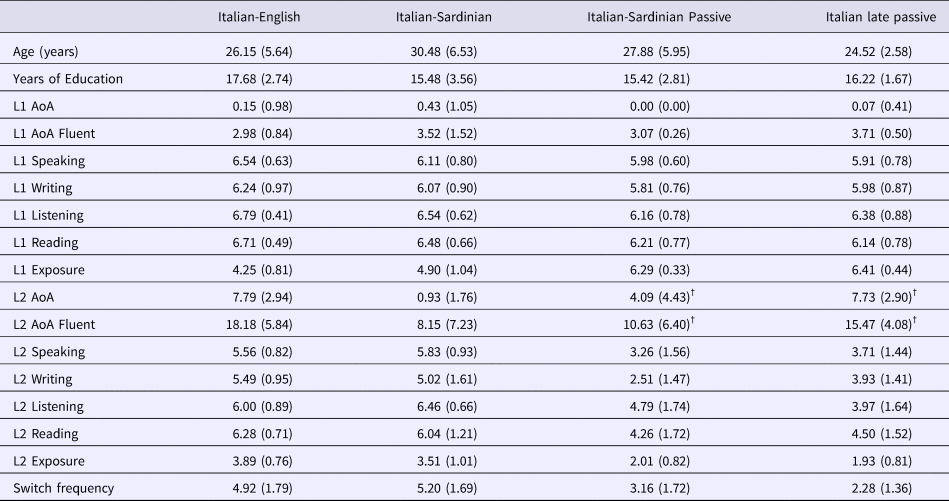
A total of 200 participants were included in this study, divided in four groups. The common selection criteria were being a native Italian speaker, age (between 18 and 40 years old) and having no history of language or cognitive impairment. All participants completed a Language History Questionnaire that provided measures of their proficiency and exposure to their different languages (Marian, Blumenfeld & Kaushanskaya, Reference Marian, Blumenfeld and Kaushanskaya2007; Luk & Bialystok, Reference Luk and Bialystok2013), rated on Likert scales from 1 to 7 (where 1 is the minimum). Table (1) shows the differences across the groups.
1) Italian–English bilinguals (N = 53, 34 females), mean age 26 years (SD = 5.6, range 18–40). These participants were Italian native speakers who have been living in Scotland on average for 3.7 years (SD = 3.5, range: 6 months–18 years) and were fluent in both Italian and English. They reported to be dominant in Italian and had acquired English in primary school. These participants were recruited through the University of Edinburgh and through the Italian community in Edinburgh. One more participant was tested but later excluded from the analysis because of performance lower than 20% on all types of trial; another participant was tested but then excluded from the analysis as they reported being an early, balanced bilingual.
2) Italian–Sardinian bilinguals (N = 46, 23 females), mean age 30.5 years (SD = 6.6, range 18–39). These participants were tested in different locations in Sardinia. They were recruited through word of mouth and social networks; in addition to common recruitment criteria, these participants were required to be fluent speakers of Sardinian. A further 9 participants were tested and excluded from the analysis (7 over 40 years of age, one for interruption of the task, and one for an error in the administration of the tasks).
3) Italian–Sardinian passive bilinguals (N = 43, 34 females), mean age 27.8 years (SD = 6, range 19–40). These participants were tested and recruited in Sardinia, also through word of mouth and social networks; in addition to common recruitment criteria, these participants were required to know Sardinian but not being active or fluent speakers of it. All participants reported some proficiency in Sardinian, although 7 participants reported never having ‘learnt Sardinian’; 25 participants reported never having become fluent in SardinianFootnote 1. 5 other participants were tested but excluded from the analysis (2 over 40 years of age, 2 for history of linguistic impairment, 1 for performance lower than 20% on all types of trial).
4) Italian late passive bilinguals (N = 58, 36 females), mean age 24.5 (SD = 2.5, range 20–35). These participants were recruited and tested at the University of Milan Bicocca, Italy. They reported a basic or medium proficiency in English, but no experience of prolonged immersion in the language; however, they reported using English for their studies and to access the media. 1 participant reported never having learnt English, and 6 participants reported never having become fluent in EnglishFootnote 2.
First, from the point of view of linguistic experience, the groups differed in terms of exposure to Italian and Sardinian or English, proficiency in their L2, and frequency of switching between their languages (see table 1). These differences revealed that Italian–Sardinian full bilinguals and Italian–English bilinguals were highly proficient bilinguals, that Italian–Sardinian passive bilinguals were less proficient bilinguals, that Italian–Sardinian full and passive bilinguals were early bilinguals, and that Italian–English bilinguals were late bilinguals. Finally, Italian participants tested in Milan were late, passive bilinguals, rather than monolinguals.
Mean and SD (in parentheses) for age (years) and years of education, self-rated language proficiency, exposure, and age of acquisition (AoA, years) (Likert scales 1–7). Values marked with (†) represent means ignoring missing values.

Second, mean age and years of education (used as a proxy for socio-economic status) differed across groups. In addition, self-rated Italian proficiency was comparable among all Sardinian participants and Italian participants tested in Milan, whereas Italian–English participants gave higher ratings of their Italian proficiency. Questionnaire responses showed a relation between age, years of education, and self-rated Italian proficiency. Specifically, the number of years of education was correlated with ratings of Italian proficiency (speaking, writing, listening, and reading, all r > 0.261, all p < .001). Age was also correlated to years of education (r = 0.298, p < .001), and to Italian writing (r =.179, p = .010) and reading proficiency (r = .139, p = .048), as well as to L2 listening proficiency (r = .169, p = .010). For this reason, and in order to exclude the confounding effects of age and years of education on the performance on the AX-CPT task, these two measures were regressed out from the analysis (see next section, and the limitations section for further discussion of these potential confounds).
2.2 Procedure and design
All participants were tested individually in a quiet room. The experimental session involved the AX-CPT, the Language History Questionnaire, two linguistic tasks for the highly proficient bilinguals (total duration 90 minutes), and one linguistic task for the passive bilinguals (total duration 60 minutes), for the purpose of a separate study. The order of the tasks was systematically counterbalanced across participants: among highly proficient bilingual participants (total n = 99), 28 took the AX-CPT as their first task, 30 took it as their second, and 41 as their third; among passive bilinguals (total n = 101), 48 took the AX-CPT as their first task, and 53 took it as their second. The other two tasks, for the highly proficient bilingual participants, were also counterbalanced in order. To control for any possible effect of order of administration, we coded the order of the AX-CPT task for each participant as a categorical variable with three levels, and regressed it out from all our analyses, in the same way as we dealt with age and years of education (see next section). All tasks were presented on a 13’’ laptop, 60 cm away from the participants’ eyes, in comparable light conditions; the instructions and the Language History Questionnaire were in Italian. All participants signed a consent form and were reimbursed £7/h in Scotland and €7/h in Italy for their participation. We adopted the version of the AX-CPT previously described. As mentioned, the AX-CPT presents fast sequences of letters in four types of trials (“AX”, “AY”, “BX”, “BY”, where Y stands for any probe other than X, and B stands for any cue other than A). Letters were presented one by one on a black screen for 300ms, with an interval between them of 1000ms, so that 4900ms elapsed between the cue and the probe. The task involved 100 trials (70 “AX”, 10 “AY”, 10 “BX”, 10 “BY”). The sequence of trials and the sequences of distractors (i.e., any 3 letters except A and X, and K and Y for visual similarity) between the cues and the probes were randomized for each participant. Half the participants pressed the z key for “yes” and the m key for “no”; the other half pressed m for “yes” and z for “no”. The experiment lasted approximately 13 minutes and was preceded by on-screen instructions, examples, and a practice session which included 10 practice trials. Half the way through the experiment, participants were invited to take a break.
3. Results
As “AX” trials were more frequent than the other types of trials, separate analyses were carried out on accuracy and reaction times (RT) in “AX” trials, and on accuracy and RT in “AY”, “BX”, and “BY” trials (Morales et al., Reference Morales, Gómez-Ariza and Bajo2013, Reference Morales, Yudes, Gómez-Ariza and Bajo2015; Braver et al., Reference Braver, Barch, Keys, Carter, Cohen, Kaye, Janowsky, Taylor, Yesavage, Mumenthaler, Jagust and Reed2001); RT for incorrect trials were excluded from the analysis. For each analysis, we regressed out age, years of education, and order of tasks by fitting a regression model on accuracy and RT with these three variables as predictors. The residuals of these models were then used as the dependent variable for further analyses (Coco & Keller Reference Coco and Keller2015).
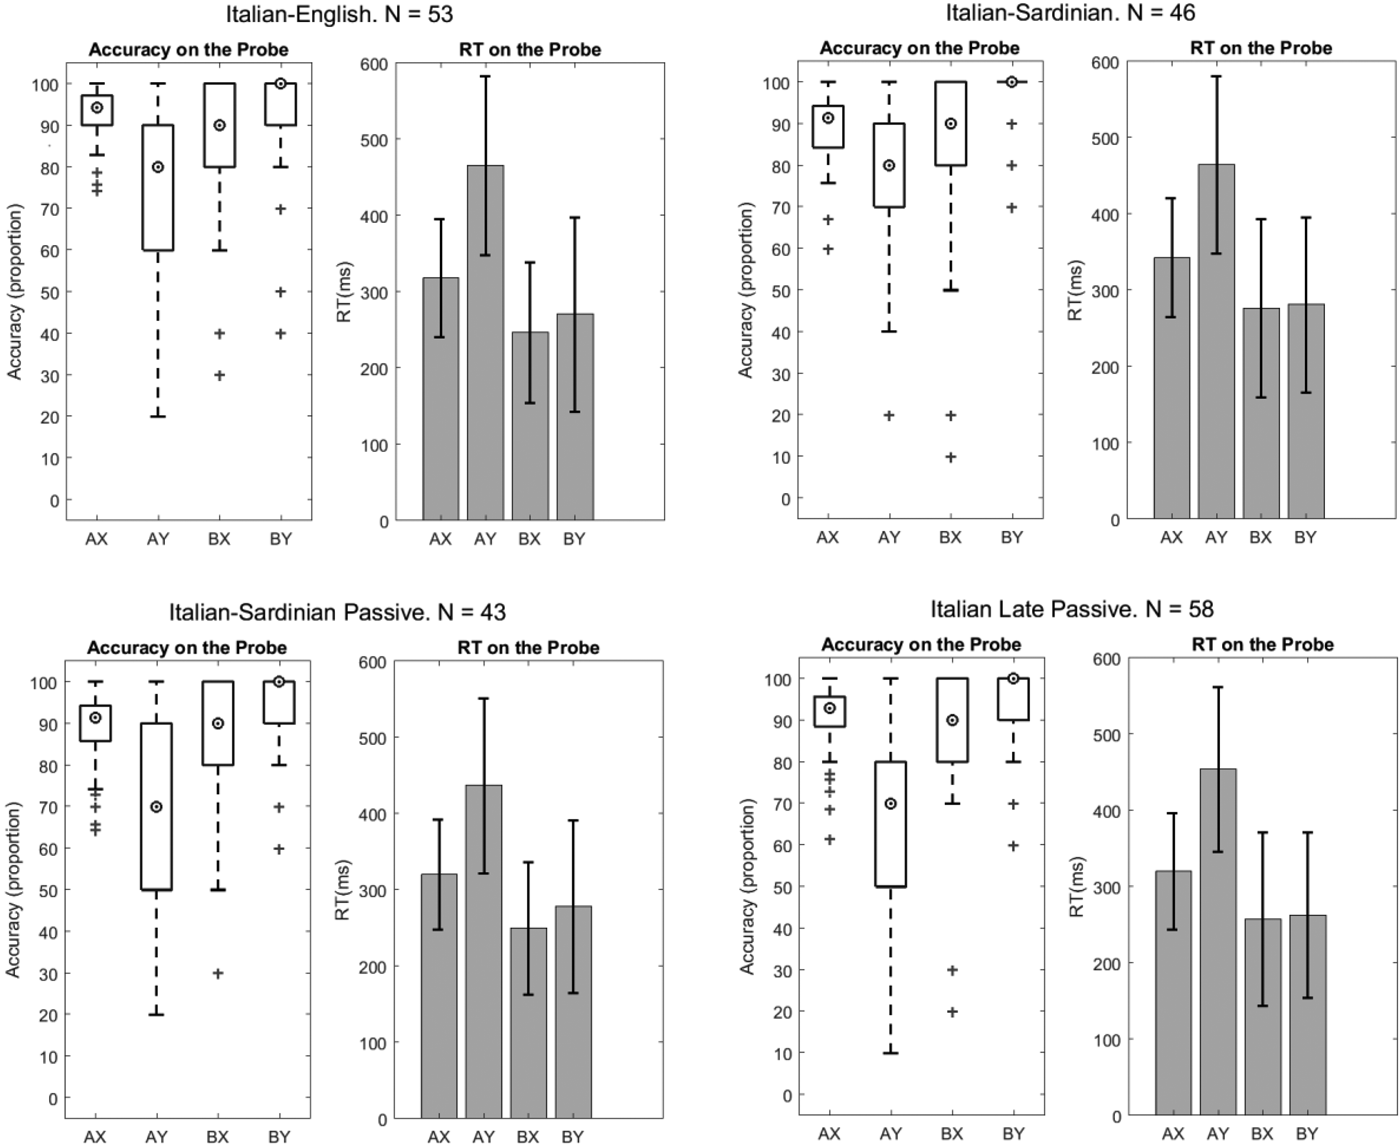
We analysed the data in two ways. First, we analysed overall proportions of accurate responses in each condition following the analysis reported by Morales et al. (Reference Morales, Gómez-Ariza and Bajo2013), i.e., ANOVA, in order to investigate whether there was a difference in accuracy between groups when variability between individuals and variability within individuals across conditions was not taken into account. Second, we examined how the factorization of individual variability affected the results, by running a mixed-model regression on the residuals of accuracy as a binomial variable, with a maximal random structure. The motivation to do so was to implement a better model of accuracy data and to use a larger number of data-points to include a more complete and theoretically motivated random effects structure: specifically, one that specifies a random intercept for subject and a random slope for condition by subject (Barr et al., Reference Barr, Levy, Scheepers and Tily2013; Dixon, Reference Dixon2008). This random effects structure follows the hypothesis that not only does performance vary between individuals, but also that the difference in performance in each condition varies across individuals. Raw measures of accuracy and RT are presented in Table 2 and 3 and visualised in Figure 2.
Accuracy and Reaction Times (ms) on the probe across conditions and groups. Bars = SD.

Mean accuracy (proportions) and SD (in parentheses) across conditions and groups.

Mean Reaction Times (ms) and SD (in parentheses) across conditions and groups.

3.1 Analysis of accuracy proportions
We first analysed accuracy as overall proportions of accurate responses (i.e., aggregated over individual observations), adopting mixed regression models with a random intercept for subject. These mixed-model regressions are equivalent to repeated-measure ANOVAs, following Morales et al. (Reference Morales, Gómez-Ariza and Bajo2013). We analysed “AX” trials separately from “AY”, “BY”, “BX” trials. For “AX”, we fitted a mixed-model regression with a random intercept for subject and group as fixed effect. This analysis showed no difference between the groups (p = .148).
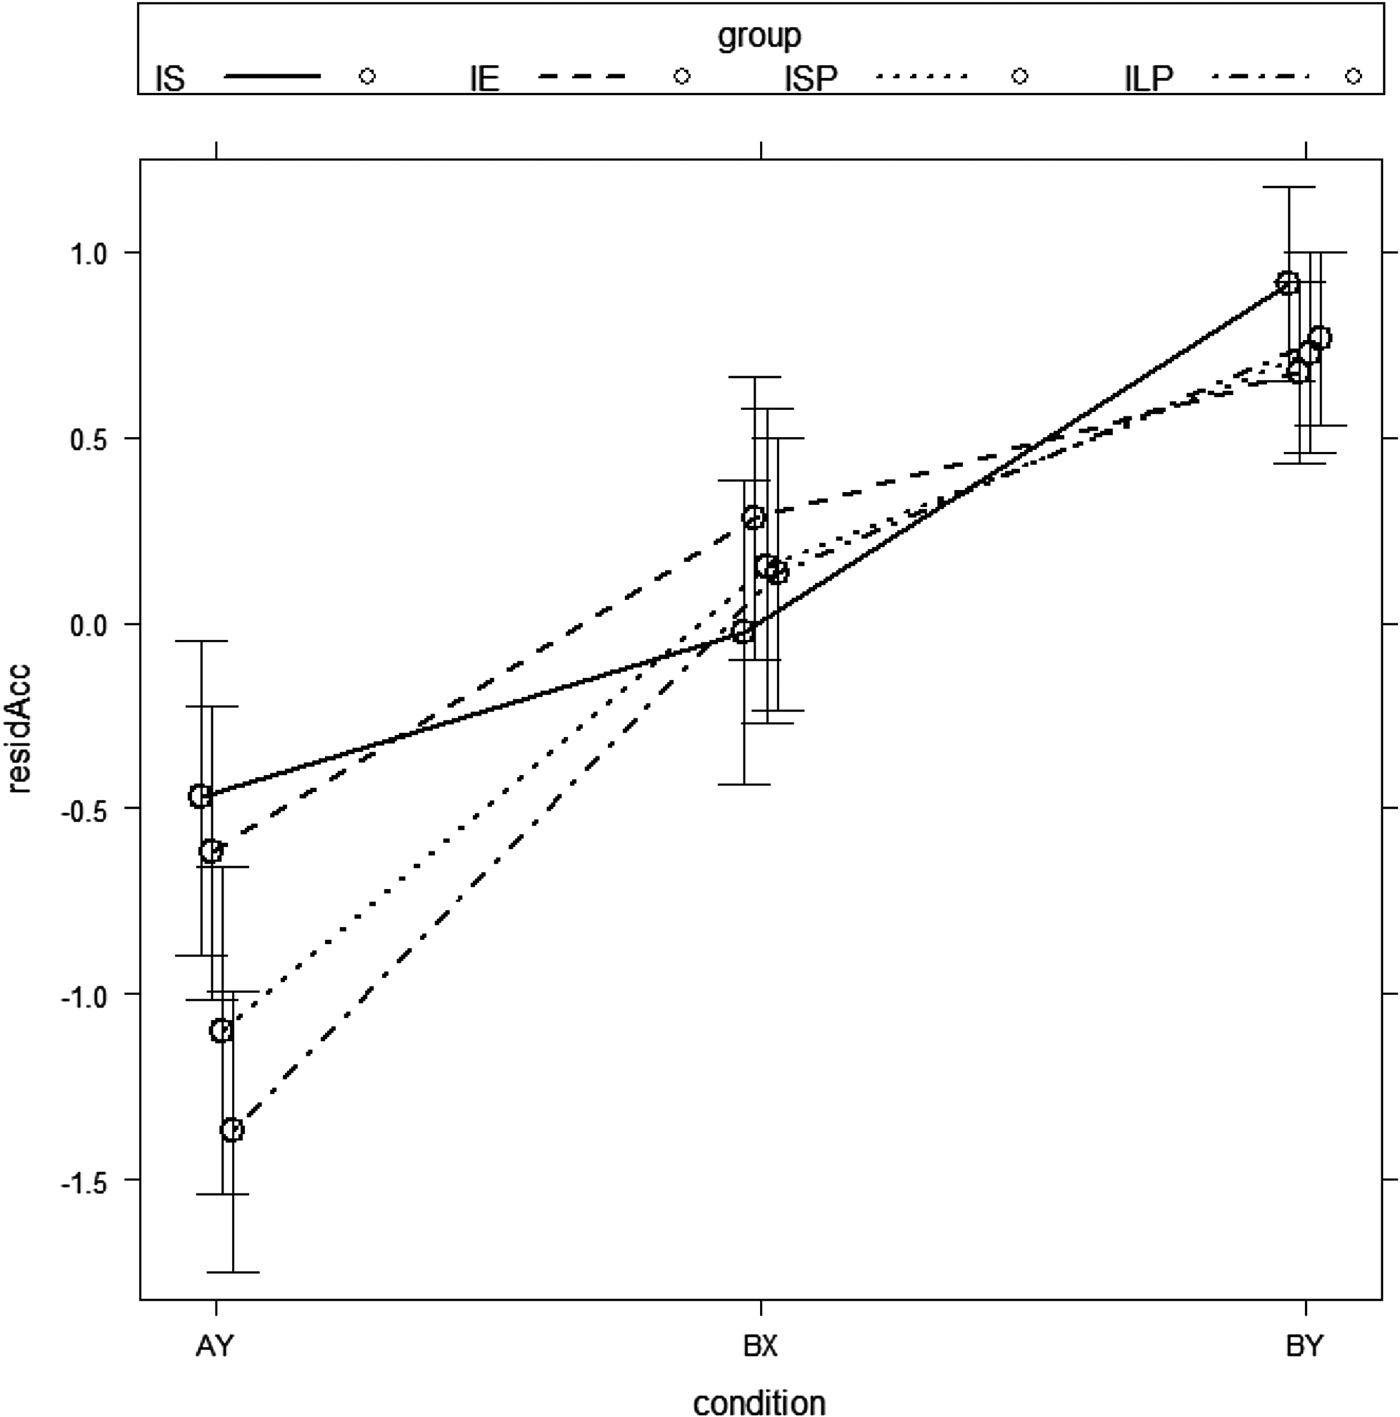
For the analysis of “AY”, “BY”, “BX” conditions, we fitted a mixed-model regression with a random intercept for subject, and group and condition as fixed effects (Figure 3). We found a main effect of condition (p < .001): accuracy was significantly lower in the “AY” condition (β = −0.180, SE = 0.030, t = −5.859) and in the “BX” condition (β = −0.123, SE = 0.030, t = −4.024), compared to the “BY” condition (which constitutes the baseline). In these trials, the effect of group was not significant (p = .140), but the interaction between condition and group was significant (p = .003). Pairwise comparison (Tukey's test) showed that Italian late passive bilinguals were significantly worse on the “AY” condition than Italian-Sardinian bilinguals (Estimate = −0.128, SE = 0.033, z-value = −3.830, adjusted p < .01); Italian late passive bilinguals were marginally worse than Italian–English participants (Estimate = −0.099, SE = 0.032, z-value = −3.081, adjusted p = .084). Groups did not differ either in the “BX” condition (all adjusted p > .977) or in the “BY” condition (all adjusted p > .999).
Model fit of residuals of accuracy in “AY”, “BX”, “BY”. IS: Italian-Sardinian, IE: Italian-English, ISP: Italian-Sardinian Passive, ILP: Italian Late Passive. Bars = 95% C.I.

3.2 Analysis of reaction times
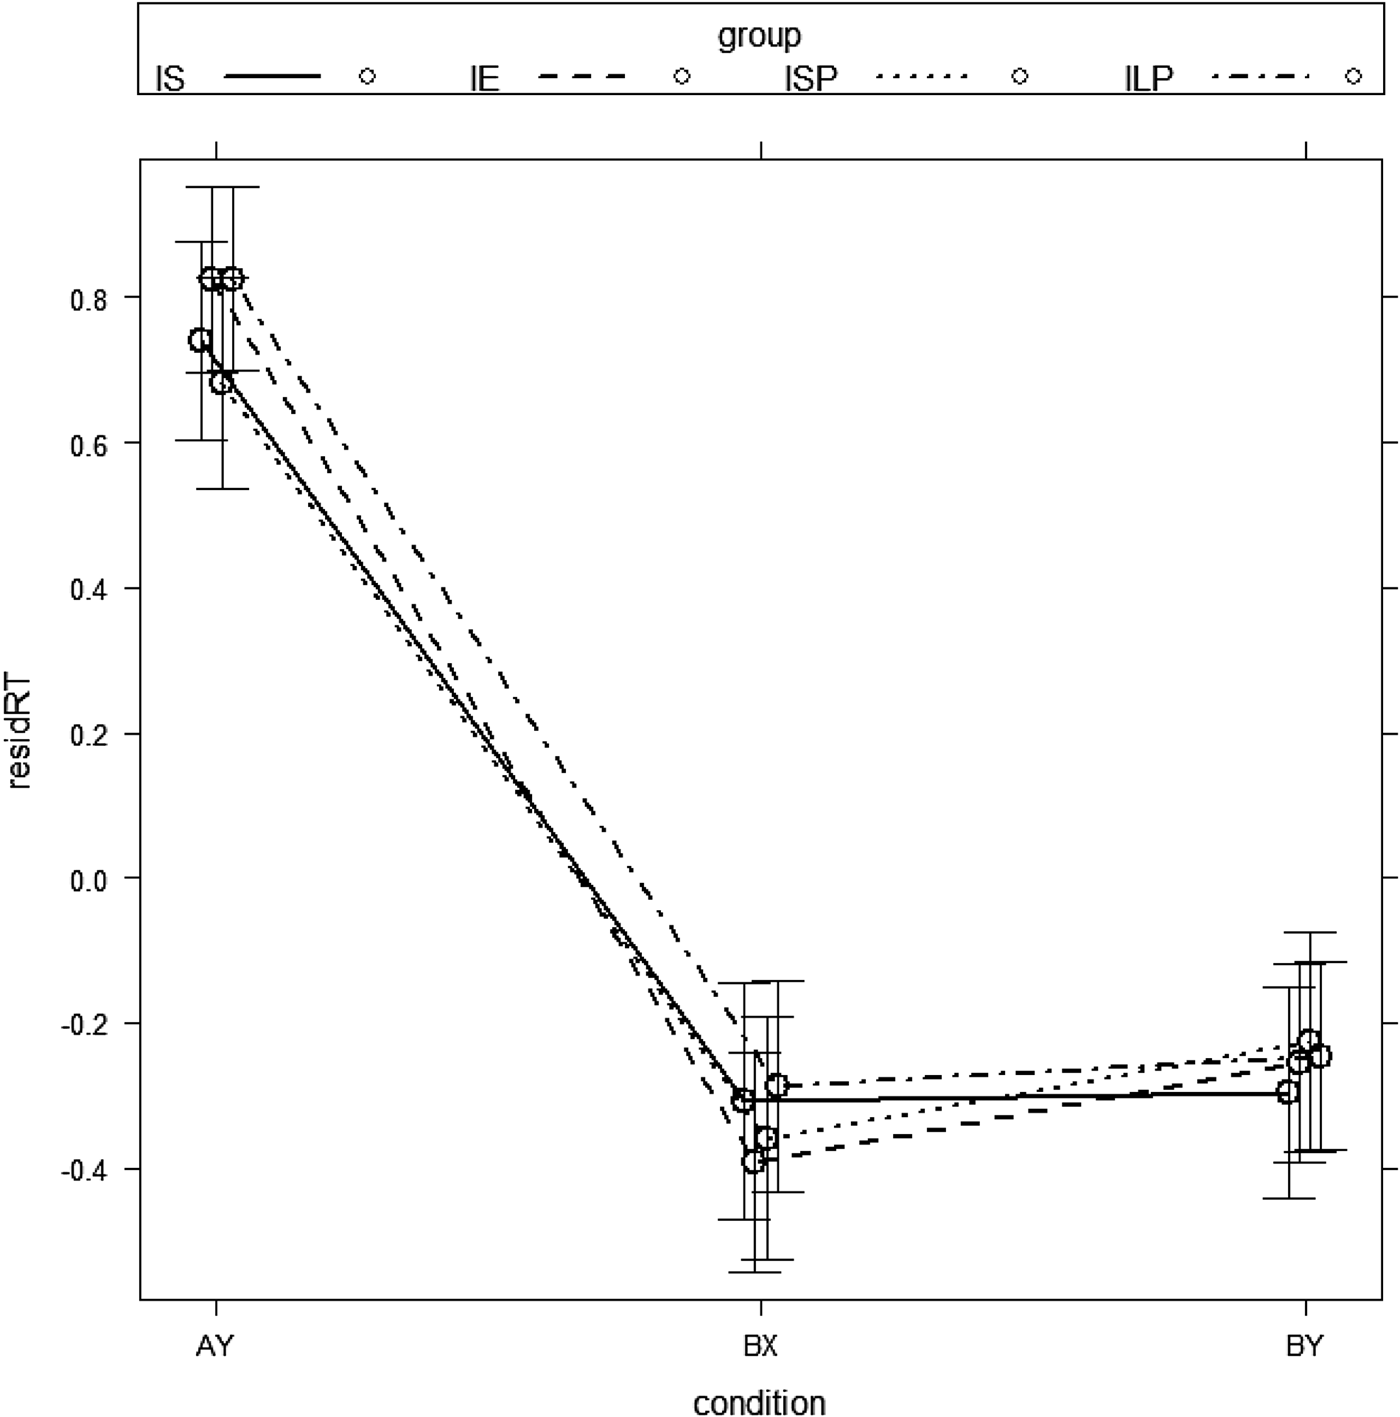
With regards to RT, we fitted two comparable linear mixed-model regressions, equivalent to repeated-measure ANOVA (i.e., with only by-subject random intercept) on aggregated RT. In RT in “AX” trials, we found no difference between groups (p = .502). For RT in “AY”, “BY”, “BX” conditions, we fitted a comparable linear mixed-model regression including group and condition as fixed effects (Figure 4). There was a main effect of condition (p < .001), with longer RT in “AY” (β = 183.768, SE = 14.644, t = 12.546) with respect to “BY”. The effect of group was not significant (p = .870), and there was no interaction between group and condition (p = .390). We also ran a mixed-model regression on un-aggregated RT with a full random effect structure (specified as in the models presented in the next section). The results of this analysis were comparable to the results of the repeated measure ANOVA.
Model fit of residuals of RT in “AY”, “BX”, “BY”. IS: Italian-Sardinian, IE: Italian-English, ISP: Italian-Sardinian Passive, ILP: Italian Late Passive. Bars = 95% C.I.

3.3 Binomial mixed-model regression of accuracy
Our second analysis of accuracy aimed to evaluate whether the results obtained through the analysis of aggregated scores would hold after the inclusion of individual variability, i.e., random effects structure modelling variability between individuals, as well as variability between individuals across conditions. Therefore, we ran a further analysis on accuracy as a binomial dependent variable. We first regressed out age, years of education and order of trials, as in our first analysis.
For the “AX” condition, we fitted a mixed-model regression specifying a by-subject intercept and group as the fixed effect. As in our first analysis, we found no effect of group (p = .129).
For the “AY”, “BY”, and “BX” conditions, we fitted a mixed-model regression specifying a by-subject intercept and a condition by subject slope. Group and condition were the fixed effects. The effect of condition was significant (p < .001): performance in “AY” and in “BX” was significantly worse than in “BY” (respectively: β = −1.384, SE = 0.225, t = −6.134; β = −0.937, SE = 0.194, t = −4.815). The effect of group was not significant (p = .438), but the interaction between condition and group was significant (p = .019). However, pairwise comparison with Tukey's test showed that, in the “AY” condition, there was no difference between groups. In particular, the difference between Italian–Sardinian bilinguals and Italian late passive bilinguals was only marginally significant (Estimate = −0.898, SE = 0.290, z-value = −3.091, adjusted p = .076). No difference was found across groups on “BX” and “BY” conditions (all adjusted p > .971), suggesting that the interaction between groups and conditions was led by differences, across groups, on different conditions, but not in each condition individually examined.
To discriminate the specific contribution of the random effects structure we tested two further models. First, to demonstrate that the inclusion of both a random intercept by subject and a random slope for condition by subject was the critical factor affecting the generalizability of the interaction between groups and conditions on “AY” trials, we compared this model to a model of the residuals of accuracy (after the regression of age, years of education and order of tasks) that included only a random intercept by subject (i.e., did not include a random slope for condition by subject). While no differences were found across groups on “BX” and “BY” conditions (all adjusted p > .96), the performance of the Italian late passive group on “AY” trials was significantly worse than the performance of the Italian–Sardinian group (Estimate = −0.898, SE = 0.219, z-value = −4.098, adjusted p < .01), and so was the performance of the Italian–English group with respect to the Italian late passive group (adjusted p = .017). In a further model that eliminated the random structure altogether (i.e., included neither a random intercept by subject, nor a random slope for condition by subject), not only did both highly proficient bilingual groups show an advantage over the late passive group (Italian late passive bilinguals – Italian–Sardinian bilinguals: Estimate = −0.898, SE = 0.164, z-value = −5.467, adjusted p < .01; Italian late passive bilinguals – Italian–English bilinguals: Estimate = −0.749, SE = 0.158, z-value = −4.742, adjusted p < .01), but Italian–Sardinian bilinguals also performed significantly better on “AY” trials than the Italian–Sardinian passive bilinguals (Italian–Sardinian passive bilinguals – Italian–Sardinian bilinguals: Estimate = −0.626, SE = 0.176, z-value = −3.549, adjusted p = .019). Again, no difference was found across groups on “BX” and “BY” conditions (all adjusted p > .8).
4. Discussion
The first aim of this study was to examine the effect of the bilingual experience on cognitive control abilities, using a task whose structure was theoretically motivated by an established model of executive functions and its proposed relation to language control in bilinguals. Specifically, we compared the performance of four different bilingual groups, which differed with respect to age of acquisition and proficiency, on the AX-CPT, a task of continuous performance previously used to evaluate the dual-mechanism framework of cognitive control (Braver et al., Reference Braver, Gray, Burgess, Conway, Jarrold, Kane, Miyake and Towse2007; Braver Reference Braver2012). The second aim was to evaluate whether group differences previously found using the same task stand up to the factorization of individual variability, and how they relate to specific differences in type of bilingual experience (along the dimensions of age of acquisition and proficiency). We now discuss our results relating to these aims in turn, and then discuss the limitations of our study.
First, in a series of analyses that aggregated accuracy over individual observations only using by-subject intercepts as a measure of individual variability, we found a group difference in performance between Italian–Sardinian bilinguals and Italian late passive bilinguals, consistent with previous studies (Morales et al., Reference Morales, Gómez-Ariza and Bajo2013, Reference Morales, Yudes, Gómez-Ariza and Bajo2015). Specifically, we found a significant interaction between group and condition in the accuracy of our participants, with the Italian–Sardinian bilingual group performing better than the Italian late passive group on the “AY” condition, but showing comparable performance on the “AX”, “BX” and “BY” conditions. The Italian–English bilingual group performed marginally better on this condition with respect to the late passive group. Better performance on the “AY” condition – all other conditions being equal – can be argued to reflect the ability to adjust proactive and reactive control mechanisms to adapt to the context, following the assumption of a trade-off between the different mechanisms of cognitive control. These results are compatible with previous claims for the effect of the bilingual experience on the flexible engagement and modulation of mechanisms of cognitive control (Morales et al., Reference Morales, Gómez-Ariza and Bajo2013, Reference Morales, Yudes, Gómez-Ariza and Bajo2015; Green & Abutalebi, Reference Green and Abutalebi2013).
Importantly, among our four bilingual groups, we found a difference between early, highly proficient bilinguals on the one hand, and late, passive bilinguals on the other. We therefore extended the results of Morales et al. (Reference Morales, Gómez-Ariza and Bajo2013, Reference Morales, Yudes, Gómez-Ariza and Bajo2015), by identifying the contribution of specific aspects of the bilingual experience on the modulation of control processes. Specifically, high proficiency in both active and passive modalities was related to better performance, but only early highly proficient bilinguals seemed to perform significantly better than late, low proficient passive bilinguals, whereas highly proficient late bilinguals did not. This suggests that early age of acquisition and high proficiency (in both active and passive modalities) may result in cognitive effects, but that each of these variables, individually examined, may not relate to better performance on cognitive control. This result highlights the interaction of different dimensions of the bilingual experience, and the importance of focusing on these dimensions in the study of the relation between bilingualism and executive functions. The same analytical approach, however, did not show a difference between groups with respect to RT, contra Morales et al.’s (Reference Morales, Gómez-Ariza and Bajo2013) results, but in keeping with Morales et al. (Reference Morales, Yudes, Gómez-Ariza and Bajo2015).
Second, we evaluated the generalizability of these findings, not only by using different populations and larger sample sizes than in Morales et al. (Reference Morales, Gómez-Ariza and Bajo2013), but also by investigating whether group differences remained when we included an accurate measure of individual variability in the analysis, based on the hypothesis that individual variance in executive functions may represent an important confound in group comparisons, and affect the generalizability of the findings. We therefore analysed raw accuracy, i.e., accuracy in binomial format rather than as proportion scores, using a mixed-model regression, that allowed us to model both random variability between subjects (by-subject intercepts) as well as individual variability in performance across conditions (random slopes for condition by subject). This analysis supported the pattern and direction of data that we found in the analysis over proportions of accurate responses; but, critically, it did not show a significant difference between groups on the “AY” condition (i.e., while the interaction between group and condition was still significant, the pairwise comparison between groups in each condition was not).
To discriminate the contribution of the random effects structure to the analysis of this type of data, we compared the full random effects model to a by-subject-intercept-only model, as well as to a model with no random structure at all. When the random effects structure was simplified in this way, the results suggested group differences. The by-subject-intercept-only model suggested an advantage in favour of both highly proficient bilingual groups with respect to the late passive group. The model with no random effects structure further suggested an advantage for the Italian–Sardinian active bilinguals over the Italian–Sardinian Passive bilinguals (in addition to an advantage for both groups over the late passive group). Taken together, these analyses show that the exclusion of individual variability is directly related to the generalisability of group differences.
Hence, this comparison highlights the importance of considering individual variability in the study of the relationship between language and cognitive control, both methodologically and theoretically. Analyses that did not consider such variability (i.e., in which the random effects structure was reduced) produced results that were consistent with a group difference in proficiency, independent of age of acquisition, and – when the random effects structure was completely eliminated – an advantage of highly proficient bilinguals over low proficient ones. But as our analyses show, the exclusion of individual variability misleadingly flattens the differences between our bilingual groups, and inflates the effect of group averaging, a statistical artefact not uncommon in psychological research (Speelman & McGann, Reference Speelman and McGann2013; Speelman & Muller Townsend, Reference Speelman and Muller Townsend2015). By doing so, it also inflates Type I error. Thus, the exclusion of individual variability can result in a spurious link between individual aspects of the bilingual experience (e.g., age of acquisition, language proficiency) and performance in cognitive control. Consequently, our findings demonstrate that the inappropriate factorization on individual variability can ultimately obscure the contribution of these specific dimensions to a model of bilingual language control, as well as of a model of the bilingual mind in terms of cognitive plasticity.
While our study suggests important implications for future research on bilingualism and non-linguistic abilities, it also presents various limitations. Specifically, the four groups of participants we tested did not only differed in terms of age of acquisition and proficiency, but also in terms of language distance, contexts of use, as well as in other ways unrelated to their bilingual experience. We first address the linguistic differences and then the non-linguistic ones.
With regards to language distance, Italian and Sardinian are of course more closely related than Italian and English (from the points of view of typology, syntax, morphology and phonology). In addition, Italian, Sardinian and English do not have the same status, as Sardinian – albeit official – is a minority language. Language distance for sure represents an important factor for bilingual language processing; however, its effects on cognitive control are undocumented, and thereby represent an interesting venue for future research.
With regards to contexts of use, Italian and English were used in both formal and informal context in the Italian–English and the Italian late passive group, whereas in the Italian–Sardinian groups, Italian was typically associated with formal contexts, and Sardinian with informal ones (and with informal learning too). The effects of contexts of use have been related to the engagement of cognitive control components (Green & Abutalebi, Reference Green and Abutalebi2013). We operationalised contexts of use in terms of active versus passive proficiency and exposure – a distinction that we considered in the comparison between our groups. However, developing a quantitative measure of this aspect of the bilingual experience would undoubtedly be useful for future research.
Finally, our groups also presented differences in age, level of education, and context of recruitment. With respect to age, while all participants were aged between 18 and 40, the participants tested in Sardinia were on average older than the participants tested in Scotland (Italian–English group) and in Italy (Italian late passive group). With respect to the level of education – which can be considered a proxy for socio-economic status in the Italian context – the participants in the Italian–English group and in the Italian late passive group were university students, primarily at postgraduate level in the former group, and at the graduate level in the latter group. Student status is linked to the context of recruitment, which happened through word of mouth in Sardinia, and primarily through university recruitment channels in Scotland and in Italy. Age and student status may obviously have important relationships with measures of executive functions, language processing and general intelligence, while context of recruitment may relate to attitudes and motivations towards participation in the experiments (e.g., participants in Sardinia may have been more intrinsically motivated while participants recruited through university channels may have been more extrinsically motivated). While controlling more strictly for these differences at the recruitment stage would have been ideal, we controlled for the possible effects of differences in age and in level of education by analysing the correlation within responses to the language history questionnaire across groups, and by regressing out these predictors from the analysis – i.e., performing our analyses on the variance not explained by these factors. However, it is important to notice how further research in this field needs to address these aspects in a more controlled way.
To conclude, our study identifies an explicit theoretical model and a reliable task that suggest a possible relationship between specific aspects of the bilingual experience (early age of acquisition and high proficiency in both active and passive modalities) and cognitive control abilities. However, our study does not support the unequivocal existence of cognitive effects related to the bilingual experience, as we found no more than a marginal trend in favour of early, highly proficient bilinguals over late passive ones: the effects of the bilingual experience may not be strong enough to over-ride the effects of individual variability on executive functions. Therefore, our study highlights the empirical aspects that limit our ability to measure the effects of bilingualism on general cognition: as we show, this type of investigation cannot be meaningfully pursued without taking into account individual variability, which represents a major challenge in the study of executive functions. These two results – the identification of a theoretical model and of a laboratory task, on the one hand, and the demonstration of the role of individual variability in the study of bilingualism, on the other – can inform theoretical and methodological choices for future research on the cognitive effects of the bilingual experience.
Acknowledgements
Testing and recruiting in Sardinia has been possible thanks to the help of Giuseppe Corongiu, Francesco Cheratzu, su Coordinamentu pro su Sardu Ufitziale, Daniela Corongiu, Giuseppe Melis, Salvatore Serra, Dolores Lai, Maria Antonietta Pinna, Maria Leonarda Corredda, Francesca Sini, Giovanna Bosu, Immacolata Salis. We thank Maria Teresa Guasti, Francesca Foppolo and Mirta Vernice for helping testing and recruiting in Milan. This project has received funding from the European Union's Seventh Framework Programme for research, technological development and demonstration under grant agreement no. 613465.