I. INTRODUCTION
Bumetanide (brand names Bumex® and Burinex®) is a loop diuretic that is often prescribed to treat heart failure. The high potency and bioavailability of this drug make it a viable option for individuals who do not respond appropriately to furosemide, a similar pharmaceutical. Bumetanide works by blocking the cation-chloride co-transporter NKCC1 (membrane transport protein, Na–K–Cl), decreasing chloride concentration in neurons and consequently intensifying the inhibitory effect of GABA (γ-aminobutryic acid). GABA is a chief inhibitory neurotransmitter in the central nervous system. It is directly responsible for muscle tone. This mechanism of action makes bumetanide a potential anti-seizure drug (Löscher et al., Reference Löscher, Puskarjov and Kaila2013). Despite the multitude of positive effects of this diuretic, bumetanide can also be misused and abused to circumvent the law. In 2008, four United States National Football League players were suspended under the organization's steroid policy for taking bumetanide (http://www.espn.com/nfl/news/story?id=3661845). The diuretic effects promote weight loss and dilute the contents of urine, masking the presence of other substances, such as steroids. The IUPAC name (CAS Registry number 28395-03-1) is 3-(Butylamino)-4-phenoxy-5-sulfamoylbenzoic acid. A two-dimensional molecular diagram is shown in Figure 1.
The molecular structure of bumetanide.

A low-precision experimental powder pattern is contained in the Powder Diffraction File™ as entry 00-041-1699 (Bernstein and Zevin, Reference Bernstein and Zevin1990). An additional low-precision pattern is included as entry 00-050-2149 (Tata et al., Reference Tata, Venkataramanan and Sahota1993). Another polymorph of bumetanide has been reported recently by Allu et al. (Reference Allu, Bolla, Tothadi and Nangia2017; CSD Refcode FEDGON).
This work was carried out as part of a project (Kaduk et al., Reference Kaduk, Crowder, Zhong, Fawcett and Suchomel2014) to determine the crystal structures of large-volume commercial pharmaceuticals, and include high-quality powder diffraction data for these pharmaceuticals in the Powder Diffraction File (Fawcett et al., Reference Fawcett, Kabekkodu, Blanton and Blanton2017).
II. EXPERIMENTAL
Bumetanide was a commercial reagent, purchased from United States Pharmacopeial Convention (Lot # R039M0), and was used as-received. The white powder was packed into a 1.5 mm diameter Kapton capillary, and rotated during the measurement at ~50 cycles s−1. The powder pattern was measured at 295 K at beam line 11-BM (Lee et al., Reference Lee, Shu, Ramanathan, Preissner, Wang, Beno, Von Dreele, Ribaud, Kurtz, Antao, Jiao and Toby2008; Wang et al., Reference Wang, Toby, Lee, Ribaud, Antao, Kurtz, Ramanathan, Von Dreele and Beno2008) of the Advanced Photon Source at Argonne National Laboratory using a wavelength of 0.413342 Å from 0.5 to 50° 2θ with a step size of 0.001° and a counting time of 0.1 s step−1.
The pattern was indexed on a primitive triclinic unit cell with a = 5.009, b = 9.231, c = 19.599, α = 80.794, β = 82.840, γ = 86.814°, V = 885.27 Å3, and Z = 2 using N-TREOR (Altomare et al., Reference Altomare, Cuocci, Giacovazzo, Moliterni, Rizzi, Corriero and Falcicchio2013). A reduced cell search in the Cambridge Structural Database (Groom et al., Reference Groom, Bruno, Lightfoot and Ward2016) combined with the chemistry C, H, N, O, and S only yielded no hits. A connectivity search on bumetanide yielded several cocrystals as well as a monoclinic polymorph of bumetanide (Allu et al., Reference Allu, Bolla, Tothadi and Nangia2017; Refcode FEDGON). The structure of bumetanide was built and its conformation optimized using Spartan ‘16 (Wavefunction, 2017). The resulting mol2 file was converted into a Fenske-Hall Z-matrix file using OpenBabel (O'Boyle et al., Reference O'Boyle, Banck, James, Morley, Vandermeersch and Hutchison2011). The structure was solved with FOX (Favre-Nicolin and Černý, Reference Favre-Nicolin and Černý2002). Most of the solutions had very similar and low cost factors.
Rietveld refinement was carried out using GSAS (Larson and Von Dreele, Reference Larson and Von Dreele2004; Toby, Reference Toby2001). Only the 1.0–25.0° portion of the pattern was included in the refinement (d min = 0.957 Å). A peak from the Kapton capillary was omitted by an excluded region of 1.4–1.9°. All non-H bond distances and angles were subjected to restraints, based on a Mercury/Mogul Geometry Check (Bruno et al., Reference Bruno, Cole, Kessler, Luo, Motherwell, Purkis, Smith, Taylor, Cooper, Harris and Orpen2004; Sykes et al., Reference Sykes, McCabe, Allen, Battle, Bruno and Wood2011) of the molecule. The Mogul average and standard deviation for each quantity were used as the restraint parameters. The restraints contributed 2.6% to the final χ 2. The hydrogen atoms were included in calculated positions, which were recalculated during the refinement using Materials Studio (Dassault, 2017). Positions of the active hydrogens were derived by analysis of potential hydrogen-bonding patterns. A common U iso was refined for the carbon atoms of each phenyl ring, another U iso for the two oxygens and nitrogen bound to the sulfur, another for the carboxylic acid group, and a common U iso for the N13 and the carbon atoms of the butyl side chain. The U iso for each hydrogen atom was constrained to be 1.3× that of the heavy atom to which it is attached. The peak profiles were described using profile function #4 (Thompson et al., Reference Thompson, Cox and Hastings1987; Finger et al., Reference Finger, Cox and Jephcoat1994), which includes the Stephens (Reference Stephens1999) anisotropic strain broadening model. The background was modeled using a two-term shifted Chebyshev polynomial, with a seven-term diffuse scattering function to model the Kapton capillary and any amorphous component.
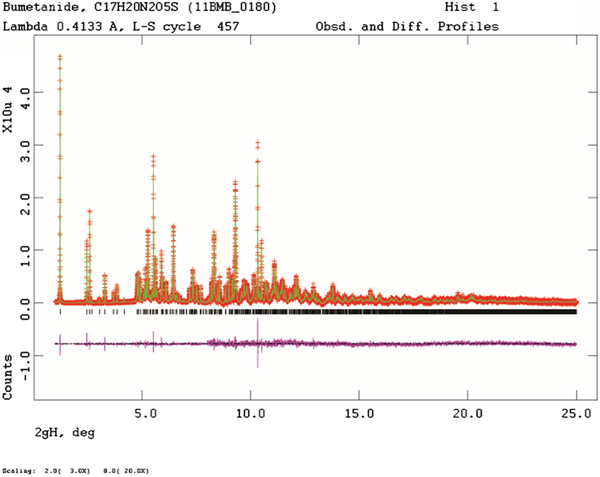
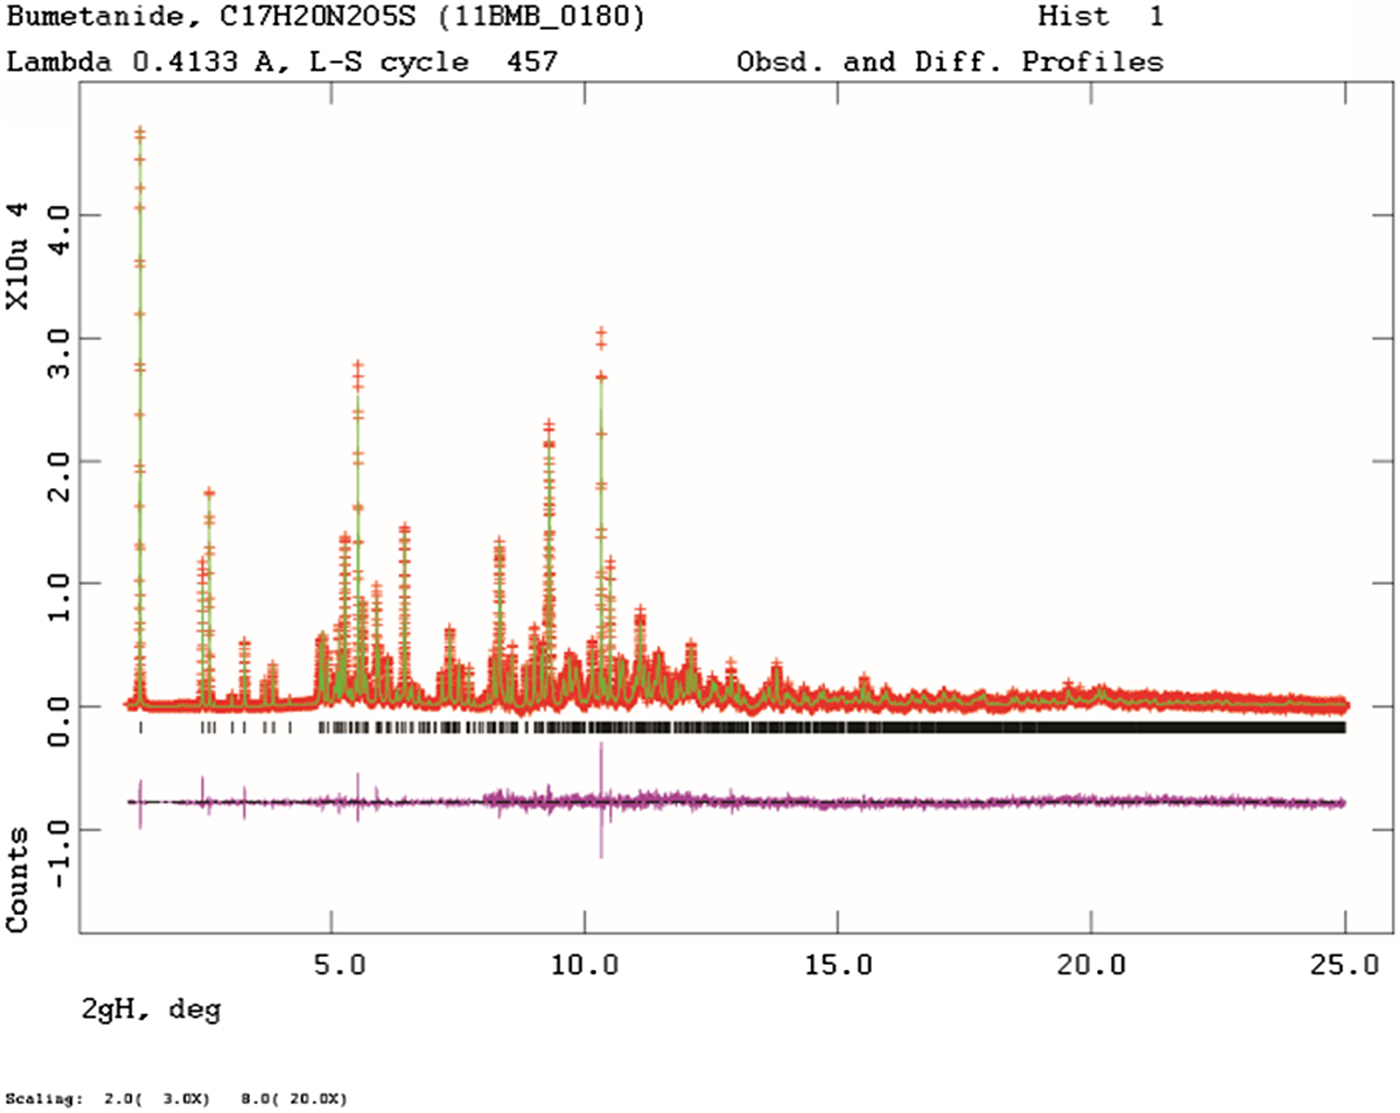
The final refinement of 107 variables using 23 569 observations (23 502 data points and 67 restraints) yielded the residuals R wp = 0.0781, R p = 0.0596, and χ2 = 1.252. The largest peak (1.15 Å from H30) and hole (1.26 Å from H26) in the difference Fourier map were 0.45 and −0.55 eÅ−3, respectively. The Rietveld plot is included as Figure 2. The largest errors in the fit are in the positions of some of the strong, low angle peaks, and may reflect sample decomposition in the beam.
(Color online) The Rietveld plot for the refinement of bumetanide. The red crosses represent the observed data points, and the green line is the calculated pattern. The blue curve is the difference pattern, plotted at the same vertical scale as the other patterns. The vertical scale has been multiplied by a factor of 3 for 2θ > 2.0°, and by a factor of 20 for 2θ > 8.0°.
A density functional geometry optimization (fixed experimental unit cell) was carried out using VASP (Kresse and Furthmüller, Reference Kresse and And Furthmüller1996). The calculation used the GGA-PBE functional, a plane wave cut-off energy of 400.0 eV, and a k-point spacing of 0.5 Å−1 leading to a 3 × 2 × 1 mesh. The calculation was carried out on 16 2.4 GHz processors (each with 4 Gb RAM) of a 64-processor HP Proliant DL580 Generation 7 Linux cluster at North Central College, and took ~3.3 h. A density functional geometry optimization was also carried out using CRYSTAL14 (Dovesi et al., Reference Dovesi, Orlando, Erba, Zicovich-Wilson, Civalleri, Casassa, Maschio, Ferrabone, De La Pierre, D-Arco, Noël, Causà and Kirtman2014). The basis sets for the H, C, N, and O atoms were those of Gatti et al. (Reference Gatti, Saunders and Roetti1994), and the basis set for sulfur was that of Peintinger et al. (Reference Peintinger, Vilela Oliveira and Bredow2013). The calculation was run on eight 2.1 GHz Xeon cores (each with 6 Gb RAM) of a 304-core Dell Linux cluster at IIT, using 8 k-points and the B3LYP functional, and took ~12 h.
III. RESULTS AND DISCUSSION
The experimental powder pattern of bumetanide matches that from Tata et al. (Reference Tata, Venkataramanan and Sahota1993) well enough to conclude that the materials are the same (Figure 3). The pattern from Tata et al. (Reference Tata, Venkataramanan and Sahota1993) does contain low-intensity extra peaks, suggesting that their sample was a mixture. These peaks do not correspond to the FEDGON polymorph (Allu et al., Reference Allu, Bolla, Tothadi and Nangia2017), so the identity of the impurity phase is unknown. The pattern of Bernstein and Zevin (Reference Bernstein and Zevin1990) seems to be from a phase-pure sample, but both existing database patterns are missing many weak peaks observed in the synchrotron pattern.
(Color online) Comparison of the synchrotron powder diffraction pattern to the laboratory X-ray powder diffraction pattern of Tata et al. (Reference Tata, Venkataramanan and Sahota1993). The literature laboratory pattern (measured using CuK α radiation) was digitized using UN-SCAN-IT (Silk Scientific, 2013), and re-scaled to the synchrotron wavelength of 0.413342 Å using Jade 9.8 (MDI, 2017).

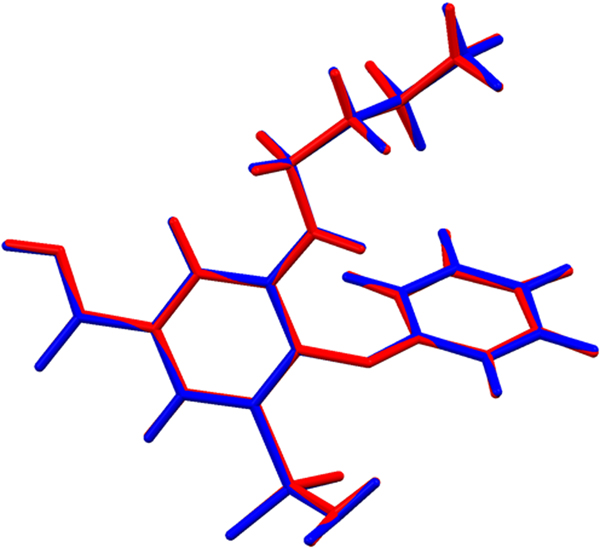
The refined atom coordinates of bumetanide and the coordinates from the DFT optimizations are reported in the CIFs attached as Supplementary Material. Comparing the Rietveld refined structure and the VASP optimized structures, the root-mean-square Cartesian displacement of the non-hydrogen atoms in the bumetanide molecules is 0.088 Å (Figure 4). The largest deviation is 0.145 Å at C17. Similar comparison of the experimental and CRYSTAL14 structures yields a RMS displacement of 0.101 Å and a maximum of 0.166 Å at N4. The RMS displacement between the VASP and CRYSTAL 14 structures is only 0.033 Å. The excellent agreement between the refined and optimized structures is evidence that the experimental structure is correct (van de Streek and Neumann, Reference van de Streek and Neumann2014). This discussion concentrates on the CRYSTAL-optimized structure. The asymmetric unit (with atom numbering) is illustrated in Figure 5, and the crystal structure is presented in Figure 6.
(Color online) Comparison of the Rietveld refined (red) and VASP-optimized (blue) structures of bumetanide.

(Color online) The asymmetric unit of bumetanide, with the atom numbering. The atoms are represented by 50% probability spheroids.

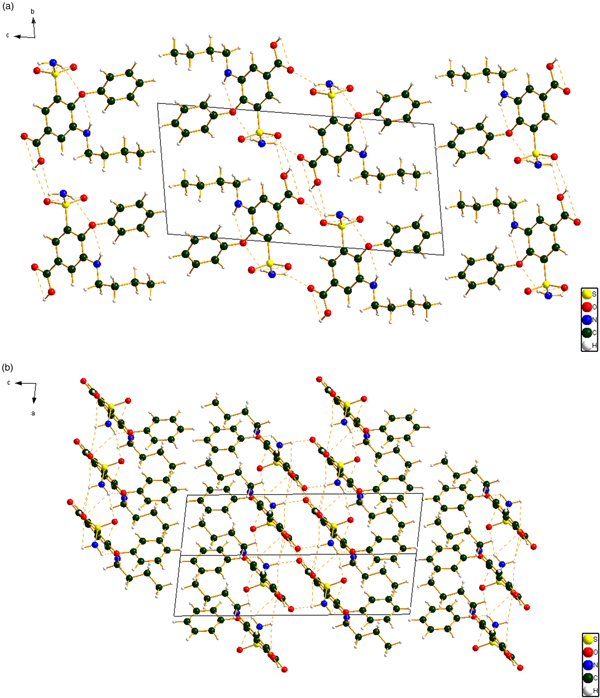
(Color online) (a) The crystal structure of bumetanide, viewed down the a-axis. (b) The crystal structure of bumetanide, viewed down the b-axis.

Almost all of the bond distances, and all the bond angles and torsion angles fall within the normal ranges indicated by a Mercury Mogul Geometry check (Macrae et al., Reference Macrae, Bruno, Chisholm, Edington, McCabe, Pidcock, Rodriguez-Monge, Taylor, van de Streek and Wood2008). The O2–S1 and O3–S1 bond distances [1.491 and 1.498 Å; Mogul average = 1.434(19) Å; Z-scores 3.0 and 3.3] are flagged as unusual. The Mogul average S=O distance is artificially shortened because of the high electron density in the double bonds. The N4–S1 distance [1.671 Å; average = 1.600(21) Å; Z-score 3.5] is also flagged as unusual. This nitrogen participates in several hydrogen bonds, perhaps resulting in the longer S–N bond.
Quantum chemical geometry optimizations (DFT/B3LYP/6-31G*/water) using Spartan ‘16 (Wavefunction, 2017) indicated that the observed conformation of bumetanide is 4.2 kcal mole−1 higher in energy than the local minimum energy conformation. The observed and the local minimum energy confirmations are very similar. Molecular mechanics conformational analysis indicated that the global minimum energy conformation (−6.4 kcal mol−1) differs in the orientation of the sulfonamide group, and thus that intermolecular interactions are important in determining the solid state conformation.
Analysis of the contributions to the total crystal energy using the Forcite module of Materials Studio (Dassault, 2017) suggests that angle and torsion distortion terms are significant in the intramolecular deformation energy. The intermolecular energy contains significant contributions from van der Waals attractions and electrostatic attractions, which in this force-field-based analysis include hydrogen bonds. The hydrogen bonds are better analyzed using the results of the DFT calculation.
The crystal structure is layered with the double layers parallel to the ab plane. The exterior of the layer is composed of hydrocarbon portions of the molecule, both phenyl rings and butyl side chains. The central portion of the bilayer contains the hydrogen-bonding regions, both the carboxylic acid dimers and the hydrogen bonds involving the sulfonamide groups.
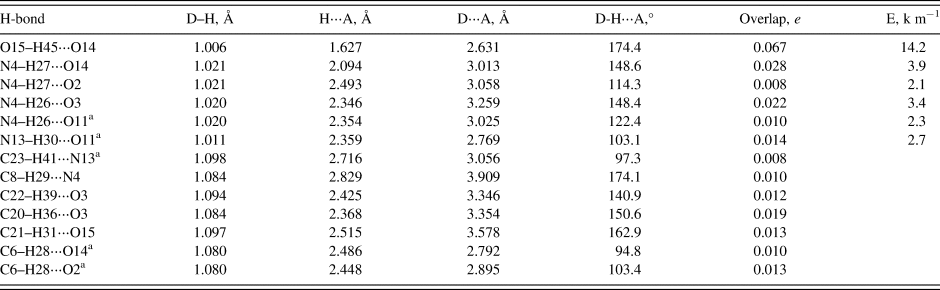
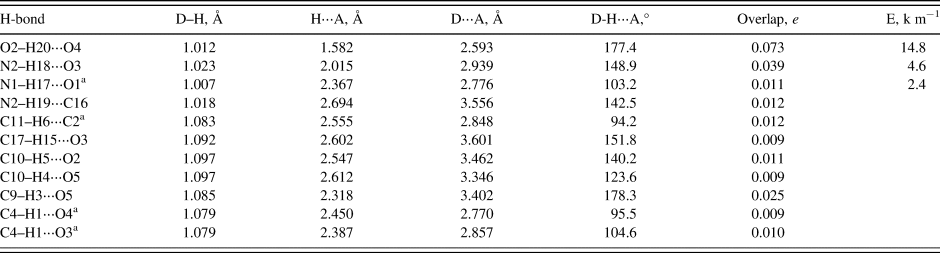
Hydrogen bonds are prominent in the crystal structure (Table I). As expected, the carboxylic acid forms a centrosymmetric cyclic dimer with a graph set R2,2(8) (Etter, Reference Etter1990; Bernstein et al., Reference Bernstein, Davis, Shimoni and Chang1995; Shields et al., Reference Shields, Raithby, Allen and Motherwell2000). Both hydrogens of the sulfonamide group form bifurcated hydrogen bonds. Each sulfonamide hydrogen acts as a proton donor to a sulfone oxygen in an adjacent molecule. The N4–H26⋅⋅⋅O3 hydrogen bond forms a pattern with graph set C1,1(4); the chain runs along the a-axis. H27 donates to the double bond oxygen, O14 (intermolecular). H26 participates in an intramolecular hydrogen bond to the ether oxygen, O11; this has a graph set S1,1(6). The amine hydrogen, H30, also participates in an intramolecular hydrogen bond with O11. Several C–H–O and C–H–N hydrogen bonds, both intra- and intermolecular, contribute to the crystal energy. The hydrogen bonds form a two-dimensional network parallel to the ab plane.
Hydrogen bonds (CRYSTAL14) in triclinic bumetanide.

a Intramolecular.
The molecular conformations of bumetanide in the current triclinic structure and the previously-determined monoclinic polymorph (FEDGON; Allu et al., Reference Allu, Bolla, Tothadi and Nangia2017) are very similar (Figure 7). The RMS Cartesian displacement of the non-H atoms is 0.262 Å, and the maximum difference is 0.581 Å, at N4. FEDGON is more stable by 1.9 kcal mole−1 (CRYSTAL14) or 0.3 kcal mole−1 (VASP), so the two polymorphs are very close in energy. Both structures have a centrosymmetric carboxylic acid dimer. The sulfonamide of the current structure participates in more hydrogen bonds than FEDGON (Table II). There are differences in the number of C–H⋅⋅⋅O and C–H⋅⋅⋅N hydrogen bonds between the two structures, but the differences are difficult to assess quantitatively.
(Color online) Comparison of the molecular structures of bumetanide in the current triclinic polymorph (red) and the previously-determined monoclinic polymorph FEDGON (green).

Hydrogen bonds (CRYSTAL14) in monoclinic bumetanide (FEDGON).

a Intramolecular.
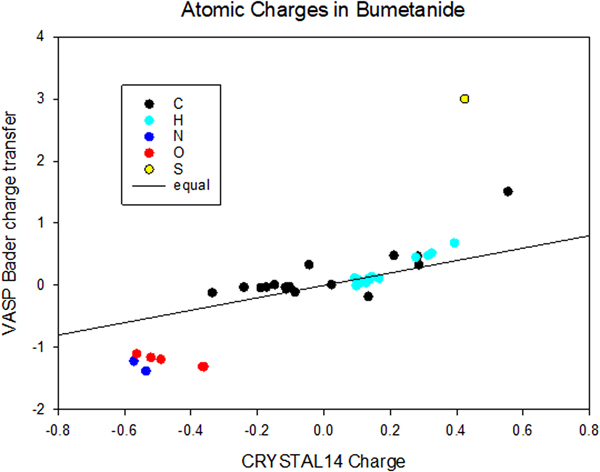
The two DFT calculations we performed yielded two measures of the atomic charges: the “default” atomic charges from CRYSTAL14 and the Bader analysis (charge transfer) from VASP (Figure 8). In general, the Bader analysis yields larger absolute values for the atomic charges. For the C and H atoms, the charges agree well with the exception of the carboxylic acid carbon C25. The Bader analysis yields more negative O and N, and a much more positive S. The VASP density of states plot indicates that the highest occupied states are dominated by p-orbital contributions from N13.
(Color online) Comparison of the atomic charges from CRYSTAL14 and VASP (Bader change transfer).

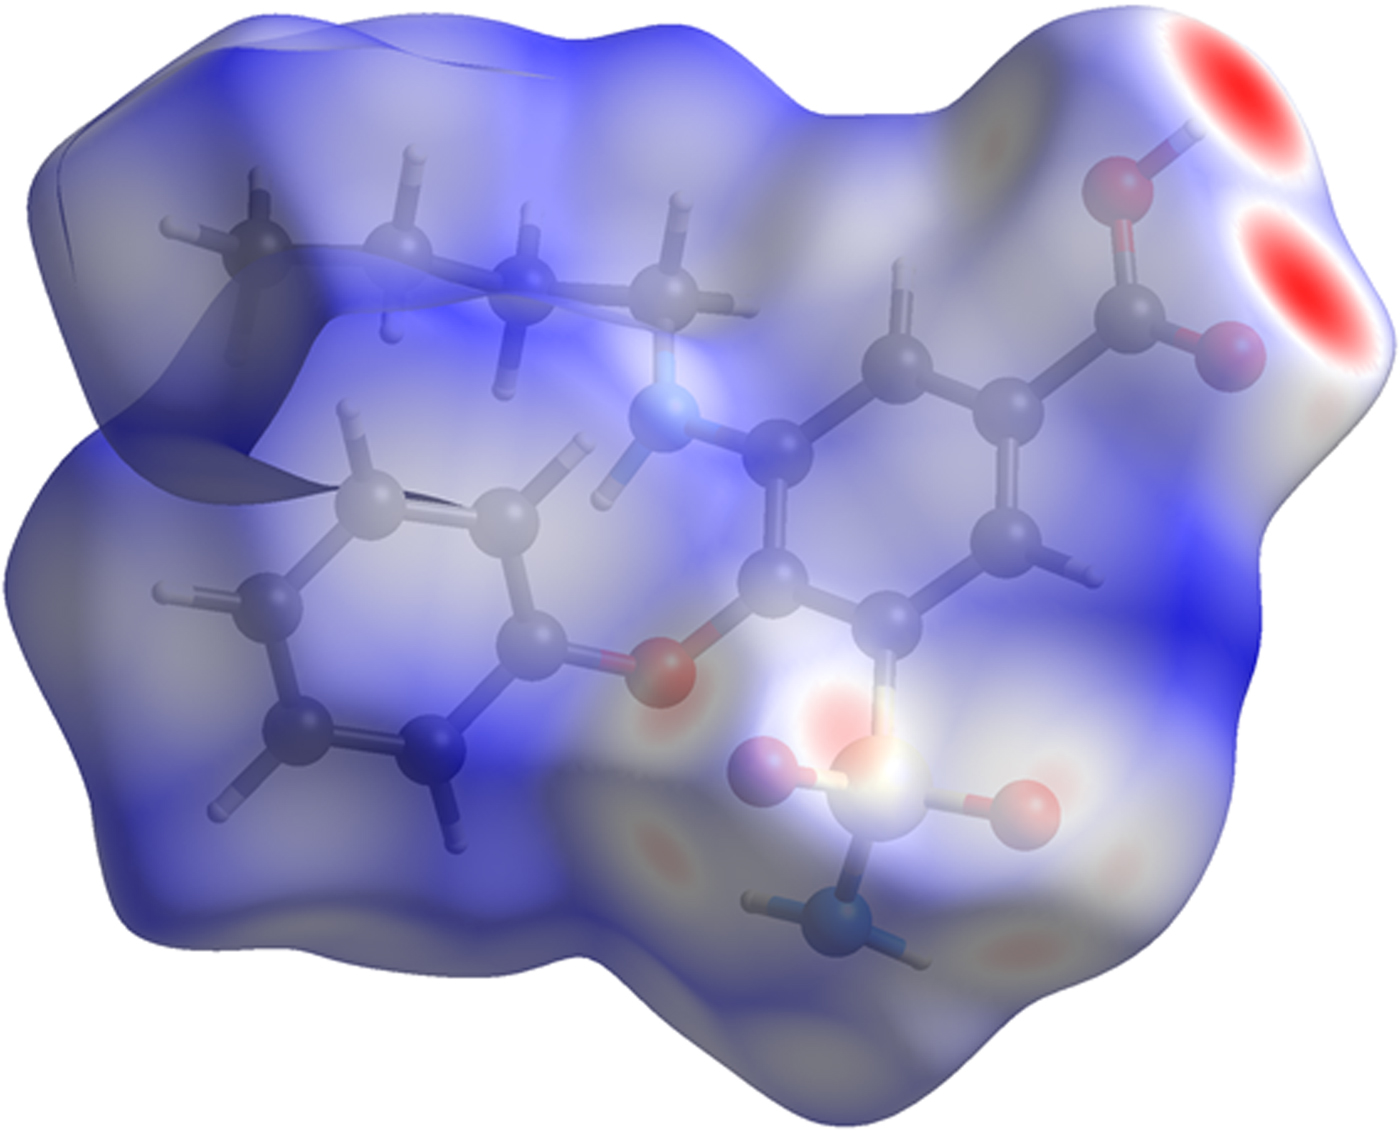
The volume enclosed by the Hirshfeld surface (Figure 9; Hirshfeld, Reference Hirshfeld1977; Turner, et al., Reference Turner, McKinnon, Wolff, Grimwood, Spackman, Jayatilaka and Spackman2017) is 435.37 Å3, 98.36% of 1/2 the unit-cell volume. The molecules are thus not tightly packed. All of the significant close contacts (red in Figure 9) involve the hydrogen bonds.
(Color online) The Hirshfeld surface of bumetanide. Intermolecular contacts longer than the sums of the van der Waals radii are colored blue, and contacts shorter than the sums of the radii are colored red. Contacts equal to the sums of radii are white.

The Bravais–Friedel–Donnay–Harker (Bravais, Reference Bravais1866; Friedel, Reference Friedel1907; Donnay and Harker, Reference Donnay and Harker1937) morphology suggests that we might expect platy morphology for bumetanide, with {001} as the principal faces. A fourth-order spherical harmonic preferred orientation model was included in the refinement; the texture index was 1.041, indicating that preferred orientation was present in this rotated capillary specimen. A {001} pole figure indicates a slight tendency for this direction to lie along to the capillary axis, consistent with the expected morphology. The powder pattern of bumetanide from this synchrotron data set is included in the Powder Diffraction File™ as entry 00-066-1609.
SUPPLEMENTARY MATERIAL
The supplementary material for this article can be found at https://doi.org/10.1017/S0885715619000125.