INTRODUCTION
The exact timing of reproduction is a critical process, which also determines the reproductive success of individuals (McNamara et al. Reference MCNAMARA, BARTA, KLAASSEN and BAUER2011). In birds, breeding in extratropical zones is restricted to the spring and early summer, and the main proximate factor that controls the exact timing is the change in day length (Slater & Mann Reference SLATER and MANN2004, Wikelski et al. Reference WIKELSKI, HAU and WINGFIELD2000). The seasonality of avian reproduction is generally less clearly defined in the tropics (Ricklefs Reference RICKLEFS1969). Close to the equator, there is little seasonal change in temperature and day length (Dawson et al. Reference DAWSON, KING, BENTLEY and BALL2001, Moore et al. Reference MOORE, BONIER and WINGFIELD2005) but most tropical regions show marked seasonality in precipitation (Peres Reference PERES1994, but see Tallman & Tallman Reference TALLMAN and TALLMAN1997). Rainfall variability is considered a key factor in determining overall primary productivity (Ahumada Reference AHUMADA2001, Schloss et al. Reference SCHLOSS, KICKLIGHTER, KADUK and WITTENBERG1999), the phenology and fruit production of plants (van Schaik et al. Reference VAN SCHAIK, TEBORGH and WRIGHT1993) and the abundance and activity of insects (Osborne Reference OSBORNE2000), all of which have great influence on food availability to birds (Blake & Loiselle Reference BLAKE and LOISELLE1991, Poulin et al. Reference POULIN, LEFEBVRE and MCNEIL1992, Wolda Reference WOLDA1980).
The few available multi-species studies on indirect indicators of breeding, such as the presence of brood patches or moulting, have shown that the response of tropical bird communities to the variation in rainfall and food availability can be very complex and variable among geographic regions, biomes and functional groups of birds (Cox et al. Reference COX, BRANDT, MCGREGOR, OTTOSSON, STEVENS and CRESSWELL2013, Johnson et al. Reference JOHNSON, STOUFFER and BIERREGAARD2012, Serle Reference SERLE1981, Stouffer et al. Reference STOUFFER, JOHNSON and BIERREGAARD2013). Most of the bird species in the African savannas (Cox et al. Reference COX, BRANDT, MCGREGOR, OTTOSSON, STEVENS and CRESSWELL2013) and the central Amazonian and Panama rain forests (Brawn et al. Reference BRAWN, BENSON, STAGER, SLY and TARWATER2017, Hau et al. Reference HAU, PERFITO and MOORE2008, Johnson et al. Reference JOHNSON, STOUFFER and BIERREGAARD2012, Loiselle Reference LOISELLE1988) breed at any time of the year even though bird communities show distinct seasonal peaks in the number of species and individuals breeding (Williams & Middleton Reference WILLIAMS and MIDDLETON2008). However, data on the breeding activity of birds over the course of the year are still scarce from many tropical regions and biomes with variable rainfall patterns.
In the tropics, with relatively little seasonal environmental change, a high proportion of bird species is resident and a significant proportion of them defends territories year-round (Stutchbury & Morton Reference STUTCHBURY and MORTON2008). Under these conditions, it is generally expected that singing activity is relatively constant year-round and that song is also used outside of the breeding context for territory defence (Tobias et al. Reference TOBIAS, GAMARRA-TOLEDO, GARCIA-OLAECHEA, PULGARIN and SEDDON2011, Topp & Mennill Reference TOPP and MENNILL2008). However, recent studies on several Neotropical species have indicated that singing activity varies throughout the year – males sing infrequently outside of the breeding season and increase their singing activity dramatically during the breeding period (Chiver et al. Reference CHIVER, STUTCHBURY and MORTON2015, Hill et al. Reference HILL, AMIOT, LUDBROOK and JI2015, Koloff & Mennill Reference KOLOFF and MENNILL2013). Song, often performed by both sexes, also functions in stimulation of the social mate and helps in within-pair timing and the synchronization of nesting in the tropics (Chiver et al. Reference CHIVER, STUTCHBURY and MORTON2015, Kunkel Reference KUNKEL1974). There is an increasing evidence that to some extent singing activity also reflects breeding activity in tropical bird communities (Catchpole & Komdeur Reference CATCHPOLE and KOMDEUR1993, Chiver et al. Reference CHIVER, STUTCHBURY and MORTON2015, Hill et al. Reference HILL, AMIOT, LUDBROOK and JI2015, Moore et al. Reference MOORE, WINGFIELD and BRENOWITZ2004). However, there is a fundamental lack of studies examining community-level year-round vocal activity from tropical regions.
In this study, we attempted to fill this gap by examining seasonal variation in the vocal activity of a bird community in an Afrotropical lowland rain forest in the foothills of Mount Cameroon, using a newly developed automatic sound recording approach. Specifically, we address the following hypotheses: (1) The species richness of the vocalizing bird community and (2) the vocal activity of the bird community will vary seasonally in relation to seasonal changes in temperature and precipitation. (3) The temporal turnover in the composition of the vocalizing bird community will be highest during the transition periods between the dry and rainy season.
METHODS
Study site
The study was conducted in the interior of a primary lowland rain forest in the Mt Cameroon National Park. Mt Cameroon (4095 m asl) rises from the Atlantic coast in the Gulf of Guinea in the south-west region of Cameroon, and is part of an extensive volcanic chain extending from the coast to about 1000 km inland in a north-east direction (DeLancey & DeLancey Reference DELANCEY and DELANCEY2000). Soundscape recordings were taken at the foothills of the south-west slope of Mt Cameroon, about 3 km north-west of the seashore and Bakingili village (near Bamboo Camp site; 4°06ʹ46ʹʹ N, 9°04ʹ06ʹʹ E) at an altitude of 350 m asl. The pristine part of the lowland forest starts from about 300 m asl; forests below this altitude have been replaced by plantations and secondary growth. Lowland forest at the study site has a closed canopy (almost 100%) and sparse undergrowth. In total, 124 tree species (>10 cm dbh) were identified at 16 sampling plots (~2 ha area in total) at the study altitude. Maximum and mean tree heights were 48 and 16 m, respectively (Djomo Nana et al. Reference DJOMO NANA, SEDLÁČEK, DOLEŽAL, DANČÁK, ALTMAN, SVOBODA, MAJESKÝ and HOŘÁK2015).
Environmental variables
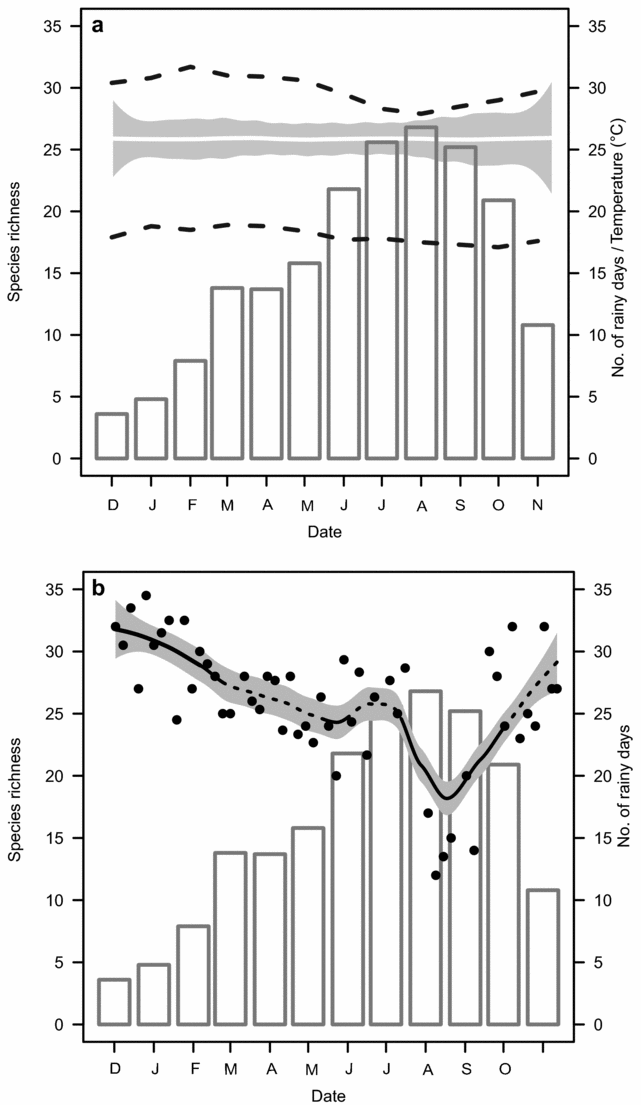
The mean annual precipitation at our study site is ~7000 mm (Gonfiantini et al. Reference GONFIANTINI, ROCHE, OLIVRY, FONTES and ZUPPI2001). For our analyses, we used meteorological data from the nearest Mokundange meteorological station (Fraser et al. Reference FRASER, HALL and HEALEY1998), which is located about 13 km south-east of our study site (4°1ʹ3.64ʹʹ N, 9°8ʹ24.71ʹʹ E, 50 m asl). The annual precipitation is lower there (mean 5000 mm) compared with our site, but the relative distribution of precipitation over the course of the year is very similar (Cable & Cheek Reference CABLE and CHEEK1998, see Fraser et al. Reference FRASER, HALL and HEALEY1998 for details). The data for temperature are from 1971–1975 and 1984–1993, and data for precipitation are from 1970–1993. We calculated monthly averages from these periods for minimum and maximum temperature and amount of rainfall and number of rainy days. To our knowledge, no other detailed and/or more recent long-term meteorological data for the Mt Cameroon region are available. We collected temperature and precipitation data at the study site for 1 y (2013 for temperature and 2015 for precipitation), which, however, do not correspond to the year of our acoustic recording. We show in Appendix 1 that the environmental data from a single recent year show almost identical patterns to the long-term data, which we used for the analyses. The rains in this region occur year-round, but dry season can be defined as the period between November and April. The winds blowing southward from the Sahara have the strongest influence on climate during this period. The dry season is broken by south-western winds in late April or May causing a steep increase of rainfall. By June or July, the rain falls almost continuously but is less intense. The peak of rainy season is in August with quite continuous decrease during September and October (Fraser et al. Reference FRASER, HALL and HEALEY1998 and Figure 1).
The expected seasonal patterns of species richness under the null model (white line – mean, shaded areas – 95 % confidence interval). Bars depict monthly number of rainy days; dashed lines represent mean minimum and maximum temperatures in Mt Cameroon area (a), Seasonal trend in the real species richness (the number of bird species detected per day) between 2 December 2011 and 12 November 2012 in the lowland rain forest of Mt Cameroon. Dots represent means from available recording devices, lines are trends in the data fitted by locally weighted regression (LOESS) function, with shaded areas representing standard error estimates (b). The significant deviation from the null model is indicated by solid line. Bars depict monthly number of rainy days.

Acoustic sampling
We sampled the vocal activity of the bird community from 2 December 2011 until 12 November 2012. We used Song Meters (SM2, Wildlife Acoustics, Inc., Concord, MA, USA) for soundscape acoustic sampling with automatic recording devices and two omnidirectional microphones supplied with SM2 (SMX-II Weatherproof Acoustic Microphone; for detailed description of Song Meter recording devices see Sueur et al. Reference SUEUR, GASC, GRANDCOLAS, PAVOINE, Le Galliard, Guarini and Gaill2012). The devices were mounted on a tree stem in the forest interior at a height of ~180 cm and placed ~200 m apart to avoid overlapping acoustic sampling. The sampling frequency was 44.1 kHz, and 16 bit recordings were saved in WAV format on 32GB SDHC cards. The batteries and cards were changed after 5 mo. The devices were programmed to record every sixth day continuously for 3 h in the morning, starting 20 min before sunrise (the device automatically calculates the actual sunrise time according to the GPS position). This study design was chosen so as to cover the daytime with the highest vocal activity of birds while taking into account the battery lifetime. In total, we placed four devices at the sampling site. However, only one of them worked for the whole year. Even though the devices are advertised as being waterproof (including the microphones), three of the four recording devices stopped working during the wet period of the year due to extremely high rainfall and humidity at the study site. In total, we obtained recordings from 59 d, which corresponds to 129 device-days (387 h). We checked all samples by listening and omitted all recording days with rain. This resulted in 53 d and 116 device-days, which corresponds to 812 5-min samples in total used for further analyses (~68 h). The coverage of the year by individual devices is shown in Appendix 2.
Data analysis
To estimate the vocal activity of the bird community, we selected seven 5-min samples from each 3-h recording resulting in 35 min per sampled day in total. Altogether, we analysed 4060 min of data from four devices over the year. These samples were cut manually using GoldWave 5.67 software (GoldWave Inc., St. John's, NL Canada), using even spacing every 30 min throughout the length of the recording. We applied this subsampling to reduce the length of recordings to listen to, while keeping representative time frames for evaluating the bird vocal activity at the same time. Samples were checked by FNM, an experienced local expert, who listened to the original WAV files using a computer (played in GoldWave) and stereo headphones under standardized conditions. Each recording was played with a volume approximately simulating natural conditions. Each individual that was heard singing was noted to compile a list of species recorded during each 5-min acoustic sample. Our analysis is based on typical songs, calls or other vocalizations of all birds, including non-passerines. Our previous analyses have shown that listening to acoustic samples produces reliable data on species richness for an approximately 50-m radius around the recording device (Song Meter) in the tropical rain-forest (Sedláček et al. Reference SEDLÁČEK, VOKURKOVÁ, FERENC, NANA DJOMO, ALBRECHT and HOŘÁK2015).
First, we asked how many species vocalized per day. We quantified the number of bird species (hereafter species richness) recorded during all seven samples for a particular day and device (recorded during 35-min in total for each device), and this species richness was averaged across the available devices for a given recording day. We constructed a null model by randomizing the vocal activity of individual bird species within the year to quantify the expected species richness patterns if the species were vocally active irrespective of the season. Subsequently, we quantified the 95% confidence interval of species richness that would be observed under such a scenario (Figure 1a). Real species richness values that fall outside of this confidence interval were considered as significant deviations from the null model. Second, we estimated the overall vocal activity of the bird community (hereafter mean vocal activity of species) in particular days. We quantified this parameter as the average number of 5-min intervals in which particular species vocalized (i.e. the number of presences in seven 5-min samples averaged across species for a particular day) with subsequent averaging across available devices. This measure reaches its highest values in cases where many species are vocalizing during all seven 5-min intervals during a particular morning. Further, we estimated the daily variance (computed as statistical variance) in the number of species detected across the seven 5-min samples to quantify the variability of vocal activity (hereafter variance in richness of vocalizing community) within a given day. We averaged this variance across available devices. This measure quantifies if the vocal activity of a bird community is constant or varies among samples during the morning. We plotted these variables against the recording Julian date and utilized the locally weighted regression (LOESS) function. To explore the dependence of species richness of the vocalizing bird community on climatic variables, we calculated the average number of bird species recorded by the devices in each month (as only monthly climatic data were available). Monthly species richness was thereafter regressed on minimum and maximum monthly temperature (averaged across the years 1971–1975 and 1984–1993), amount of rainfall and the number of rainy days in each month (averaged across the years 1970–1993).
Changes in composition of the vocally active avian community throughout the year were quantified by two beta-diversity indices βSIM (species replacement) and βNES (nestedness) introduced by Baselga (Reference BASELGA2010). These indices reflect two different phenomena, which can produce differences in species composition between two sample units. The first phenomenon is the actual replacement of some species by others. The second phenomenon is nestedness, purely reflecting differences in species richness in the compared samples. In the analysis of temporal beta-diversity, we used only data from the single recording device that operated year-round. We calculated beta-diversity indices by comparing consecutive recording days. The LOESS function was utilized to visualize these temporal trends. All analyses were conducted in R software 3.5.4.
RESULTS
Seasonal variation in species richness and vocal activity
In total, we detected 102 bird species during 53 recording days (all detected species and their frequency of occurrence listed in Appendix 3). The mean number of species detected per day varied between 14.5 species (in August) and 31.5 species (in December). The species richness showed a clear trend with the highest species richness at the beginning of the dry season between December–January (higher than null model expectations, Figure 1a, b), followed by gradual decrease with increasing rainfall towards June (lower than null model expectations, Figure 1a, b). A slight increase of species richness by June/July just before the beginning of the heaviest rains was followed by a steep decline during July, and low species richness during the peak of the rainy season in August–September (lower than null model expectations, Figure 1a, b). Species richness of vocalizing birds then steeply increased with the rainfall decline during October–November (Figure 1b).
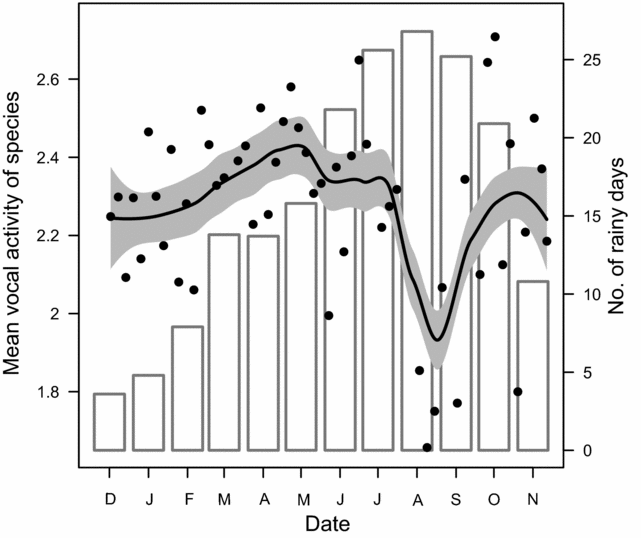
The mean vocal activity of species had a similar trend but rather increased towards the end of dry season (from December to the end of April), then again steeply declined during the peak of the rains (July–August), and increased with decreasing rainfall by the end of September and in October (Figure 2). The mean number of species detected per 5-min sample within a day varied between 3.7 species (August) and 10.1 species (December), and also corresponded to the rainfall patterns throughout the year.
Mean vocal activity of species (average number of 5-min intervals in which each species was detected) between 2 December 2011 and 12 November 2012 in the lowland rainforest of Mt Cameroon. Dots represent means from available recording devices, solid lines are trends in the data fitted by locally weighted regression (LOESS) function, with shaded areas representing standard error estimates. Bars depict monthly number of rainy days.

Variance in richness of vocalizing community
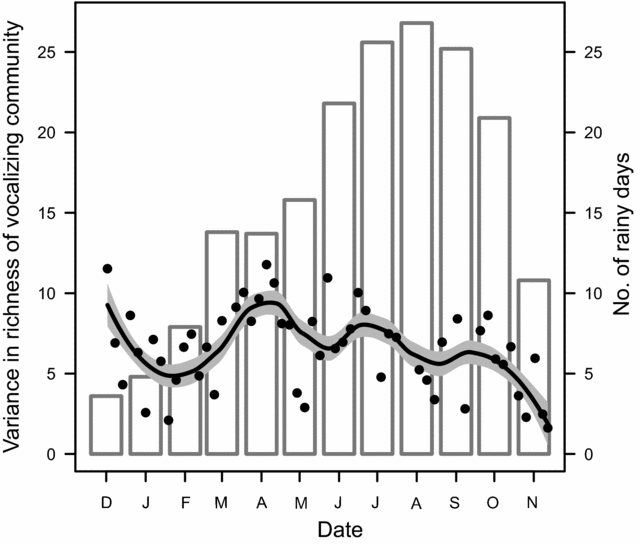
The statistical variance in the number of vocalizing species detected in the seven 5-min samples on particular days (averaged for recording units) was highest between late March and June (the transition period between the dry and rainy seasons) and then gradually decreased towards November–December (beginning of the dry season) (Figure 3). This result together with Figure 2 indicates that the bird community vocal activity throughout the morning is relatively stable and high during the dry season, highly variable during the transition period between the dry and rainy seasons (within a day, 5-min samples with both relatively low and high activity were detected) and stable and low during the peak of rains.
Seasonal trend of the variance in richness of vocalizing community (variance in the number of species vocalizing per 5-min samples within a particular day). Dots represent means of variance across available recording devices. Solid line shows the trend in the data fitted by locally weighted regression (LOESS) function with the shaded area representing standard error estimate.

The influence of environmental seasonality on species richness
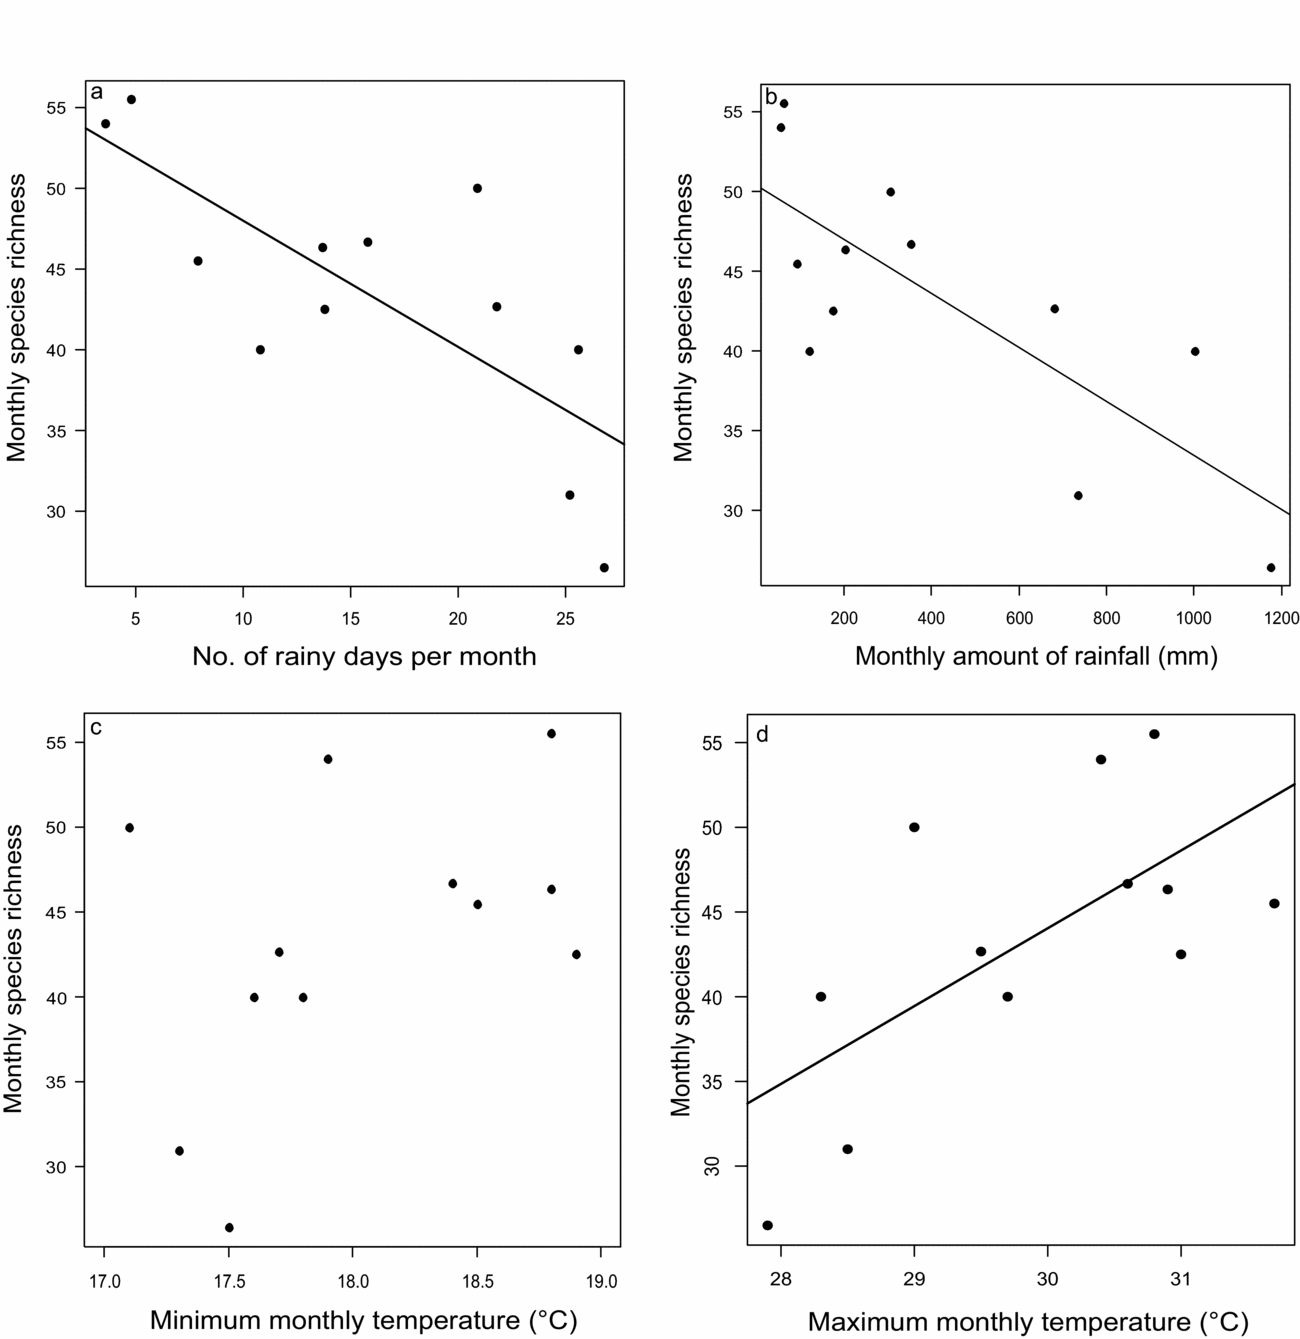
The species richness of the vocalizing bird community was related to seasonal changes in temperature and rainfall (these environmental variables are strongly negatively correlated, Appendix 4). We found that the species richness of birds detected vocalizing during individual months was negatively related to the number of rainy days per month (R2 = 0.57, n = 12, P < 0.01; Figure 4a) as well as to the monthly amount of rainfall (R2 = 0.60, n = 12, P < 0.01; Figure 4b), and positively related to the monthly mean maximum temperature (R2 = 0.44, n = 12, P < 0.05; Figure 4d). The relationship was positive but not significant for monthly mean minimum temperature (R2 = 0.20, n = 12, P = 0.15; Figure 4c). The species richness of birds vocalizing during the dry season (months with less than 5 rainy days and higher temperature) was more than twice as high as during the peak of the rainy season (months with more than 25 rainy days and lower temperature) (Figure 4a, b).
Relationships between the monthly species richness of birds vocalizing in particular months, and the number of rainy days per month (R2 = 0.57, n = 12, P < 0.01) (a), monthly amount of rainfall (R2 = 0.60, n = 12, P < 0.01) (b), mean monthly minimum temperature (R2 = 0.20, n = 12, P = 0.15) (c) and mean monthly maximum temperature (R2 = 0.44, n = 12, P < 0.05) (d) in the lowland rain forest of Mt Cameroon. Dots represent means from available recording devices. The depicted trend was fitted by the ordinary least squares method.

Seasonal changes in the composition of the vocalizing bird community
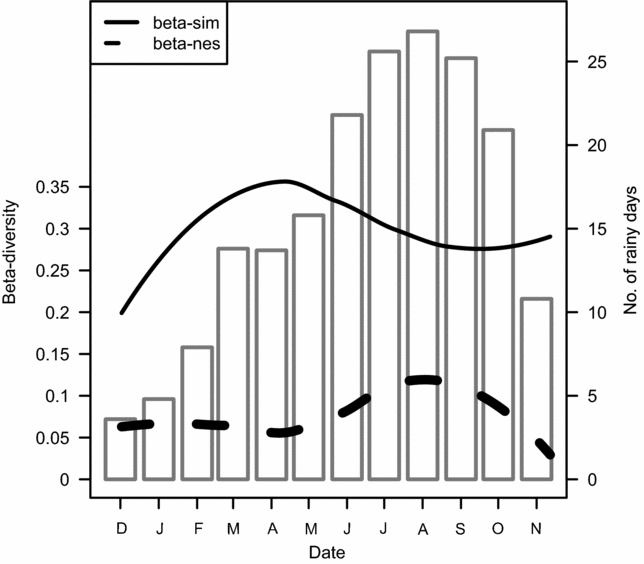
The composition of the vocalizing bird community changed throughout the year. Temporal species turnover (beta sim βSIM , Figure 5) of the singing bird community was highest during the transition period between the dry and rainy seasons between March and June (with a peak in April–May), and relatively low during heavy rains (July–August) and the dry season (December–January). On the other hand, the nestedness component of beta diversity (βNES , Figure 5) attributable to temporal changes in species richness showed the opposite pattern. The vocalizing bird community was more nested during the peak of rains (July–September) than during the transition period between the dry and rainy seasons (March–June).
Temporal change in the composition of the vocalizing bird community throughout the year quantified by βSIM values (temporal species turnover) and βNES values (nestedness). Data are from the single recording device that operated year-round in the lowland rain forest of Mt Cameroon.

DISCUSSION
To our knowledge, although based on relatively limited sample size, this is the first study to quantify seasonal patterns in the vocal activity of birds in the tropics at the community level. We show that birds in this lowland rain forest vocalized year-round, but that the number of singing species varied greatly throughout the year and this variation coincided mainly with seasonality of the rainfall. The species composition of the vocalizing community changed mainly during the transition period between the dry and rainy seasons, and was relatively stable during both heavy rains and the driest months. In the periods of the highest community change there was also the highest variation (i.e. variance in richness of vocalizing community), meaning that there were short intervals of very high and also low vocal activity within a single day.
We show that the singing performance of the bird community at our study site varied greatly depending on the season. The two measures of singing performance show similar patterns – during periods of high species richness, the overall vocal activity of birds (mean vocal activity of species) was also high. Our analyses also show that the amount of rainfall was the most important factor negatively influencing the vocal activity of rain-forest birds. It is important to highlight here that we omitted acoustic samples taken during rain from our analyses and related the species richness to the rainfall in particular months. This means that the singing behaviour of birds was therefore reduced not only during particular rain events, but more interestingly also during the wet season in general. We propose that the main mechanism explaining these findings is not the rainfall per se, but rather its effect on the availability of organisms (plants, insect, vertebrates) that are part of the feeding source of the birds. Strong rainfall and decreased temperature during the peak of rains significantly reduce the availability of invertebrate prey for birds. The invertebrate prey in the foliage and especially aerial forms of insects are less active and therefore hidden for birds during periods of heavy rains (Foster Reference FOSTER1974, Pearson Reference PEARSON1977, Senapathi et al. Reference SENAPATHI, NICOLL, TEPLITSKY, JONES and NORRIS2011). Further, despite that fact that we do not have information on the phenology of plants and trees for our study region, it is possible that the availability of flowers and fruits is reduced during the peak of rains (Anderson et al. Reference ANDERSON, NODHEIM, MOERMOND, GONÉ BI and BOESCH2005, van Schaik et al. Reference VAN SCHAIK, TEBORGH and WRIGHT1993). Singing, as a possible signal of territory quality (Manica et al. Reference MANICA, MAIA, DIASA, PODOS and MACEDO2014), may be therefore omitted or highly reduced during periods of food shortage, as birds focus mostly on foraging during relatively limited periods of time. Alternatively, another possible explanation of higher species richness during the dry season might also be enrichment of the lowland bird community by montane altitudinal migrants (Werema et al. Reference WEREMA, HOWELL and NDANGALASI2016). However, we did not detect any montane species singing in our recordings, even though altitudinal migrations of montane birds to lowland have been described from Mt Cameroon (Stuart Reference STUART1986).
Information on the connection of singing performance to breeding activity is still missing for the vast majority of species in the tropics. However, recent studies have proposed that males of tropical birds sing infrequently outside of the breeding season and increase their singing activity dramatically during the breeding period (Chiver et al. Reference CHIVER, STUTCHBURY and MORTON2015, Hill et al. Reference HILL, AMIOT, LUDBROOK and JI2015, Koloff & Mennill Reference KOLOFF and MENNILL2013). Data on the breeding activity of many bird species from our region, especially from the rainy season, are still scarce (Serle Reference SERLE1981, Tye Reference TYE1992); however, we suggest that under the extremely high rainfall on Mt Cameroon many birds can avoid breeding during the peak of rains (Fraser et al. Reference FRASER, HALL and HEALEY1998). Males can reduce their vocal performance to save energy during periods of high metabolic demands and worsened conditions for acoustic signal transmission due to abiotic noise (Lengagne & Slater Reference LENGAGNE and SLATER2002, Mathevon et al. Reference MATHEVON, AUBIN, VIELLIARD, DA SILVA, SEBE and BOSCOLO2008). We also found that the birds responded very quickly to the drop in rainfall at the end of the wet season, as the mean vocal activity of species and also the number of species singing rapidly increased and was highest during the start of the driest period of the year on Mt Cameroon, which suggests that this is the period when most species breed (Serle Reference SERLE1981). It is also possible that birds respond to subtle changes in day length; alternatively, hormonal and physiological states of birds that are vocalizing might be affected by sunlight (Goymann et al. Reference GOYMANN, HELM, JENSEN, SCHWABL and MOORE2012). However, the proximate and ultimate mechanisms affecting bird singing behaviour in the tropics needs further investigation.
Nevertheless, our analyses on the species composition of the vocalizing bird community throughout the year imply that not all bird species have their peak of vocal activity during the driest months. We found that temporal species turnover (beta diversity) of the bird community increased with upcoming light rains and peaked during the transition period between the dry and rainy seasons (April–May). Moreover, the daily variance in the number of species vocalizing increased with forthcoming rainfall. This means that variable weather conditions and the first heavy rains in particular influenced the vocal behaviour of birds during this period. These results suggest that species with peaks of singing during the drier season decrease their vocal activity with increasing amounts of precipitation, whereas other species assemblages that prefer more humid periods of the year for breeding increase their vocal activity with upcoming rains. This leads to high species turnover during transitional periods of environmental conditions, suggesting that factors such as food composition and/or its availability can change dramatically (Hau Reference HAU2001). The nestedness component contributed to beta diversity mainly during the rainy season, when the species richness of vocally active birds decreased.
Our results therefore support a view that bird reproduction may be more seasonal in Afrotropical rain forests than was previously thought, and different species might prefer different times of the year for breeding (Moreau Reference MOREAU1950, Serle Reference SERLE1981). As has been previously shown, the timing of singing and breeding activities of particular feeding guilds may follow seasonal peaks in their diets (Greenberg Reference GREENBERG1995, Karr Reference KARR1976, Mulwa et al. Reference MULWA, NEUSCHULZ, BOHNING-GAESE and SCHLEUNING2013). However, this issue needs further investigation and should be a main focus of future studies. Our study also shows that the use of automatic recordings is an effective tool for investigation of seasonal changes in singing activity of birds at the community level, especially in remote and hard-to-access tropical areas.
ACKNOWLEDGEMENTS
We wish to thank the local communities of the Bokwango and Bakingili villages for their kind support, and especially to Francis Escobar Luma, Nathaniel and Collins for their guarding during our fieldwork. We thank Eric Djomo Nana and Štěpán Janeček for help in the field. We thank the Mt Cameroon National Park and the Department of Environmental Sciences of the University of Buea, Cameroon and in particular Eric Fokam, Philip Tem Dia and Bertilla Sirri for their kind assistance. We also thank Kevin Njabo and the Congo Basin Institute in Yaoundé for their technical support. David Hardekopf improved the English of the paper. This study was performed with the authorization number: 0053/PRBS/MINFOF/SG/DFAP/SDVEF/SC of the Ministry of Forestry and Wildlife of the Republic of Cameroon. The study was funded by the Grant Agency of Charles University (project no. GA UK 1282214) and the Czech Science Foundation (project no. 14–36098G).
Conflict of Interest
The authors declare that they have no conflict of interest.
APPENDICES
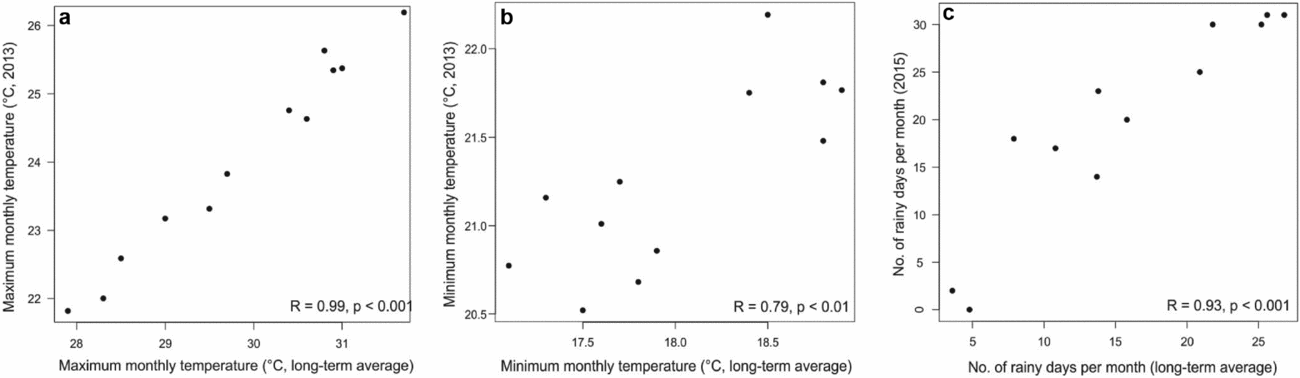
The correlations of the environmental data from rain gauges and dataloggers obtained in the lowland rain forest (350 m asl) at the foothills of the south-west slope of Mt Cameroon during a single recent year (2015 and 2013, respectively) and of the long-term environmental data from the nearest Mokundange meteorological station (Fraser et al. Reference FRASER, HALL and HEALEY1998). The monthly average data are from 1971–1975 and 1984–1993 for maximum (a) and minimum (b) temperature, and from 1970–1993 for the number of rainy days per month (c).

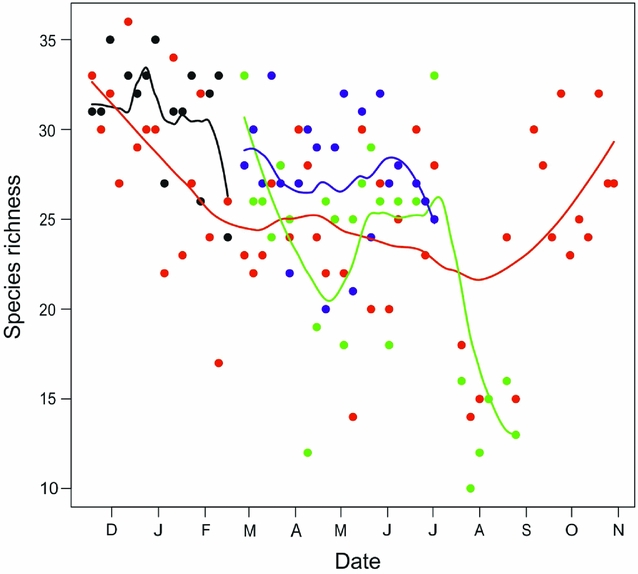
The coverage of the year by recordings from four individual devices (different colours) in the lowland rain forest (350 m asl) at the foothills of the south-west slope of Mt Cameroon. The dots show the number of species recorded per day by individual devices. The solid line shows the trend in the data fitted by locally weighted regression (LOESS) function. Days with rainfall are omitted from the analyses.

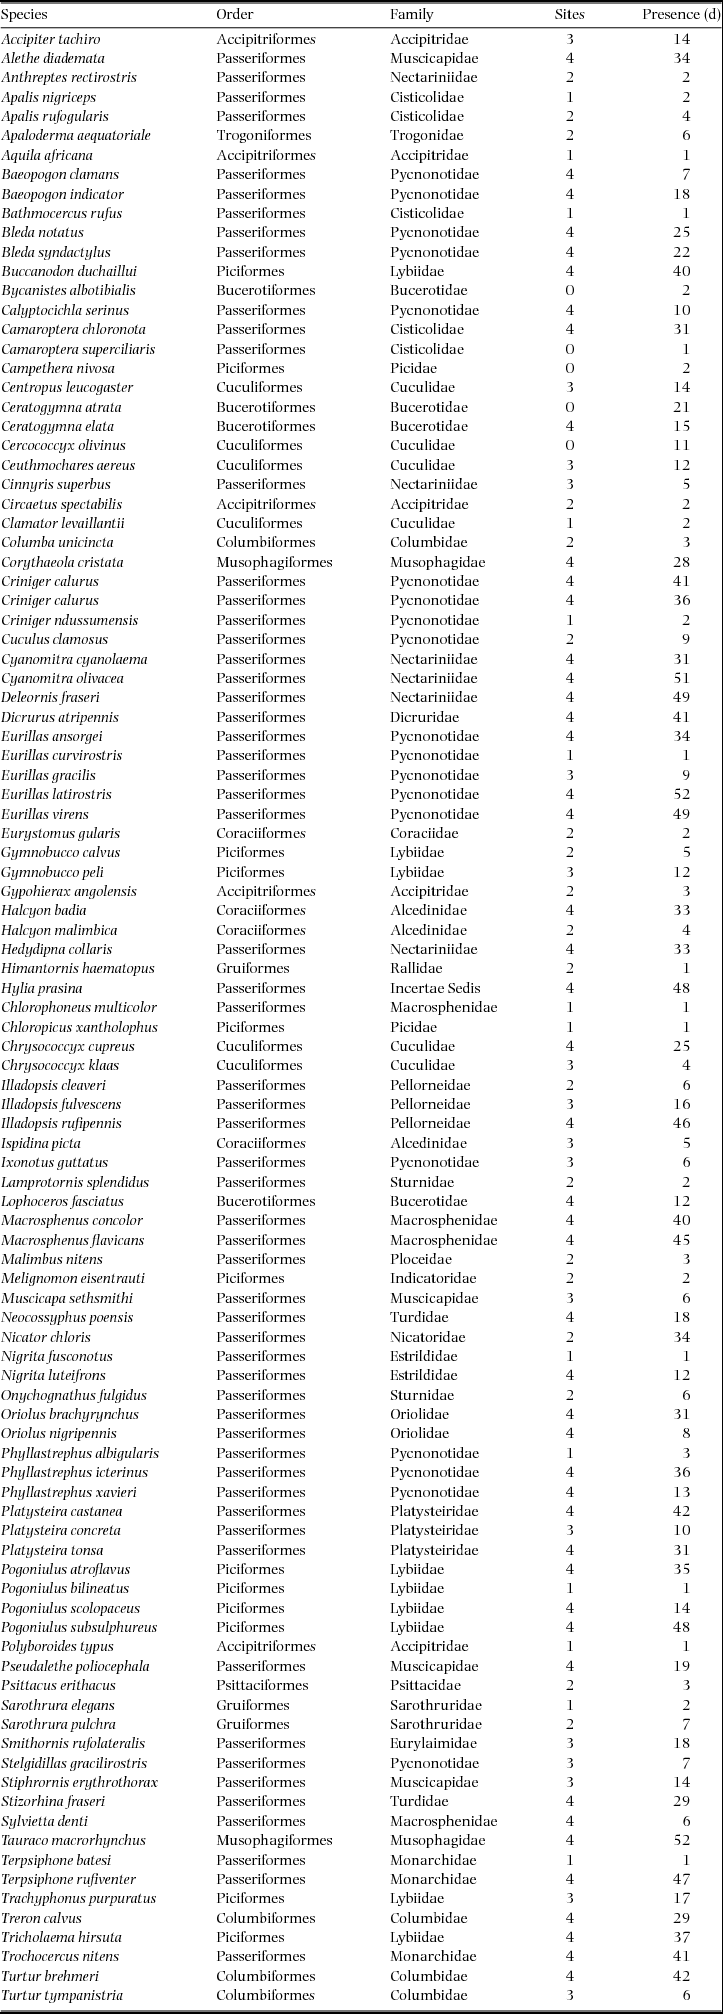
List of all detected bird species from recordings included into analyses of the vocal activity from 2 December 2011 until 12 November 2012 in the lowland rain forest (350 m asl) at the foothills of the south-west slope of Mt Cameroon. Sites – number of sites, where a species has been detected (min 1, max 4); Presence – number of days, when a species has been detected (min 1, max 53). The taxonomy follows Gill & Donsker (Reference GILL and DONSKER2017).

Pearson's product-moment correlation coefficient (r) for environmental variables (number of rainy days per month, monthly rainfall, maximum and minimum monthly temperature) from long-term data (Fraser et al. Reference FRASER, HALL and HEALEY1998) included into analyses of the species richness of the vocalizing bird community from 2 December 2011 until 12 November 2012 in the lowland rain forest (350 m asl) at the foothills of the south-west slope of Mt Cameroon.