Ever since a large consensus was reached on the benefits of second language (L2) instruction in the field of instructed SLA (Doughty, Reference Doughty1991; Long, Reference Long, De Bot, Ginsberg and Kramsch1991; Norris & Ortega, Reference Norris and Ortega2000), much effort has been devoted to addressing the relative effectiveness of various pedagogical interventions. In the same vein, a growing body of visual input enhancement (VIE; also known as written or textual enhancement) studies has tapped the possibility of making input more perceptible to L2 learners by employing enhancement techniques with typographical cues (e.g., underlining, boldfacing, italicization, CAPITALIZATION, or other strategies such as color coding or using different font sizes or types). In this way, enhancement-embedded texts are used to make a target form perceptually salient to the extent that processing that form is facilitated. Schmidt's (Reference Schmidt and Robinson2001) noticing hypothesis offers rationales for such claims: For input to be processed for acquisition by L2 learners, it must first be noticed. Enhancing input using typographical techniques increases the chance that the visually prominent input will be noticed and will thus establish a trace in long-term memory.
Among studies investigating VIE, some have treated it as the main independent variable of interest (e.g., Jourdenais, Reference Jourdenais1998; Leow, Reference Leow2001) and some have used it as one of several techniques for focus on form (e.g., Doughty, Reference Doughty1991; Robinson, Reference Robinson1997). Others have included an examination of additional moderating variables, such as explicit directions to focus on form (Shook, Reference Shook1994, Reference Shook1999), explicit rule instruction prior to exposure to the enhanced input (Alanen, Reference Alanen and Schmidt1995; Kubota, Reference Kubota2000), communicative tasks (Leeman, Arteagoitia, Fridman, & Doughty, Reference Leeman, Arteagoitia, Fridman, Doughty and Schmidt1995), text length (Leow, Reference Leow1997), extensive reading and listening (White, Reference White, Doughty and Williams1998), output activities (Izumi, Reference Izumi2002), relative communicative value of form (Overstreet, Reference Overstreet2002), relative saliency of form (Leow, Egi, Nuevo, & Tsai, Reference Leow, Egi, Nuevo and Tsai2003), simplified modification (Wong, Reference Wong2003), opportunity of online chatting (Ha, Reference Ha2005), and topic familiarity (Lee, Reference Lee2007; Overstreet, Reference Overstreet1998).
To date, accumulated findings and conclusions drawn by individual researchers are elusive. All previous studies, with the single exception of Jourdenais's (Reference Jourdenais1998) doctoral research, utilized comparison groups rather than true control groups: By and large, VIE has been compared to the more implicit technique of input flood, or the provision of as many instances of the targeted L2 form in the input as possible. Some of the studies found comparatively positive effects of VIE over input flood on learning of grammatical items (e.g., Lee, Reference Lee2007; White, Reference White, Doughty and Williams1998), whereas others failed to find such helpful effects (e.g., Izumi, Reference Izumi2002, Reference Izumi2003; Jourdenais). Explicit grammar instruction, to which VIE has also frequently been compared, has typically been reported to have superior effects to implicit VIE instruction (e.g., Alanen, Reference Alanen and Schmidt1995; Doughty, Reference Doughty1991). Some researchers have also shown disagreement on the effects of VIE on learners' noticing. Based on two empirical studies, Izumi (Reference Izumi2002, Reference Izumi2003) maintained that VIE was beneficial for promoting learners' noticing, even though he did not find any benefit of such noticing in terms of actual learning gains. Conversely, two other studies (Leow, Reference Leow2001; Leow et al., Reference Leow, Egi, Nuevo and Tsai2003) concluded that VIE does not aid learners' enhanced degree of noticing.
Existing primary studies have shown a large divergence in terms of their study features. For example, some researchers have studied the effects of VIE not only on acquisition but also on comprehension (Doughty, Reference Doughty1991; Jourdenais, Reference Jourdenais1998; Lee, Reference Lee2007; Leow, Reference Leow1997, Reference Leow2001; Leow et al., Reference Leow, Egi, Nuevo and Tsai2003; Overstreet, Reference Overstreet1998, Reference Overstreet2002; Wong, Reference Wong2003). Although most of these studies did not report statistically significant hampering effects of VIE on comprehension, both Lee and Overstreet (Reference Overstreet1998) reported that VIE negatively affected learners' meaning comprehension. In the context of a psycholinguistic discussion about learner attention and the relation of form and meaning, Lee argued that learners' comprehension might be negatively affected by attention-drawing VIE techniques and proposed that a balanced amount of intervention to teach L2 forms during reading would be needed. Investigating the potential effects of VIE on learners' meaning processing is indeed a necessary part of the VIE research program in order to adequately understand the role of VIE in grammar pedagogy.
Considering the diverse study features and conflicting results from previous studies, we feel that the accumulating research in this domain warrants a comprehensive synthesis of study findings. By simply following the vote-counting manner of review (Light & Pillemer, Reference Light and Pillemer1984), one might tally and compare the number of studies demonstrating beneficial and nonbeneficial results to come to a conclusion about the effectiveness of VIE as a pedagogical choice for grammar instruction. Many research synthetists, however, caution that this traditional practice might obscure the impact of study features across individual primary studies and the impact of the magnitude of each study.
Employing the systematic procedures offered by the methodology of quantitative meta-analytic synthesis (Norris & Ortega, Reference Norris, Ortega, Norris and Ortega2006), the current meta-analysis brings together previous studies to examine VIE research and determine whether VIE has beneficial effects for grammar learning. By synthesizing the available empirical research in the field, this methodology not only enables us to examine the overall effectiveness of VIE but also allows us to investigate other important research questions not addressed in the primary research. For example, many meta-analysts admonish the prevailing publication practices that favor studies reporting statistically significant findings (Cooper, Reference Cooper1998; Rosenthal, Reference Rosenthal, Cooper and Hedges1994; see also Norris & Ortega, Reference Norris and Ortega2000, in particular, for a discussion on publication bias in the SLA field). Thus, it might be important to ask what the relative effects of VIE are, depending on the sources of publication as a moderating variable in this secondary research. Light and Pillemer (Reference Light and Pillemer1984) stressed that research synthesis allows us to “learn from existing findings, to discover what is known” (p. ix). A meta-analysis approach, then, attempts to shed new light on available data in primary studies via systematic interpretations. Four research questions guided the present study:
1. How has VIE been investigated in the SLA literature to date?
2. What is the magnitude of the impact of VIE on learners' grammar learning?
3. What is the magnitude of the impact of VIE on learners' meaning comprehension?
4. What is the relative magnitude of the impact of VIE in published versus unpublished studies? Is there a difference in relative magnitude observable between studies published in refereed journals and unpublished doctoral studies?
The first research question was addressed via a systematic synthesis of study features and the other three research questions were addressed through the lens of a quantitative meta-analysis.
METHOD
The Literature Search
An extensive and principled search of the literature was performed for the current meta-analysis by exploring online databases and checking references as well as footnotes of relevant journals and review articles. Our aim at this stage was to trace all accessible SLA studies that empirically examined the effects of VIE on learning of grammatical items through reading tasks.
To our knowledge, Lee (Reference Lee2007) is the most recent study that attempted to undertake a comprehensive review of the VIE research domain. Of the 13 studies reviewed there, 11 were published articles and 2 were doctoral dissertations. With this work as a starting point, we undertook a further search for published articles and unpublished dissertations on the effects of VIE on grammar learning in five electronic databases: Educational Resources Information Center, Linguistic and Language Behavior Abstracts, ProQuest Digital Dissertations, PsycARTICLES, and PsychInfo. Combinations of the following terms were used in our search for abstracts in the databases: (a) OR search terms: input enhancement, enhanc*, typographical, textual, focus on form, implicit, unobtrusive, incidental, attention, attend, and notic*; (b) AND search terms: reading, grammar, and linguistic. In our attempt to conduct a comprehensive and exhaustive search of the available resources, we also manually checked five journals that have published at least one VIE study (Applied Language Learning, Hispania, Language Learning, Spanish Applied Linguistics, and Studies in Second Language Acquisition), from the first issue of 1981 to the latest issue as of April 2006.Footnote 1 We then extended the manual search to four additional journals (Applied Linguistics, Modern Language Journal, Second Language Research, and TESOL Quarterly) as well as references and footnotes in relevant textbooks (e.g., Doughty & Williams, Reference Doughty and Williams1998; Wong, Reference Wong2005). Through these extensive and systematic searches, two additional studies were identified as eligible for the current research synthesis (Ha, Reference Ha2005; Kubota, Reference Kubota2000). As a result, a total of 16 primary studies were identified and analyzed for the present synthesis. All the studies included are marked with an asterisk (*) in the Reference section. Upon coding and analysis of each primary study, it was determined that the 16 studies contributed a total of 20 unique samples available for synthesis; that is, when different groups of learners (i.e., different unique samples) within the same study received VIE treatments on distinct target forms, we treated each group as a unique study sample and extracted an effect size for each one (e.g., Jourdenais, Reference Jourdenais1998; Kubota; Overstreet, Reference Overstreet2002).
It should be noted here that we included only published studies and dissertations. Thus, it is possible that there might be a large pool of studies that have not been published and are excluded from the current synthesis. For example, in the process of the literature search we encountered some so-called fugitive literature, such as manuscripts in conference proceedings (e.g., Wijaya, Reference Wijaya2000) and in-house working papers (e.g., Izumi, Reference Izumi2003). We decided not to include fugitive literature other than dissertations because of considerations of replicability of the current research synthesis, as it was evidently infeasible to locate all such literature with the methods that we undertook for study retrieval. We would like to emphasize that in no way is the present study a final, definitive answer to the questions regarding the effects of VIE. Rather, the study should be understood as a formative evaluation of this research domain.
Study Eligibility Criteria
The primary studies retrieved for the current meta-analysis met the following inclusion and exclusion criteria:
1. Studies included in the current meta-analysis were experimental or quasi-experimental in design, recruiting participants who were L2 or foreign language learners. First language (L1) studies were excluded from the current review (e.g., Lorch, Lorch, & Klusewitz, Reference Lorch, Lorch and Klusewitz1995).
2. Studies included examined the effects of VIE on learning of grammatical items targeted by study design through reading tasks, and the effects were investigated by posttest measure(s). Studies involving single-sentence reading tasks rather than natural reading tasks (e.g., Robinson, Reference Robinson1997; J. N. Williams, Reference Williams1999) and those that examined the development of vocabulary knowledge (e.g., Barcroft, Reference Barcroft2003; Kim, Reference Kim2003) or L2 pragmatic awareness (e.g., Witten, Reference Witten2002) were therefore excluded.
3. Studies included compared the relative effects of VIE with control or comparison group(s). Studies in which VIE groups served as comparison groups to address questions other than the effects of VIE were therefore excluded (e.g., Sato, Reference Sato2005; Seiba, Reference Seiba2001).
4. Studies included were articles published in refereed journals, articles published as book chapters, or unpublished dissertations. Other fugitive literature, such as in-house working papers (e.g., Izumi, Reference Izumi2003), papers in conference proceedings (e.g., Wijaya, Reference Wijaya2000), and master's theses (e.g., Pacheco, Reference Pacheco2004), was excluded.
5. Studies included reported adequate information for effect sizes to be calculated. Thus, studies that failed to report descriptive statistics were not included (e.g., Leeman et al., Reference Leeman, Arteagoitia, Fridman, Doughty and Schmidt1995).
6. Studies included appeared between the years 1981 and 2006 (see Footnote Note 1).
7. Studies included were written in English. This was to avoid any possible bias in sampling the pool of primary studies and thereby to ensure the replicability of the current meta-analysis.
8. If the same study and sample was reported across several sources, only one report was included in the current meta-analysis. For example, if a dissertation and a published article based on it existed, the latter was included in the synthesis (i.e., Doughty, Reference Doughty1988, Reference Doughty1991; Izumi, Reference Izumi2000, Reference Izumi2002; White, Reference White1996, Reference White, Doughty and Williams1998; Wong, Reference Wong2000, Reference Wong2003), and the dissertation was consulted to retrieve data necessary for the meta-analysis only if these data were not reported in the published article.
Coding of Primary Studies
After identifying the body of research literature that met our inclusion criteria, a coding scheme was developed to classify common characteristics of the 16 studies and to compile the relevant information from all of them. After extensive piloting, the final comprehensive coding scheme included two major categories for methodological features: (a) learner characteristics and (b) research design. The complete list of variables considered for coding is included in the Appendix.
Learner characteristics were considered a main category for the analysis, so studies were coded for total number of participants, number of participants per each unique study sample, length of study of the target language, and context of L2 study. Information on the extent of previous knowledge of the participants on the targeted form and the actual proficiency levels of participants were also coded, because these attributes were considered critical factors in determining the impact of VIE. Primary studies described the proficiency levels of participants in various ways. To aid in coding proficiency, we employed Thomas's (Reference Thomas, Norris and Ortega2006) four-way classification for proficiency assessment measures: (a) impressionistic judgment, (b) institutional status, (c) in-house assessment, and (d) standardized tests (see Thomas for details of each assessment type).
As for the design features of the primary studies, we coded such features as the target language, targeted linguistic forms, reading materials, dependent variables and types of measures used, and any other independent variables examined apart from VIE. With regard to the features of dependent variables in particular, we coded the relative processing demands the measures placed on the participants as they engaged in producing language. The measures were first distinguished as receptive or productive. For instance, one of the most common measures used for pretests, the grammaticality judgment task, is typical of a receptive measure. Picture description, often used for posttests, was coded as a productive measure. If the measure was considered to tap the productive side of language use, the coders then determined how much guidance was provided for such production. A free written recall, for example, was considered less guided and was thus classified as a free constructed measure, whereas a short-answer type of comprehension task was regarded as more guided and was therefore coded as a constrained constructed measure. We also coded the measures used for gauging learners' degree of noticing.
Additionally, we reasoned that the intensity of treatment sessions—namely the amount of exposure to target forms—would potentially account for the outcomes of research findings. Not only the number of treatment sessions but also the detailed amount of time for each step of the procedure in the experiments were therefore coded, including the interval between the pretest and the first treatment session, the interval between the last treatment session and the posttest, the duration of the treatments, the amount of time for all treatment sessions, and the actual reading time.
The two authors worked independently to code each study according to the established criteria. The intercoder reliability estimate between the two researchers was 94.1% simple percent agreement. Any disagreements were resolved through iterative discussion until 100% agreement was obtained.
RESULTS
The Research Synthesis
We examined the 12 published articles and 4 unpublished dissertations according to the established coding categories to obtain a comprehensive understanding of the characteristics of the studies.
Publication Characteristics
Although Sharwood Smith (Reference Sharwood Smith1981) first suggested the potential pedagogical benefits of VIE, it was not until 1991—10 years later—that the first empirical research designed to probe its actual effects appeared (Doughty, Reference Doughty1991). During our literature search, we noted that since the advent of such VIE studies, only a small number of studies have been conducted (16 since 1991). Furthermore, only a small number of researchers have been engaged in investigating the use of VIE as a pedagogic choice (a total of 16), and we found some researchers as authors of more than two of the studies we located for inclusion (e.g., Doughty and Leow for three studies each). This limited number of studies from a small research community resulted in a great deal of the overlap between the dissertations and published articles that we found: As shown in Figure 1, of the eight dissertation studies that met our inclusion and exclusion criteria after the screening procedure, four were already included in the published articles eligible for inclusion in the meta-analysis. This publication pattern indicates that the VIE domain is still a young area of research.
Sources of publication for the included studies.

Learner Characteristics
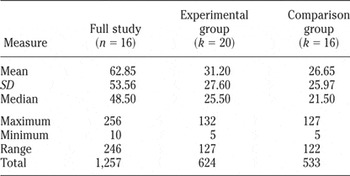
A total of 1,257 participants and 20 unique samples were involved in the 16 VIE studies, most of which were from foreign language contexts (n = 13, or 81% of the 16 studies). As can be seen from the descriptive statistics of the number of participants across each study in Table 1, a wide range of n sizes across the studies was obvious, with a minimum of 10 and a maximum of 256 participants within a single study. The mean and median numbers of total participants were 62.85 and 48.50, respectively. Experimental groups tended to have a larger number of participants than comparison groups.
Sample size across study and groups

Note
k = number of samples contributing to the effect size calculation.
Thomas's (Reference Thomas, Norris and Ortega2006) categorization of learner proficiency measures was adopted to code how researchers documented the proficiency levels of participants. It was found that studies in the VIE domain exclusively consulted the institutional status of their participants for estimating proficiency levels. We also examined actual learner proficiency and reported years of L2 instruction. As illustrated in Figure 2, only one study (Jourdenais, Reference Jourdenais1998) involved advanced learners (6%), whereas four and nine studies recruited beginning and intermediate learners (25% and 56%), respectively. The remaining two studies did not provide sufficient information on either the length of language instruction or the institutional status of their participants (13%). This pattern led us to presume that primary researchers regarded learners at intermediate levels appropriate for their studies. Beginners might not have acquired sufficient reading skills required for processing VIE-embedded texts and, conversely, advanced learners might have had abundant previous exposure to various grammatical structures, which might result in an intervening variable influencing the findings on VIE effectiveness.
Proficiency levels of study participants.

It was expected that learners' prior knowledge of target forms would significantly affect the degree of acquisition of enhanced grammatical forms. Based on reported pretest scores, learners from 13 of the 16 studies (81%) were determined to have little or minimal knowledge of the target forms under investigation. Of the three remaining studies (19%), one (Alanen, Reference Alanen and Schmidt1995) targeted artificial Finnish and thus presumed no prior knowledge of the language on the part of the participants. In the other two studies (Ha, Reference Ha2005; Jourdenais, Ota, Stauffer, Boyson, & Doughty, Reference Jourdenais, Ota, Stauffer, Boyson, Doughty and Schmidt1995), participants scored more than 60% on the pretests. Ha's study targeted English determiners, linguistic elements with presumably high frequency, which might explain participants' relatively high degree of previous knowledge of the target forms. Learners in Jourdenais et al.'s study scored an average of 81% on pretests of Spanish preterit and imperfect tense. One should employ caution, however, when interpreting a study with learners who already possess a rich knowledge of the target prior to the study's treatments.
Research Design
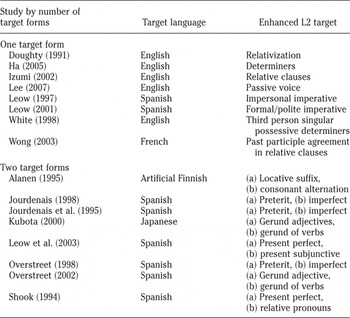
Eight of the 16 studies had Spanish (50%) and 5 had English (31%) as their L2 target; the remaining 3 studies targeted Finnish, French, and Japanese, respectively. As for the target forms examined, the 16 primary studies employed a wide range of grammatical structures as the focus of enhancement (see Table 2). It seems that decisions about which structures to target mainly depended on the researchers' judgments about which grammatical structures cause difficulty for learners. Additionally, half of the studies focused on only one target form (n = 8) and the other half utilized two different target forms concurrently highlighted in the texts for learners to process (n = 8). Among the eight studies designed with two target forms, five studies presented the two target forms to the same group of participants and three studies recruited different VIE groups for different target forms.
Targets of enhancement across the 16 studies

The most commonly employed VIE cues were boldfacing and underlining (n = 14 and 11, respectively). One study employed an italicization method as the only typographical cue (Alanen, Reference Alanen and Schmidt1995), and the others utilized more than two cues in combination and up to four cues concurrently.
Half of the studies utilized only one measure to determine the extent of learners' grammar learning (n = 8) and the other half used two or more measures (n = 8). As shown in Figure 3, over half (59%) of a total of 22 grammar learning measures were designed to elicit productive responses (n = 13) rather than to test learners' receptive knowledge (n = 9, or 41%). Nine of the 13 productive measures, such as sentence completion tasks, fill-in-the-blank production tasks, and correction tasks, were considered constrained construction types (69%) and four productive measures were free construction types (31%) such as written narration tasks and oral picture description tasks.
Measures of grammar learning and meaning comprehension.

Nine studies (Doughty, Reference Doughty1991; Jourdenais, Reference Jourdenais1998; Lee, Reference Lee2007; Leow, Reference Leow1997, Reference Leow2001; Leow et al., Reference Leow, Egi, Nuevo and Tsai2003; Overstreet, Reference Overstreet1998, Reference Overstreet2002; Wong, Reference Wong2003) further assessed learners' degree of comprehension while reading (56%), mainly employing either various forms of comprehension questions or free recalls as measures. Figure 3 indicates that of the 11 reading comprehension measures used across the 9 studies, 5 (45%) were receptive measures such as multiple-choice comprehension questions, and the remaining 6 (55%) were productive measures: 4 free constructions (all of them L1 free recall tasks) and 2 constrained constructions in short-answer comprehension checkup formats. Although the reported effects of VIE on learners' meaning processing were not statistically significant in most of the studies, both Lee and Overstreet (Reference Overstreet1998) reported that VIE might have observable debilitating effects on the processing of meaning comprehension.
In addition to grammar learning and reading comprehension, the amount of noticing of target forms induced by VIE, as a moderating variable, was another focus of interest in the VIE domain. Among the 16 studies, 3 measured the amount of learners' noticing of the enhanced targets with an explicitly stated research question. Izumi's (Reference Izumi2002) study used note-taking scores to investigate whether input enhancement and output activities, in isolation or in combination, can promote noticing. Izumi found that VIE promoted noticing; however, VIE learners who took more notes did not necessarily perform better on L2 posttests. Both Leow (Reference Leow2001) and Leow et al. (Reference Leow, Egi, Nuevo and Tsai2003) employed think-aloud protocols to investigate the benefits of VIE interventions on the degree of noticing. Their results uncovered no helpful effects of VIE on readers' intake or any significant benefits of VIE over unenhanced input for the amount of reported noticing. Although the relative magnitude of VIE effects for grammar pedagogy contingent on noticing measures as well as various target forms would be of interest for further meta-analytic inquiry, these were not amenable to the current meta-analysis because too few studies have looked at noticing and there is no systematic replication in the L2 targets across studies to date.
Treatment Intensity
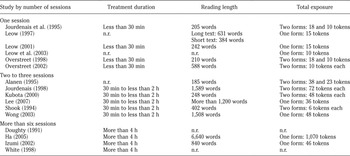
Overall, the treatments of all 16 primary studies lasted from 1 day to 4 weeks. The number of treatment sessions differed greatly, from 1 single session up to 10 sessions. More specifically, as demonstrated in Table 3, six studies were one-shot experimental designs (38%), six studies administered two or three treatment sessions (38%), and the remaining four studies had more than six treatment sessions (25%).
Treatment sessions and total amount of treatment time

Note
n.r. = not reported
As seen in Table 3, the difference in the number of treatment sessions directly influenced such factors as the length of the reading texts used, duration of the treatments, total treatment time, and actual exposure time to targeted forms. Thus, the four studies that had one single treatment session lasted less than 30 min (31%). The five studies that had two or three sessions lasted 30 min to less than 2 h (38%), and the other four studies that had more than six sessions are the ones characterized by treatment lengths of more than 4 h (31%). It should be noted that in three studies it was not possible to estimate the actual treatment time (cf. all cases marked n.r. in Table 3) due to insufficient description of the treatment settings. This suggests the need for more explicit, accurate description of study features for future studies. Depending on the number of treatment sessions in each study, there was also a notable difference in the amount of reading in which participants engaged. The longest reading text contained a total of 6,640 words (Ha, Reference Ha2005) and the shortest was 185 words (Alanen, Reference Alanen and Schmidt1995). Influenced by the nature of target forms and the length of reading texts, the number of tokens per target form also varied substantially, with a maximum of 1,070 (Ha) and a minimum of six exposure instances (Shook, Reference Shook1994).
Of the 11 studies that reported the interval between the pretest and the first treatment session, 9 studies (82%) had an interval of more than 5 days, presumably to avoid priming effects, and the remaining 2 studies (18%) left less than a 1–2-day interval. Conversely, 11 of the 16 studies (69%) delivered the posttest immediately after the last treatment session. Only three studies (19%) investigated learners' retention of the target form by using delayed posttests, as few as 2 weeks and as many as 5 weeks after the immediate posttest had been administered.
The Quantitative Meta-Analysis
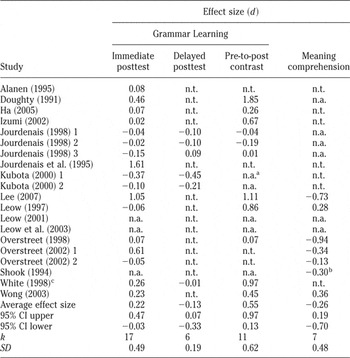
To address the second research question and examine the magnitude of effects of VIE on grammar learning, Cohen's (Reference Cohen1988) effect size d values were calculated from each individual study. These are presented in Table 4.Footnote 2 The main effect size calculation was based on the contrast of the mean of the experimental group with that of the comparison group on immediate posttest measures. To answer the question adequately, however, the comparisons should have involved true control groups with reading conditions in which the form in focus occurred infrequently in intact texts. This was not possible because there was only one study that met this design criterion (Jourdenais, Reference Jourdenais1998). Additionally, although means and standard deviations should be available for deriving d values, this was often not the case. As indicated by missing data (marked n.a.) in Table 4, we could not access such relevant and necessary information for three of the studies.Footnote 3 When a study did not address a particular research question, an effect size was naturally impossible to derive. Such cases are marked n.t. in Table 4.
Summary of effect size d values of primary studies

Note
n.t. = not tested in the particular study; n.a. = not applicable because the study did not provide sufficient data for the effect size calculation; k = number of samples contributing to the effect size calculation.
a We could not calculate pre-to-post d values for Kubota's (Reference Kubota2000) study because different measures were used for the pretest and posttest.
b Shook (Reference Shook1999) contributed to the calculation of this value.
c The d values were calculated from White's (Reference White1996) dissertation.
Three studies (Jourdenais, Reference Jourdenais1998; Kubota, Reference Kubota2000; White, Reference White, Doughty and Williams1998) administered delayed posttests, and d values were calculated again by contrasting experimental groups with comparison groups on delayed posttest scores. Because effect sizes could be calculated on every possible contrast depending on the number of independent and dependent variables, each primary study often produced more than two effect sizes. As noted by Norris and Ortega (Reference Norris and Ortega2000), multiple effect sizes from one study might be averaged for an examination of the combined impact of the study's treatment across tasks. For this meta-analysis, however, if a primary study investigated different target forms with different pools of participants—that is, if different groups of participants experienced different targets—each group was considered an independent study sample. This choice was reasonable not only because target structure might be an important moderating variable (Norris & Ortega) but also because it is plausible that the distinctive characteristics of participants across studies justify our treating each study as an independent study sample. This reasoning resulted in three d values for Jourdenais and two d values each for Kubota and Overstreet (Reference Overstreet2002) (cf. Table 4).
Calculated effect sizes were interpreted following Cohen's (Reference Cohen1988) suggestions for the characterization of the effect size values: d values around 0.20 should be understood as small effects, 0.50 as medium effects, and 0.80 and above as large effects. To verify statistical trustworthiness of the produced effect sizes, 95% confidence intervals were calculated and are provided in Table 4. Simply put, two nonoverlapping confidence intervals indicate that the difference of the two averaged effect sizes is statistically trustworthy, whereas overlaps of the two intervals mean nontrustworthiness of observed difference of the averaged effect sizes. Additionally, effect sizes with confidence intervals whose lower boundary touches or contains zero indicate no statistically significant effect.
As shown in Table 4, students who experienced VIE conditions outperformed the comparison groups by 0.22 standard deviation units. In other words, VIE had very small-sized overall effects on learners' grammar learning. The mean (d = 0.22) is indeed clearly small when compared with what Norris and Ortega (Reference Norris and Ortega2000) reported for the overall effects of L2 instruction (d = 0.96) as well as the effects of implicit focus-on-form treatments (d = 0.69). Additionally, because the confidence interval (−0.03 to 0.47) includes zero, the observed effects are not statistically trustworthy. The impact of VIE on delayed posttests was found to be negligible (d = −0.13), as the d value was such a small portion of a standard deviation unit. It should be noted again that all of these effect sizes—except those from Jourdenais (Reference Jourdenais1998)—were derived from the comparison of VIE treatments with input flood treatments; that is, the d values reflect the effectiveness of VIE over input flood treatments rather than the absolute magnitude of effectiveness of VIE, which could only be measured by comparing VIE to no exposure conditions.
Pre-to-post effect size d values were also calculated to investigate the degree to which learners improved after the VIE treatment sessions from the different perspective of within-group change. Table 4 illustrates that students provided with enhanced versions of texts improved from the pretest to the posttest by a medium-sized effect (d = 0.55). This was a considerably smaller effect than that found by Norris and Ortega (Reference Norris and Ortega2000) for the pre-to-post change associated with overall L2 instruction (d = 1.66) and the pre-to-post change resulting from implicit focus-on-form treatments (d = 1.51).
To address the third research question, it was necessary to calculate effect sizes on dependent measures of meaning comprehension. Six primary studies (seven unique study samples) contributed to these calculations (see Table 4). The calculations were again done by contrasting the means of the experimental groups with those of the comparison groups on posttreatment reading comprehension measures. The averaged effect size for VIE students' meaning comprehension was small but negative in its direction (d = −0.26). Although the confidence interval includes a zero value (−0.70 to 0.19), the pattern of results is suggestive of a tendency for VIE to affect learners' meaning processing negatively.
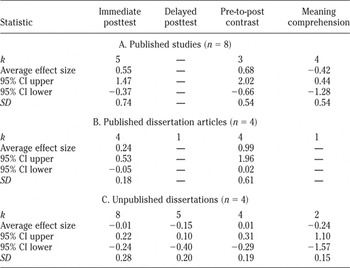
Research question 4 asked whether publication bias would be at work in this research domain. To address this question, we further analyzed the relative effects of VIE for studies grouped in terms of type of publication: published, published based on dissertation research, and unpublished dissertations. Table 5 demonstrates that the averaged effect sizes for learners' grammar learning on the immediate posttests were d = 0.55 for published studies, d = 0.24 for published studies based on dissertation research, and d = −0.01 for unpublished dissertations. Due to the small number of study samples (k = 5, 4, and 8), the difference of the observed averaged effect sizes was not statistically trustworthy, as evidenced by the overlaps of the 95% confidence intervals (−0.37 to 1.47, −0.05 to 0.53, and −0.24 to 0.22, respectively). Additionally, each confidence interval includes zero. Even though the inclusion of more studies would lead us to more solid conclusions, the current findings suggest a publication-bias trend.
Average effect sizes by publication type

Note
Published studies: Alanen (Reference Alanen and Schmidt1995), Jourdenais et al. (Reference Jourdenais, Ota, Stauffer, Boyson, Doughty and Schmidt1995), Lee (Reference Lee2007), Leow (Reference Leow1997, Reference Leow2001), Leow et al. (Reference Leow, Egi, Nuevo and Tsai2003), Overstreet (Reference Overstreet1998), Shook (Reference Shook1994); published dissertation articles: Doughty (Reference Doughty1991), Izumi (Reference Izumi2002), White (Reference White, Doughty and Williams1998), Wong (Reference Wong2003); unpublished dissertations: Ha (Reference Ha2005), Jourdenais (Reference Jourdenais1998; 3 samples), Kubota (Reference Kubota2000; 2 samples), Overstreet (Reference Overstreet2002; 2 samples).
This trend was also supported by results from meaning comprehension measures, although in the opposite direction: The averaged negative effect size of the published studies (d = −0.42) was larger than that of the unpublished dissertations (d = −0.24); there was only one study in the published dissertation category, so the average calculation of effect sizes was not feasible. In both cases, 95% confidence intervals were wide in range (−1.28 to 0.44 and −1.57 to 1.1) due to the small number of study samples (k = 4 and 2). Figure 4 graphically shows the publication findings.
Average effect sizes and 95% confidence intervals of each contrast for the three types of publication.

DISCUSSION AND CONCLUSIONS
The primary goal of this study was to address the magnitude of the overall impact of VIE on grammar learning. It was found that learners exposed to enhanced texts outperformed learners who read unenhanced texts by a very small-sized effect (d = 0.22). However, as already noted, the effect size d values were calculated by contrasting experimental groups with comparison groups rather than true control groups. The comparison groups were provided with another intervention: input flood. For this reason, the small magnitude of the overall effect of VIE should be interpreted as the relative impact of enhancement over flood of input, which in itself is thought to have small but detectable effects on grammar learning (see Trahey & White, Reference Trahey and White1993, and Williams & Evans, Reference Williams, Evans, Doughty and Williams1998, for discussion on the beneficial effects of input flood). The relatively small-sized effect (d = 0.22) of VIE on learners' grammar learning can only be put into perspective in this relative light.
It was also noteworthy that VIE might have had negative effects on learners' meaning processing, as shown by the small but negative effect size value yielded by the reading comprehension measures (d = −0.26). This could be accounted for by a competition between learners' form and meaning processing. As proposed by a group of primary studies (e.g., Bransdorfer, Reference Bransdorfer1991; Lee, Reference Lee2007; VanPatten, Reference VanPatten1990; Wong, Reference Wong2001), learners might have difficulty simultaneously paying attention to both form and meaning. More studies in the future should address, by design, this theoretical relationship between form and meaning in VIE treatments.
To date, primary researchers have drawn conflicting conclusions on the effectiveness of VIE on grammar learning, and the meta-analytic data presented here confirm that the results are inconclusive in the extant research. We believe the findings presented in our synthesis indicate the divergence of methodological features of the primary study groups as one of the factors that generate such undeterminacy of results. When the 16 primary studies and 20 unique samples identified in the literature search were systematically coded for study features, it became clear that the 16-study pool is indeed heterogeneous in many ways. The 20 unique study samples had distinctive profiles with regard to the background of the study participants, materials used, specific procedures undertaken, and the like. Moreover, the domain of research on the effects of VIE on grammar learning is not yet a fully developed area of inquiry, which is evident from the fact that only four unpublished dissertations and 12 articles published in refereed journals have appeared in the last 15 years or so. Given that several of these studies were produced by the same researchers, it also appears that VIE research has mainly been undertaken within a relatively small research community to date. More studies on VIE are thus needed, because a larger empirical basis would enable us to clarify the research domain with more confidence. We would like to conclude with some reflections on key issues that might contribute to better understanding and eventually improving the research domain of VIE investigations in the future.
Our first recommendation for future studies pertains to the variable of learner proficiency. It was found that researchers of VIE have exclusively relied on participants' institutional status to classify their proficiency levels. This was strikingly different from the observation by Thomas (Reference Thomas, Norris and Ortega2006), who, from her analysis of two corpora compiled from articles from four journals (Applied Linguistics, Language Learning, Second Language Research, and Studies in Second Language Acquisition) in two time periods, 1988–1992 and 2000–2004, demonstrated that although 40.1% and 33.2% of the studies reported institutional status in the two time periods, respectively, other assessment measures (i.e., in-house assessment and standardized test) have also been used fairly often in the overall field of SLA. Learner proficiency might be one of the decisive factors affecting the ability of learners to focus on form on their own or to benefit from the impact of pedagogic focus-on-form interventions (J. Williams, Reference Williams1999). Therefore, future studies should deliberately employ additional measures or indexes to accurately gauge the participants' level of proficiency.
A majority of the primary studies recruited participants with minimal knowledge of the targeted forms (n = 13, or 81%). It has not yet been determined how much prior knowledge learners should have in order to benefit from VIE. As might be the case for any intervention technique, VIE would be expected to produce more positive results when learners have some prior exposure to the targeted forms (Lee, Reference Lee2007). In this regard, it should be noted that two studies that recruited participants with a comparatively high degree of knowledge of the targets (Ha, Reference Ha2005; Jourdenais et al., Reference Jourdenais, Ota, Stauffer, Boyson, Doughty and Schmidt1995) reported contradictory results in terms of the magnitude of effects of VIE on grammar learning. The magnitude reported by Ha was only negligible (d = 0.07), but the averaged effect size for Jourdenais et al.'s study was large (d = 1.62). Prior knowledge of target forms might interact with the nature of the targets, producing these incongruous learning outcomes. For instance, Ha's study targeted determiners, a highly frequent structure in learners' previous experience, and a flood or a VIE treatment might thus have made little contribution to their learning of this structure. Future investigations should be designed to address the interplay between learners' prior knowledge and the nature of target forms, so as to gain answers to the question of appropriate knowledge prior to VIE interventions. Additionally, researchers as well as teachers might need to consider whether L2 readers are developmentally ready to acquire particular target forms, as recommended by a number of researchers (Lightbown, Reference Lightbown, Doughty and Williams1998; Mackey, Reference Mackey1999; Mackey & Philp, Reference Mackey and Philp1998; Philp, Reference Philp2003; Spada & Lightbown, Reference Spada and Lightbown1999).
It was also observed that the VIE studies overall have been short term in nature, with 38% of them (n = 6 of 16) involving only a single treatment session that featured less than 30 min exposure to target forms. Additionally, because there have been only three studies that administered delayed posttests (19%), it was not possible to determine how durable the effects of VIE might be on learners' developing L2 systems, although this could be an important consideration for language pedagogy. Future studies to investigate questions surrounding the appropriate intensity of VIE treatments and durability of VIE benefits would be a welcome addition to the research domain.
It should be acknowledged that the features mentioned so far (e.g., learner proficiency, prior knowledge of the participants, extent of the treatment intensity in light of the number of sessions and length of reading texts, and reported degree of noticing) could be intervening variables that deserve additional investigation via meta-analysis. Yet, in the current study, it was decided not to probe those variables for further analyses, largely due to the small number of study samples. Questions of the relative effects of VIE contingent on these variables, however, would be viable for future studies, extending the inquiries to probe the underlying factors that might be implicated in the process of reading enhancement-embedded texts.
A possible publication bias was noted in the current study. Effect size d values for the immediately administered posttest measures for grammar learning ranged from medium (d = 0.55) to small-sized (d = 0.24) for the group of published studies, whereas the effect size value was negligible (d = −0.01) for the unpublished dissertation studies. Therefore, caution should be exercised in interpreting findings reported by a number of studies published in refereed journals, in that they might not be representative of the true effects of VIE across educational contexts.
The conclusions that can be drawn from the present synthesis are tentative rather than definitive, due in large part to the small number of studies that were viable for the current review, their divergent methodological features, and the evidence suggesting a publication bias in the research domain. Future cumulative research with explicit reporting—especially on the description of treatment sessions—is sorely needed, so that more reliable empirical findings can better inform teachers regarding their practices with VIE treatment. The present study poses intriguing and valuable research questions worth examining in future research. It is now time to embark on studies that probe the underlying questions of what exactly influences learners' perception of enhanced forms and how the processing of these enhanced forms might facilitate L2 grammar learning.
APPENDIX: CODED VARIABLES
Learner Characteristics
I. Participants
A. n size
1. Total n
2. n per cell
B. How proficiency levels were defined
1. Impressionistic judgment
2. Institutional status
3. In-house assessment
4. Standardized test
C. Proficiency levels of participants
1. Beginning
2. Intermediate
3. Advanced
D. Knowledge of the targeted form(s)
1. No knowledge (No formal exposure)
2. Minimal knowledge
3. Some knowledge
E. Length of L2 study
F. Learning context
Research Design
I. Target language
II. Target forms
A. Target forms
B. Number of types
C. Number of tokens
D. Typographical cues
III. Materials
A. Text type
B. Text length (total number of words used for the treatment[s])
1. 0–300 words
2. 301–600 words
3. 601–900 words
4. 901–1,200 words
5. 1,201 and above words
IV. Other independent variables in addition to input enhancement
V. Dependent variables
A. Types of measures used for pretests
B. Measures used for form learning
1. Receptive
2. Productive
i. Free constructed
ii. Constrained constructed
C. Measures used for meaning comprehension, if any
1. Receptive
2. Productive
i. Free constructed
ii. Constrained constructed
D. Measures used for noticing, if any
VI. Treatment intensity
A. Number of treatment sessions
B. Interval between the pretest and the first treatment
1. Both on the same day
2. 1–2 days
3. 3–4 days
4. More than 5 days
C. Interval between the last treatment and the posttest
1. Both on the same day
2. 1–2 days
3. 3–4 days
4. More than 5 days
D. Duration of the treatment(s)
1. 1 day
2. 2 days to less than 1 week
3. 1 week to less than 2 weeks
4. 2 weeks to less than 3 weeks
5. More than 3 weeks
E. Total amount of treatment time
1. Less than 30 min
2. 30 min to less than 60 min
3. 1 h to less than 2 h
4. 3 h to less than 4 h
5. More than 4 h
F. Total amount of reading time
1. Less than 30 min
2. 30 min to less than 60 min
3. 1 h to less than 2 h
4. 3 h to less than 4 h
5. More than 4 h