





1. Introduction
Accurate and actionable media coverage of the climate crisis and its solutions is critical for informing the public and decision-makers, and in driving support for effective and necessary climate policies. A recent report by the Reuters Institute for the Study of Journalism found that news media is the main source of climate information for the public, ahead of social media and other sources (Ejaz et al., Reference Ejaz, Mukherjee and Fletcher2025). The amount of media coverage on climate change directly affects public concern and is largely influenced by political activities, such as congressional hearings, votes, and press releases (Carmichael & Brulle, Reference Carmichael and Brulle2017). However, climate coverage is still low compared to other topics, such as politics, particularly in the US, where only 34% hear about climate at least weekly in the news media (Ejaz et al., Reference Ejaz, Mukherjee and Fletcher2025).
Climate change is a highly polarized issue in the US, where false balance in climate news coverage has contributed to a substantial gap between public understanding and scientific consensus (Tindall et al., Reference Tindall, Stoddart and Callison2018). Americans are divided in their beliefs about the causes and effects of global warming and in their climate attitudes, behaviors, and policy support (Rode et al., Reference Rode, Dent, Benedict, Brosnahan, Martinez and Ditto2021; Stockus & Zell, Reference Stockus and Zell2025). These differences are strongly associated with party affiliation and ideological orientation, with liberals being more likely than conservatives to view climate change as an urgent matter requiring immediate action (Stockus & Zell, Reference Stockus and Zell2025). Conservative white males are particularly skeptical of climate action and contribute disproportionately to climate change denial in the US (McCright & Dunlap, Reference McCright and Dunlap2011). Notably, almost two-thirds of conservative white males believe that the seriousness of climate change is exaggerated by the media, compared with less than one-third of all other Americans (McCright & Dunlap, Reference McCright and Dunlap2011).
The framing of climate change in partisan news media has amplified existing societal polarization of the climate issue in the US (Carmichael et al., Reference Carmichael, Brulle and Huxster2017; Ophir et al., Reference Ophir, Walter, Jamieson and Jamieson2024). Framing is a communicative process in which certain aspects of a topic are emphasized over others (de Vreese, Reference de Vreese2005). The framing process gives rise to particular frames, understood as underlying structures or principles such as ideas, images, and themes that organize and give meaning to the information presented (Green Saraisky, Reference Green Saraisky2015). By making a specific ‘piece of information more noticeable, meaningful, or memorable’ (Entman, Reference Entman1993, p. 54), frames shape how people interpret and evaluate specific issues (de Vreese, Reference de Vreese2005). For example, frames in conservative US media have historically increased skepticism and concerns about the costs of climate action (Nisbet, Reference Nisbet2009). In contrast, a morality and ethics frame may help depolarize the issue and garner broader support (Nisbet, Reference Nisbet2009), particularly if emphasizing purity, which resonates with conservatives, rather than harm and care, which are more valued by liberals (Feinberg & Willer, Reference Feinberg and Willer2013).
Given the influence of news media coverage on public concern about climate change, it is important to examine how high-carbon sectors are framed in ways that support or contest climate action. One such sector is aviation, which remains underrepresented in public concern about climate change despite its disproportionately high climate impact. At the individual level, air travel is the highest-emitting form of consumption (Ivanova & Wood, Reference Ivanova and Wood2020), with a single long-haul return flight emitting nearly as much as a whole year of driving a conventional car (Ivanova et al., Reference Ivanova, Barrett, Wiedenhofer, Macura, Callaghan and Creutzig2020). Expectations related to convenience (Higham et al., Reference Higham, Cohen and Cavaliere2014; Volden & Hansen, Reference Volden and Hansen2022), social relations (Volden & Hansen, Reference Volden and Hansen2022), and self-enhancement (Aasen et al., Reference Aasen, Thøgersen, Vatn, Dunlap, Fisher, Hellevik and Stern2023) have made air travel a habituated and normalized part of life, particularly among high-income individuals (Oswald et al., Reference Oswald, Owen and Steinberger2020). Flying is also largely framed in a positive way in public discourse, where both mainstream and social media tend to glamorize hypermobile lifestyles (Cohen & Gössling, Reference Cohen and Gössling2015). Moreover, both the aviation industry and policy actors often present continued growth of aviation as inevitable because of the sector's central role in society (Gössling & Peeters, Reference Gössling and Peeters2007; Griggs & Howarth, Reference Griggs and Howarth2019). These actors typically promote solutions that do not challenge rising demand, such as technological improvements and carbon offsetting (Rayner, Reference Rayner2021).
In recent years, however, aviation has come under growing scrutiny for its contribution to climate change. Across Europe, environmental movements (e.g., Fridays for Future, Extinction Rebellion) and anti-airport expansion groups have organized numerous protests calling for policy and behavioral changes to reduce air travel demand (Griggs & Howarth, Reference Griggs and Howarth2023; Kreil, Reference Kreil2021). Through social media platforms such as Twitter, aviation's climate impact has also become of global public interest (Becken et al., Reference Becken, Stantic, Chen and Connolly2022). A notable example is the Swedish phenomenon of flygskam (flight shame), which gained widespread international traction on Twitter in 2018 (Becken et al., Reference Becken, Friedl, Stantic, Connolly and Chen2021), drawing attention to Sweden as a country where growing climate concerns have made people reduce their flying.
While social media has helped bring global attention to aviation's climate impact, less is known about how the issue has been covered in mainstream news media. Research from Sweden shows that views around reduced flying became increasingly represented in national news outlets from the end of 2016 (Ullström et al., Reference Ullström, Stripple and Nicholas2023), suggesting that news media played a role in amplifying public concern around the issue. We aim to investigate if a similar trend can be observed in the US, which has the world's largest aviation market. Flights departing from US airports cause nearly a quarter of all emissions from global passenger aviation (Graver et al., Reference Graver, Zhang and Rutherford2019). Two-thirds of these emissions come from domestic flying, which accounts for approximately 90% of the departures (Graver et al., Reference Graver, Zhang and Rutherford2019). Domestic intercity flying is common within the US due to the large distances between cities and the limited availability of alternatives like high-speed rail (Sobieralski, Reference Sobieralski2021).
In this paper, we investigate the news media debate about aviation and climate change in the US from 2016 to 2020. This period is important because it captures the final years of public discourse on aviation and climate change before the outbreak of the Covid-19 pandemic. The pandemic caused a radical, yet temporary, drop in air travel demand by 66% globally in 2020 (IATA, 2020), while also shifting public attention away from the issue of climate change (Loureiro & Alló, Reference Loureiro and Alló2021; Smirnov & Hsieh, Reference Smirnov and Hsieh2022). This time frame thus represents a critical moment for understanding how aviation's climate impact was being framed in the news media during a phase when public attention around the issue was growing. While we acknowledge that media coverage of aviation and climate change might have changed after this period, we argue that it is important to explore the pre-pandemic years to understand how different frames have influenced public concern and engagement around the issue.
Using an extensive database of US news articles, we employ topic modeling to identify media frames on aviation and climate change, which we analyze with a focus on their content. Considering that different actor groups promote competing solutions to mitigate aviation's climate impact, and that public debates around these solutions vary geographically, we conduct network analysis to explore how the identified frames are shaped by key individuals, organizations, and regions. To further understand how ideological orientation might influence the media debate on aviation and climate change, we compare how frequently the identified frames appear across news outlets with different political leanings. We address the following research questions (RQs):
RQ1: How did US news media frame aviation in the context of climate change between 2016 and 2020?
RQ2: Which actors and places were central to the different frames?
RQ3: How common were these frames across news outlets with different political leanings?
2. Methods and material
The study combines multiple methods for data collection and analysis. Using the All the News 2.0 dataset, we collected articles about aviation and climate change through a two-step process involving (1) keyword searches to compile an initial sample and (2) topic modeling to refine this sample and identify media frames. For data analysis, we employed three approaches, each addressing a separate RQ. First, we conducted frame analysis (RQ1) by combining automated clustering with manual coding. Second, we employed network analysis to identify central actors and places within the identified frames (RQ2). Third, we classified news outlets according to their political leaning and analyzed the distribution of the identified frames across outlets with different political orientations (RQ3). The following sections describe these methods and procedures in detail.
2.1. Data collection
The media articles for this study were collected from the publicly available All the News 2.0 dataset, which includes approximately 2.7 million articles from 26 US newspapers and magazines, spanning from January 1, 2016, to April 2, 2020, when the database was discontinued. Using the criteria described below, we collected a sample of 898 media articles reflecting the news coverage of aviation and climate change in the US during this period.
2.1.1. Initial sample: keyword searches
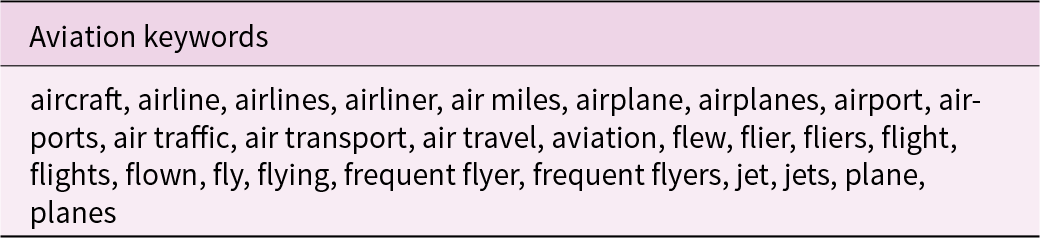
To collect an initial sample of articles, we employed a keyword-based filtering method combining aviation-related terms (Table 1) with the word ‘climate’. The aviation keywords were selected based on previous research on media depictions of aviation (Becken et al., Reference Becken, Stantic, Chen and Connolly2022; Peeters et al., Reference Peeters, Higham, Kutzner, Cohen and Gössling2016) and the authors’ prior knowledge of the topic. Adding ‘climate’ ensured that retrieved articles addressed aviation in a climate context. We considered using the more specific term ‘climate change’, but given that our dataset was already filtered by aviation keywords, we determined ‘climate’ to be sufficiently specific while remaining broad enough to capture several climate terms (e.g., climate change, climate crisis, climate action). We also considered alternative terminology such as ‘global warming’, ‘greenhouse gas’, and ‘carbon emissions’. However, these terms frequently co-occur with ‘climate’ in media texts (Lundgaard, Reference Lundgaard2021), making the latter a suitable filter.
Aviation-related keywords used for collecting media articles. Selected articles featured at least one of the aviation keywords, plus the word ‘climate’

Figure 1 Long description
27 keywords are listed in the table, including aircraft, airline, airlines, airliner, air miles, airplane, airplanes, airport, airports, air traffic, air transport, air travel, aviation, flew, flier, fliers, flight, flights, flown, fly, flying, frequent flyer, frequent flyers, jet, jets, plane, planes.
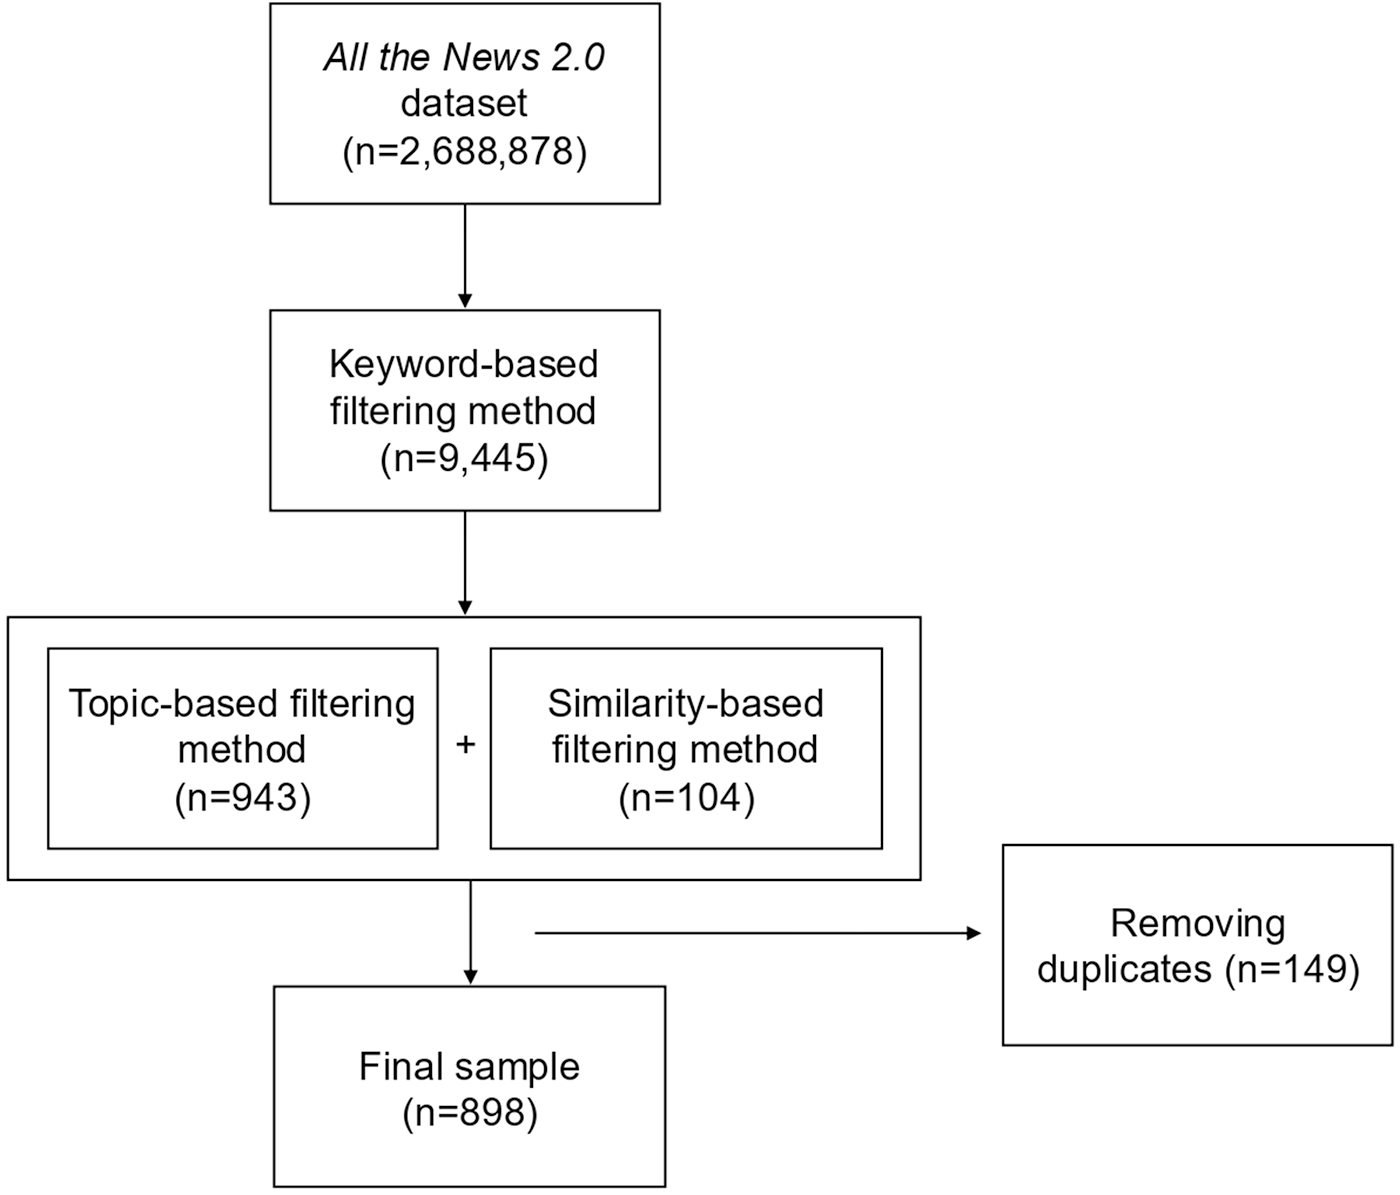
The keyword-based filtering was implemented using the Pandas library, a Python-based tool for data manipulation. We developed an algorithm that searched for the presence of any aviation keyword (e.g., ‘airplane’ or ‘flight’) and the word ‘climate’ within the headline or body text of each article in the dataset. This approach was applied to the full document collection, keeping only those articles that returned a positive match for both requirements. The keyword-based filtering generated a total of 9,445 articles. However, upon reviewing a randomized selection, we found that many articles primarily addressed issues not related to our research focus, such as US politics or the economy. To ensure relevance, we further refined the sample using topic modeling, as described in the next section.
2.1.2. Refinement of sample: topic modeling
From our initial sample (n = 9,445), we applied topic modeling to identify the main topics discussed in the articles and refine the sample based on their relevance to our analysis. Topic modeling is suitable for organizing large archives of documents such as media texts, as well as for filtering out irrelevant collections of texts from a sample (Jacobi et al., Reference Jacobi, Van Atteveldt and Welbers2016). To generate topics, we used BERTopic, a topic modeling technique that processes the first 600 characters of each document through a pre-trained language model (Grootendorst, Reference Grootendorst2022). While this means we worked with only a portion of longer texts, the opening paragraphs typically capture a news article's main focus (Pöttker, Reference Pöttker2003).
To determine an appropriate number of topics, we generated models with 40–70 topics, increasing in intervals of 5, and assessed their relevance and coherence based on 15 keywords per topic. The keywords represented the most frequently used words after removing stop words (frequent words that typically do not carry meaningful semantic content on their own, such as ‘the’, ‘of’, ‘to’) and the word ‘said’, which appeared frequently but did not help differentiate topics. We assessed a topic to be coherent if the keywords were meaningfully related to each other. Topics about aviation got more coherent in the range of 55–65 topics, so we generated models for each of those 11 parameter settings. From these, we ultimately chose the model with 58 topics because it included the most coherent topics about aviation and climate change. Two researchers independently rated the internal coherence of these 58 topics on a scale of 1–4, assigned a descriptive label to each one, and grouped similar topics into 12 broader themes: 3 on aviation, 3 on climate change, 5 on other issues (e.g., politics, economy), and 1 incoherent.
For further analysis, we selected all articles from the three aviation themes (n = 983) and extracted relevant articles from one of the climate themes where ‘Thunberg’ appeared as a central keyword (the Swedish climate activist Greta Thunberg has been a prominent figure in media discussions of aviation and climate change [Becken et al., Reference Becken, Stantic, Chen and Connolly2022]). Based on 17 articles from this theme that we manually identified as relevant for our analysis, we created a centroid (a representative point that captures the average characteristics of a group of articles) that we used to search for articles that were similar in content and language. Each article was given a similarity score ranging from 0 to 1, where 1 means identical content and 0 means completely different content. Previous research has suggested that high similarity thresholds can be used to identify documents that are particularly relevant to a given information need (Reimers & Gurevych, Reference Reimers and Gurevych2019; Rekabsaz et al., Reference Rekabsaz, Lupu, Hanbury, Jose, Hauff, Altıngovde, Song, Albakour, Watt and Tait2017). Hence, we decided to include all articles with a cosine similarity above 0.8 (n = 104), which marked a noticeable drop in similarity while also indicating high relevance of articles.
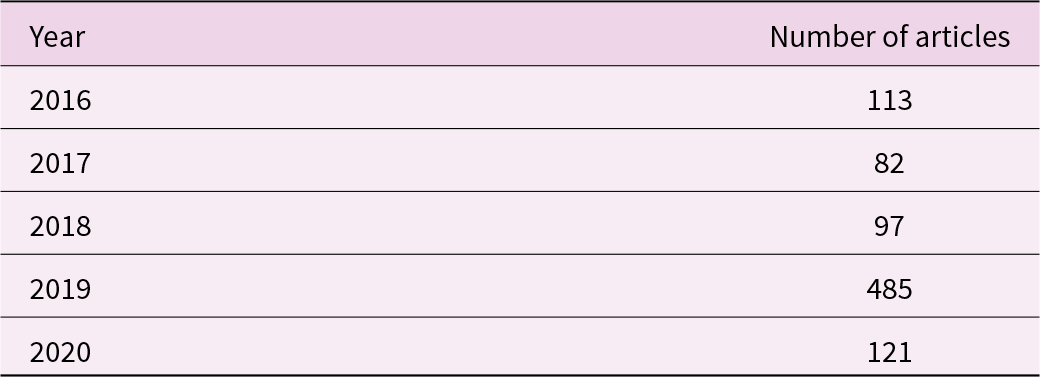
Lastly, we removed duplicates, which resulted in a final sample of 898 articles (Figure 1) published between 2016 and 2020 (Table 2). This sample is sufficiently large for computational analysis while still permitting meaningful qualitative interpretation. Some noise in the dataset is expected when using natural language processing (NLP) techniques, particularly topic modeling algorithms. In our case, this means that relevant articles may have been excluded, while the dataset likely contains articles that do not address aviation in a climate context. However, we argue that the combination of keyword filtering, topic modeling, and manual assessment and selection of topics provides confidence in sample relevance, although we acknowledge that other approaches, such as supervised machine learning, could also have been used.
Overview of the data collection process. We gathered an initial sample of articles (n = 9,445) based on keyword searches. We then refined the sample using BERTopic for topic modeling and a similarity-based filtering method. We removed duplicates, resulting in a final sample of 898 articles.

Distribution of articles per year in our final sample (n = 898)

Table 2 Long description
The sample included 113 articles published in 2016, 82 articles published in 2017, 97 articles published in 2018, 485 articles published in 2019, and 121 articles published in 2020.
2.2. Data analysis
2.2.1. Frame identification and analysis
Based on the topic modeling described above, including both computational analysis to generate topics and manual assessment of topic relevance, our final sample was organized into four overarching themes. Drawing on literature about framing (e.g., Schäfer & O'Neill, Reference Schäfer, O'Neill and Nisbet2017; de Vreese, Reference de Vreese2005), we interpret these themes as indicative of the dominant frames in US news media coverage of aviation and climate change. We acknowledge that topic modeling identifies semantically similar content rather than frames per se. However, media frames are constructed through patterns of language use and co-occurring concepts (Matthes & Kohring, Reference Matthes and Kohring2008), which makes topic modeling a useful starting point for frame identification, specifically in large-n studies (Schäfer & O'Neill, Reference Schäfer, O'Neill and Nisbet2017).
To analyze the content of the identified frames, we combined computational and interpretive methods. This approach aligns with previous research demonstrating the advantages of using computerized analysis to identify overarching patterns in media frames, which are then coded manually to enhance validity (Matthes & Kohring, Reference Matthes and Kohring2008). First, we applied K-means clustering to group similar articles into clusters within each frame, creating smaller frame elements (see Matthes & Kohring, Reference Matthes and Kohring2008) for qualitative interpretation. The number of clusters per frame was determined using the Elbow method, a technique plotting the sum of squared distances against different numbers of clusters to identify the point where adding more clusters provides diminishing returns (Kodinariya & Makwana, Reference Kodinariya and Makwana2013). This process resulted in a total of 12 clusters across the 4 frames, ranging from 2 to 4 clusters per frame.
Second, we used the keyword-generation technique KeyBERT (Grootendorst, Reference Grootendorst2020) to extract the 10 most representative keywords based on article content from each of the 12 clusters (a full list of keywords is included in the Supplementary Material, Table S1). Based on these keywords and a manual review of article titles, we identified patterns in content. For example, one cluster included keywords such as ‘heathrow’, ‘drones’, ‘protest’, and ‘activists’, along with article titles like ‘Drone disruption? Climate activists to target London's Heathrow airport’, which we interpreted as representing a cluster about airport protests.
Third, we used a combination of outputs from ChatGPT-4 (via chat.openai.com) and Gemini 1.5 (via gemini.google.com), both accessed in October 2024, to generate preliminary summaries of each cluster to support our interpretation and analysis. We did not modify or fine-tune any of these tools. For each cluster, we provided the full text from all included articles and prompted the models to return a summary reflecting the main content. These summaries helped the authors identify patterns in content across large sets of articles, guiding where to focus more detailed manual coding. While we acknowledge potential biases in large language models, the summaries were not directly quoted or used as findings. Instead, they functioned as supplementary resources to synthesize large text volumes efficiently. The final interpretations of the clusters were based on manual qualitative analysis, including systematic examination of article titles, representative keywords, and close reading of selected full-text articles.
2.2.2. Network analysis
To identify the main actors and places in US media frames of aviation and climate change, we conducted a network analysis for each of the four frames separately. This analysis focused on identifying frequently mentioned entities (individuals, organizations, and geographic areas) and their co-occurrences within frames. Such an approach is common in previous research analyzing and visualizing networks. For example, in his seminal work, Small (Reference Small1973) established co-citation, a specific form of co-occurrence, as a new measure of semantic similarity between scientific papers. More recently, such co-occurrence networks have played an important role in the development of modern approaches to geometric deep learning on graphs (Hamilton et al., Reference Hamilton, Ying and Leskovec2017; Kipf & Welling, Reference Kipf and Welling2017) and hypergraphs (Arya et al., Reference Arya, Gupta, Rudinac and Worring2025).
We extracted entities from all articles within each frame using spaCy, an open-source Python library for NLP that provides pre-trained models for tasks such as named entity recognition (NER) (Explosion, 2024). We established a 10% mention threshold to focus on the most important entities. After extracting entities, we performed a manual cleaning process to standardize names (e.g., merging ‘United States’, ‘USA’, and ‘US’) and correct any NER misclassifications. Specific events were categorized based on their associations with the main entities. For example, the Paris Agreement, COP25, and the UN Climate Summit were categorized under organizations, while Brexit was categorized as a geographic area.
We then analyzed entity co-occurrences using cosine similarity measures, applying the criterion that each co-occurrence must appear in at least 5% of the articles to highlight meaningful relationships while reducing noise from spurious co-occurrences, a pragmatic approach appropriate for exploratory network analysis. Based on the entities and their co-occurrences, we constructed networks using NetworkX, a Python language package for creating and analyzing networks (Hagberg et al., Reference Hagberg, Schult and Swart2008). The resulting networks were visualized using Matplotlib, with node sizes proportional to the frequency of mentions and edge weights reflecting the strengths of co-occurrences.
2.2.3. Classification of media outlets by political leaning
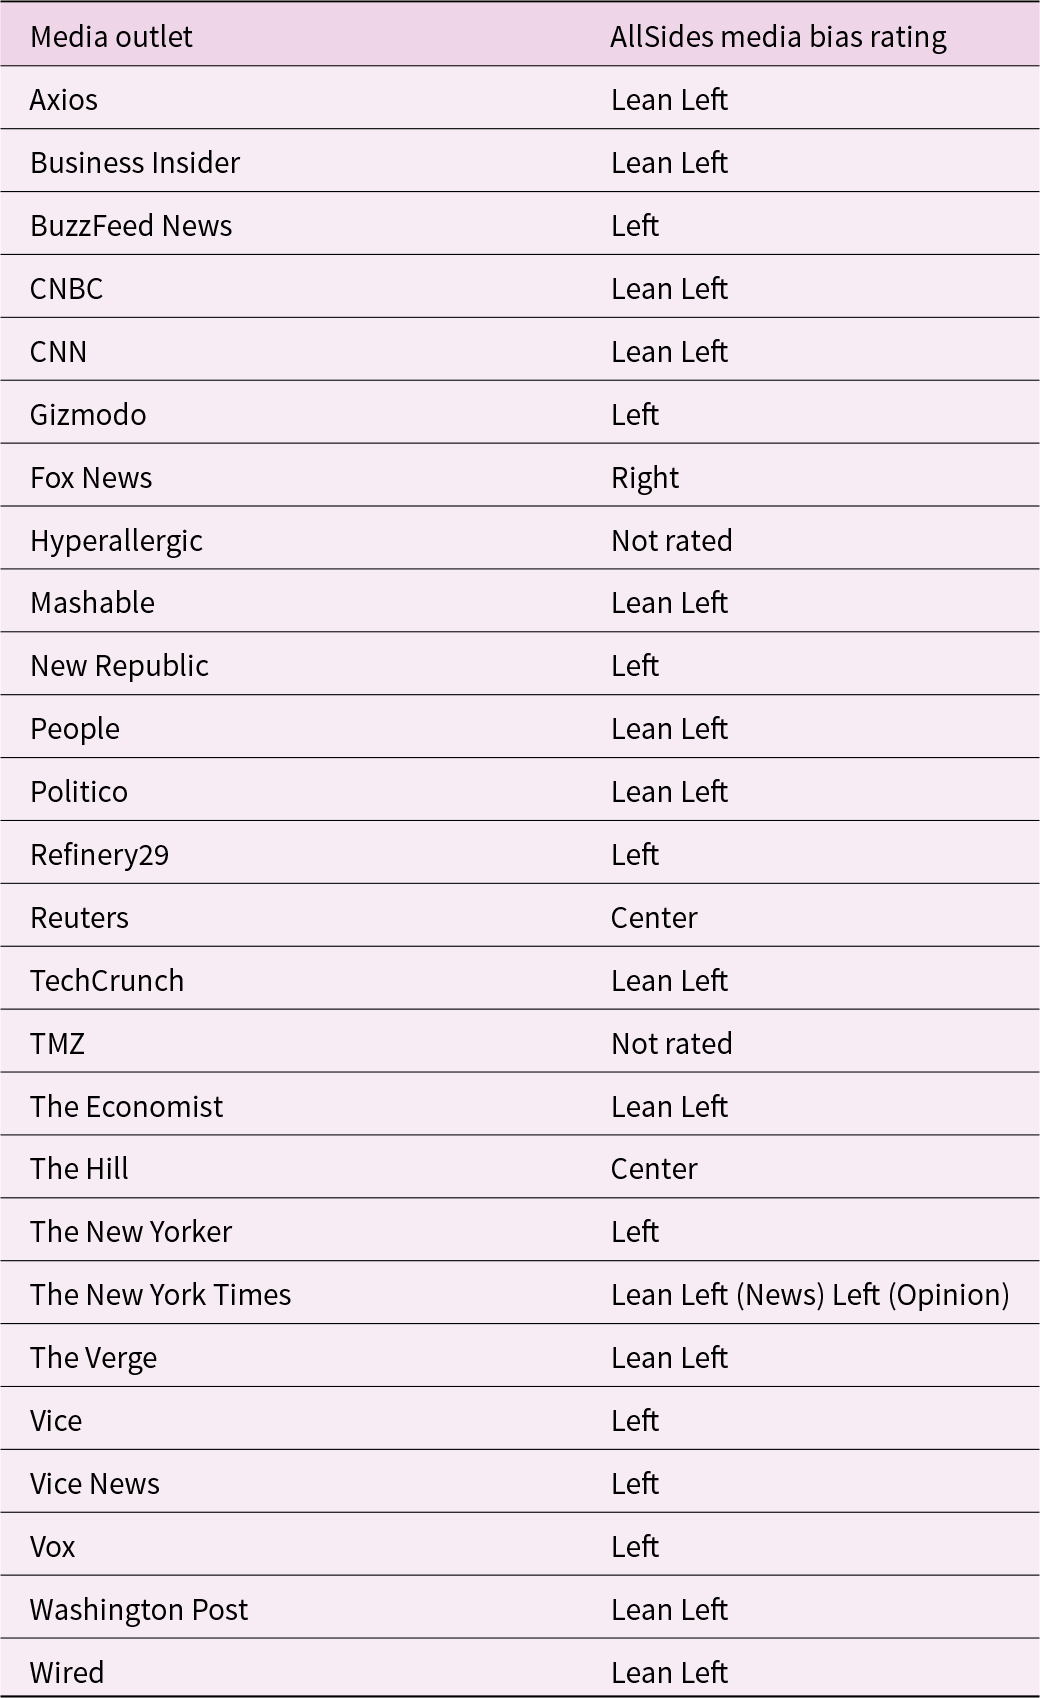
To analyze how the identified frames appeared across news outlets with different political leanings, we used the political leaning classification from AllSides (Mastrine et al., Reference Mastrine, Sowers and Alhariri2022). Previous academic research has used the AllSides classifications to develop an automated method of detecting media bias (D'Alonzo & Tegmark, Reference D'Alonzo and Tegmark2022) and to perform a systematic review of media bias detection (Rodrigo-Ginés et al., Reference Rodrigo-Ginés, Carrillo-de-albornoz and Plaza2024). The All the News 2.0 dataset includes the 26 news outlets shown in Table 3. Our sample described above includes 898 articles from 24 outlets (no articles meeting our search criteria were identified in Hyperallergic, an arts magazine, or TMZ, a celebrity news site). Of the 24 news outlets yielding articles for our study, 8 were classified by AllSides as Left, 13 as Lean Left, 2 as Center, and 1 as Right (Table 3). This indicates that the All the News 2.0 dataset heavily represents Left and Lean Left sources.
Media bias classification from AllSides (Mastrine et al., Reference Mastrine, Sowers and Alhariri2022) for the 26 outlets in All the News 2.0, 24 of which yielded articles for our study

Table 3 Long description
8 media outlets are classified by AllSides as Left, including Buzzfeed News, Gizmondo, New Republic, Refinery29, The New Yorker, Vice, Vice News, and Vox. 13 outlets are classified as Lean Left, including Axios, Business Insider, CNBC, CNN, Mashable, People, Politico, TechCrunch, The Economist, The New York Times, The Verge, Washington Post, Wired. 2 outlets are classified as Center, including Reuters and The Hill. Fox news is the only outlet in the dataset classified as Right.
3. Results
3.1. News media frames of aviation and climate change in the US, 2016–2020
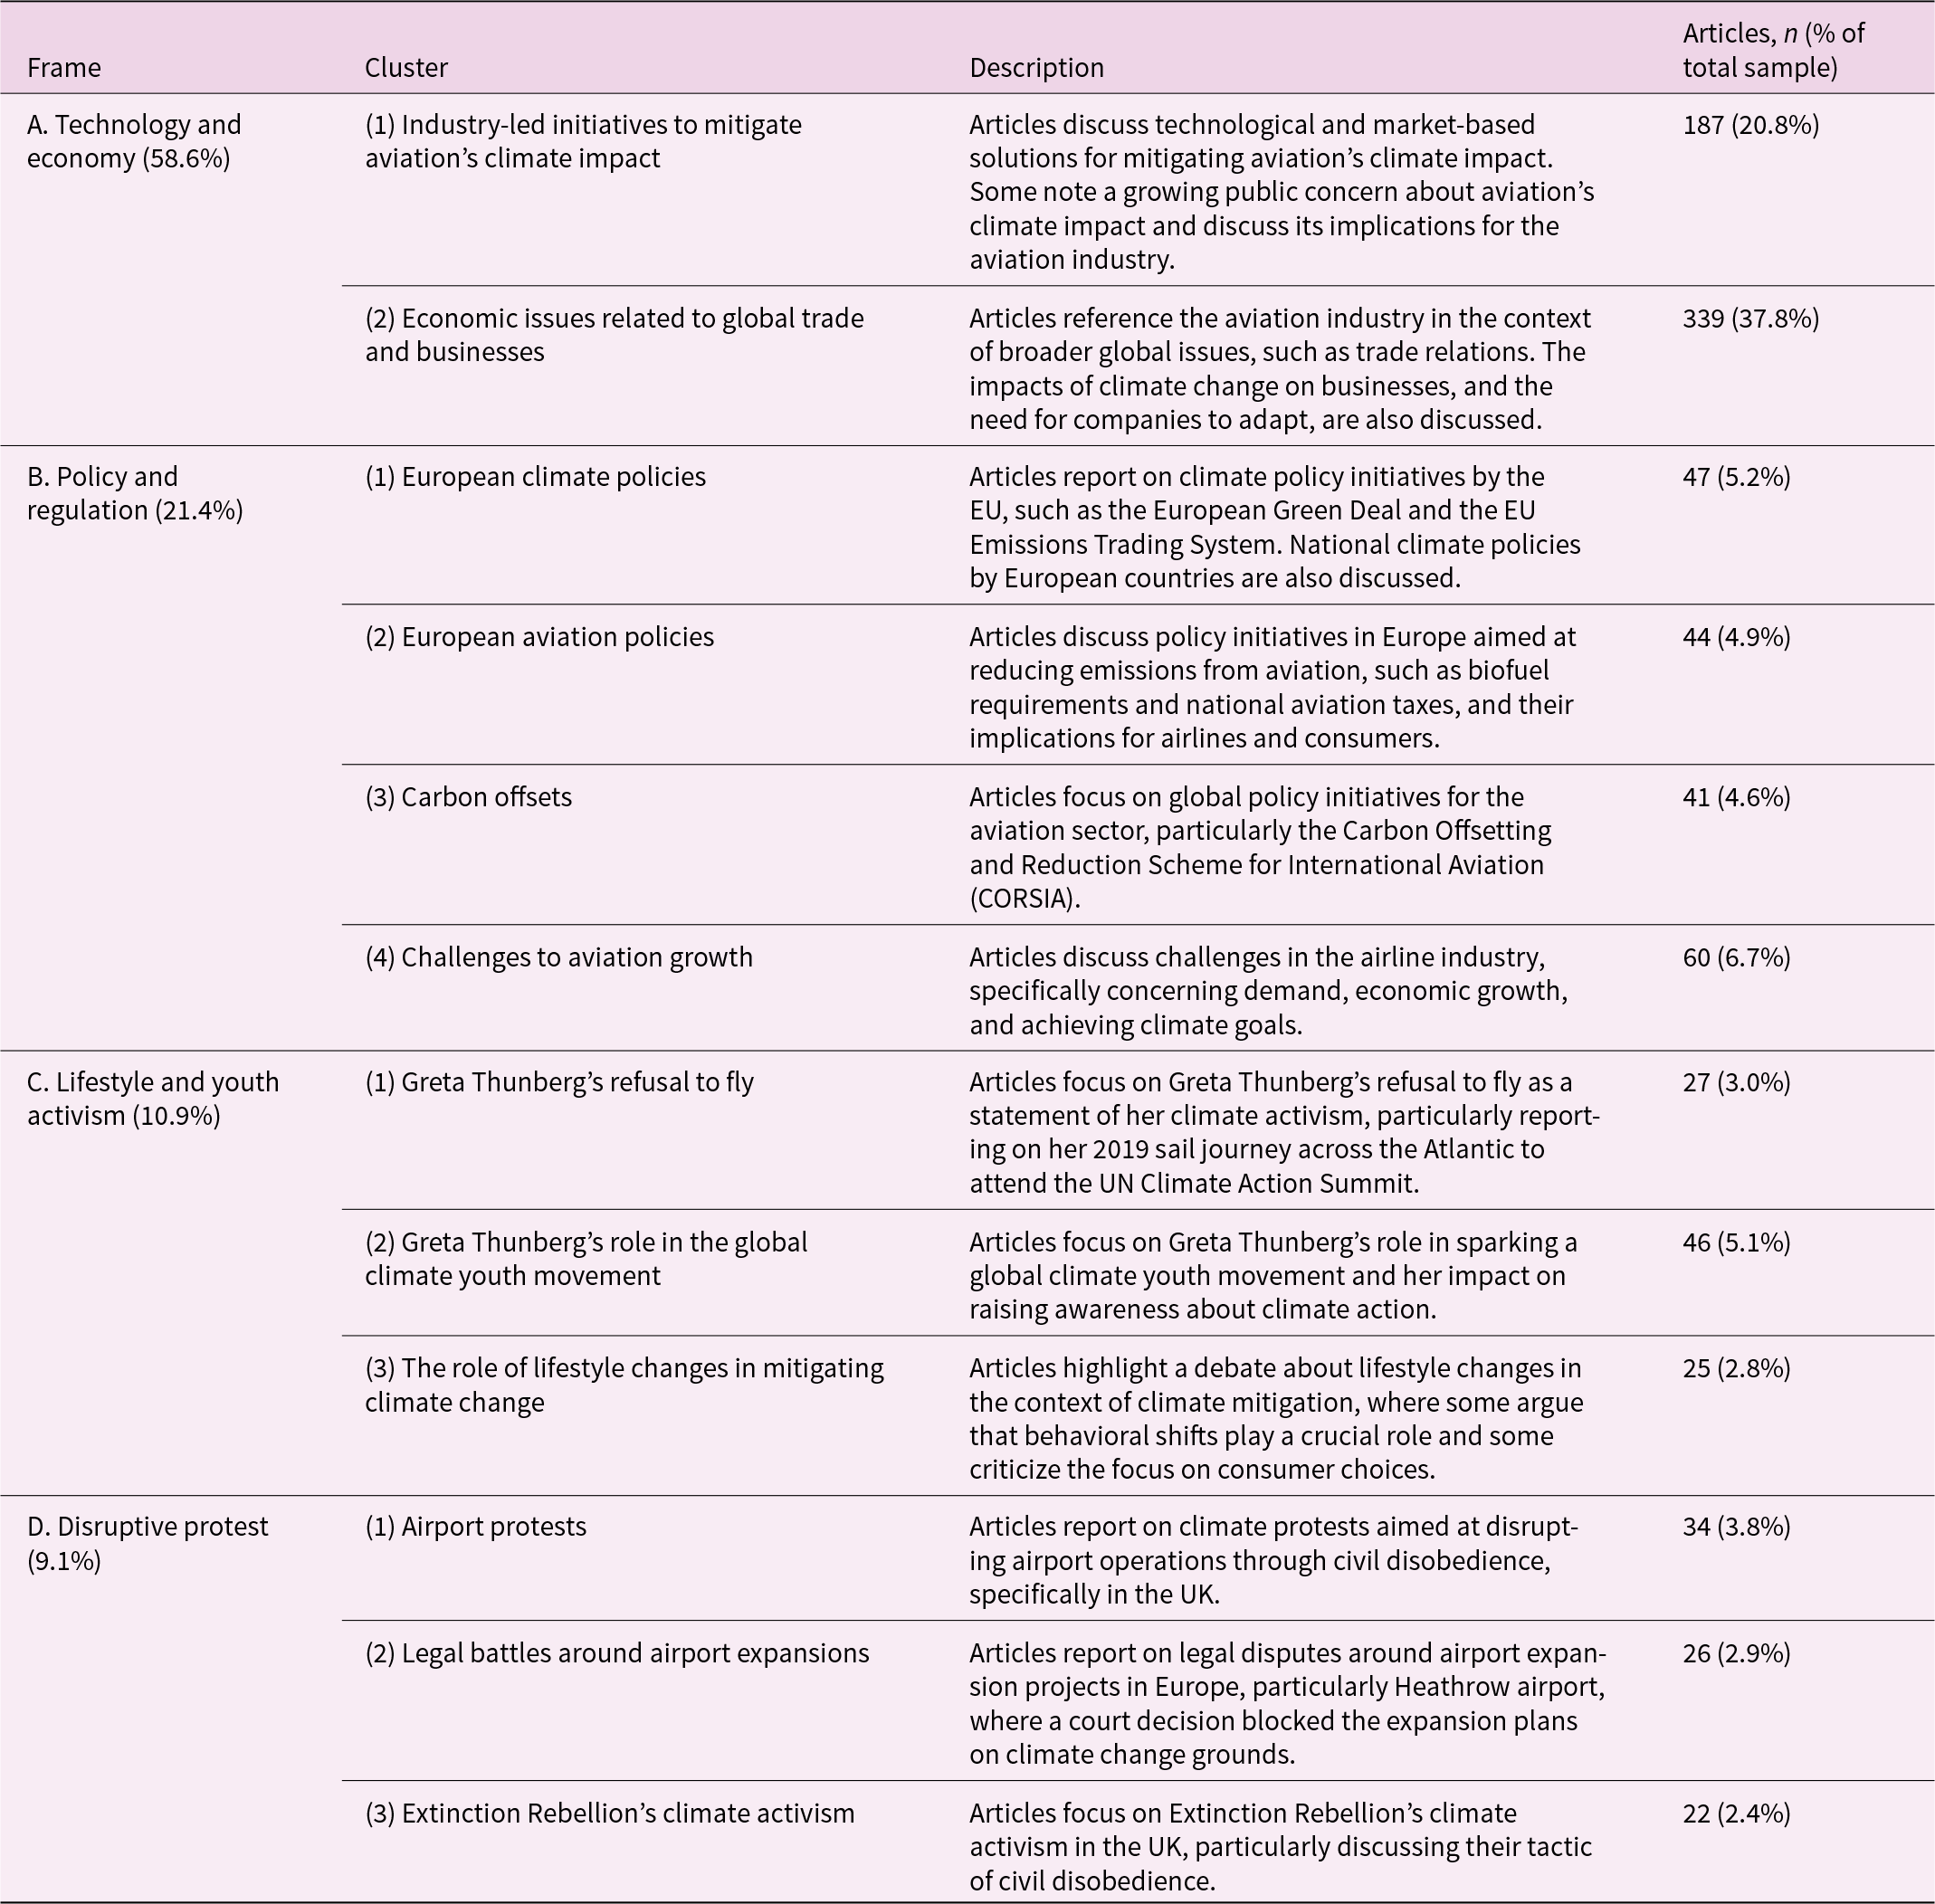
We identified four frames of aviation and climate change in US news media from 2016 to 2020. The Technology and economy frame focuses on technological and market-based solutions for mitigating the emissions from aviation, while also reporting on broader global issues and business news. It is the most dominant frame in the sample across all years, constituting 59% of the total number of articles (n = 526). The Policy and regulation frame highlights political measures for mitigating aviation's climate impact and makes up 21% (n = 192) of the sample. The Lifestyle and youth activism frame emphasizes lifestyle changes such as avoiding air travel, while also capturing the mobilization of a global climate youth movement led by Greta Thunberg, constituting 11% (n = 98) of the sample. The final frame, Disruptive protest, focuses on efforts to disrupt airport operations, challenge airport expansions, and use civil disobedience to highlight the urgency of the climate crisis, constituting 9% (n = 82) of the sample.
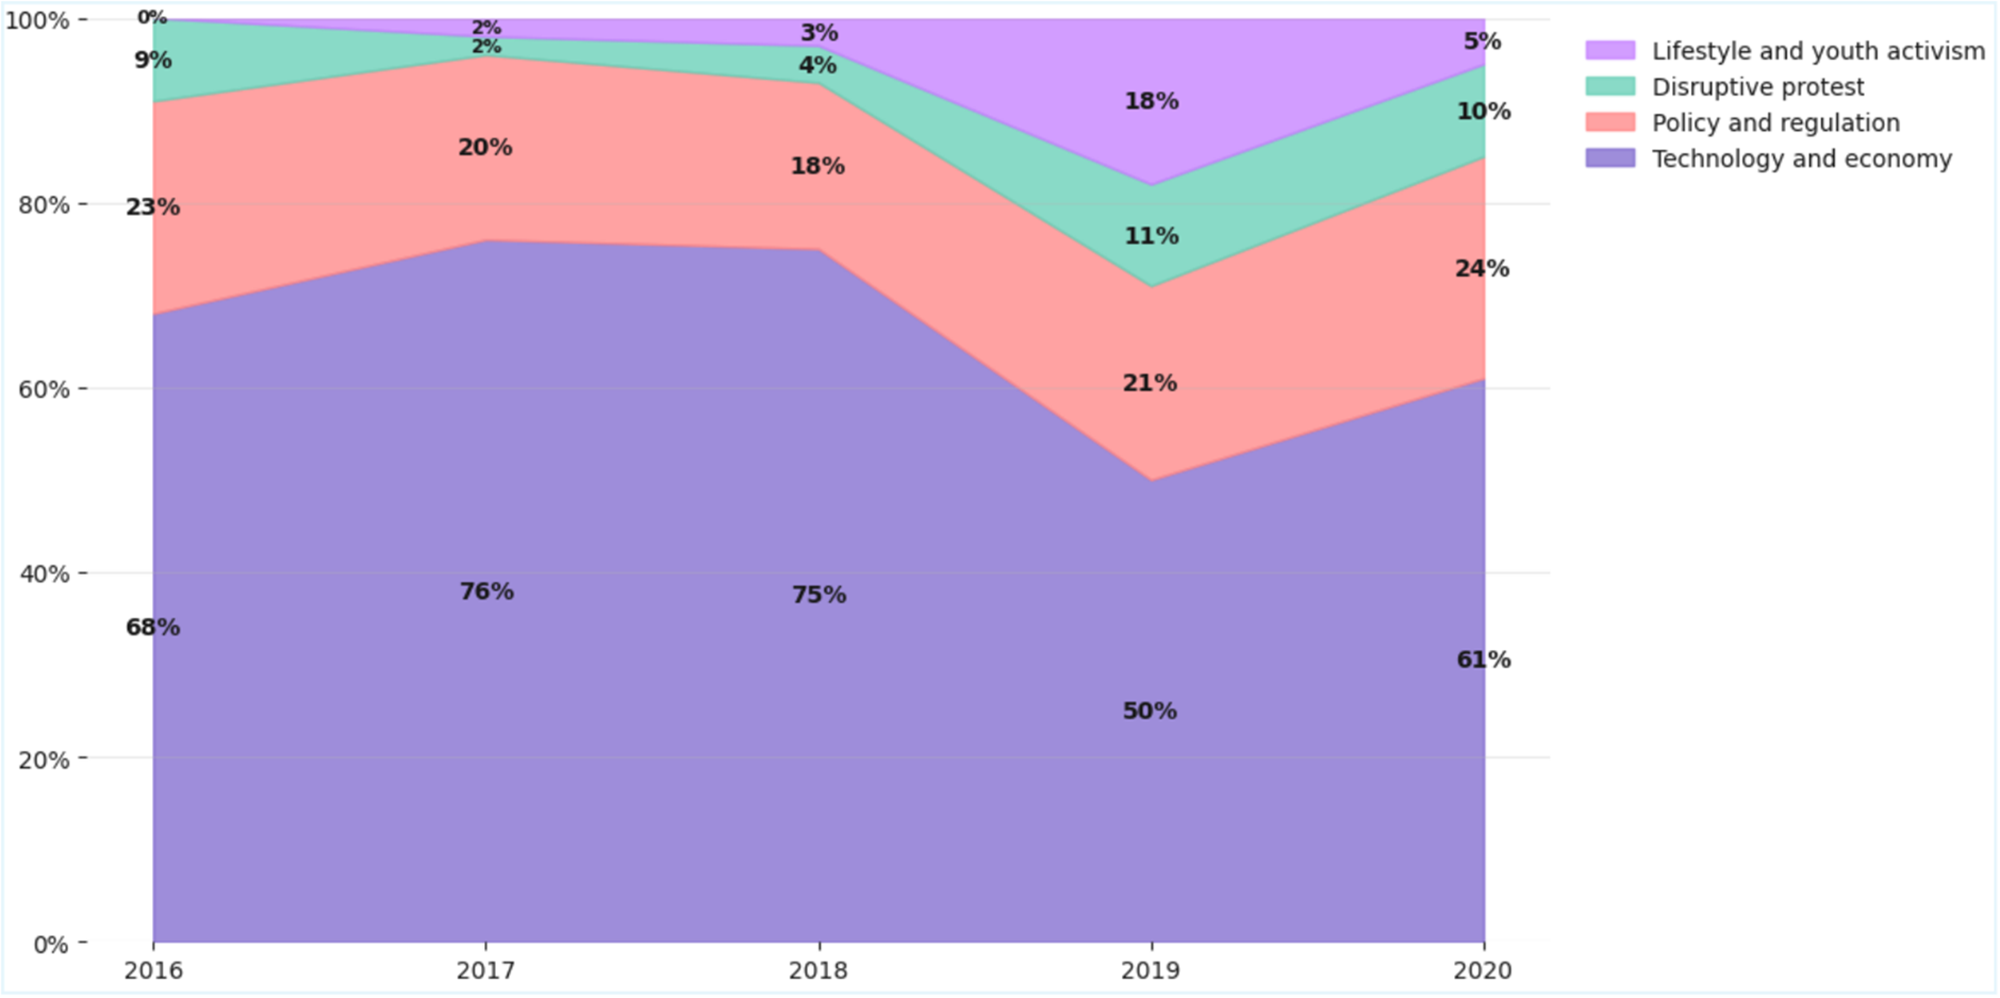
Figure 2 illustrates the development of these frames over the studied period. The year of 2019 stands out with a substantial increase of the Lifestyle and youth activism frame, rising from 3% of the total sample in 2018 to 18% in 2019. Disruptive protest and Policy and regulation also increased, from 4% to 11% and 18% to 21%, respectively. In contrast, the Technology and economy frame decreased from 75% to 50% in 2019.
Overview of the distribution of articles in our sample across the four frames, covering the period from January 1, 2016, to April 2, 2020.

Figure 2 Long description
The “Technology and Economy” frame made up 68% of articles in 2016, 76% in 2017, 75% in 2018, 50% in 2019, and 61% in 2020. The “Policy and Regulation” frame made up 23% of articles in 2016, 20% in 2017, 18% in 2018, 21% in 2019, and 24% in 2020. The Disruptive protest frame made up 9% of articles in 2016, 2% in 2017, 4% in 2018, 11% in 2019, and 10% in 2020. The “Lifestyle and youth activism” frame made up 0% of articles in 2016, 2% in 2017, 3% in 2018, 18% in 2019, and 5% in 2020.
For each of the four frames, we identified two to four clusters of articles. The clusters capture the main perspectives represented by a given frame (Table 4) and are described in detail in the sections below.
Overview of the four news media frames of aviation and climate change identified in our analysis of 898 US news articles (2016–2020)

Table 4 Long description
The “Technology and Economy” frame includes two clusters, one focusing on industry-led initiatives to mitigate aviation’s climate impact (20.8% of the sample) and one focusing on economic issues related to global trade and businesses (37.8% of the sample). The “Policy and Regulation” frame includes four clusters focusing on European climate policies (5.2% of the sample), European aviation policies (4.9% of the sample), carbon offsets (4.6% of the sample), and challenges to aviation growth (6.7% of the sample). The “Lifestyle and youth activism” frame includes three clusters focusing on Greta Thunberg’s refusal to fly (3.0% of the sample), her role in the global climate youth movement (5.1% of the sample), and the role of lifestyle changes in mitigating climate change (2.8% of the sample). The “Disruptive protest” frame includes three clusters focusing on airport protests (3.8% of the sample), legal battles around airport expansions (2.9% of the sample), and Extinction Rebellion's climate activism (2.4% of the sample).
3.1.1. Technology and economy
The Technology and economy frame, by far the most common frame used in nearly 60% of articles in our dataset, consists of two clusters of articles: one on industry efforts to reduce emissions and another focused on broader global issues. In the first cluster, articles report on aviation's climate impact and the sector's strategies for climate action, including technological advancements and market-based solutions. A common focus is airlines’ investments in new technologies to mitigate their carbon footprint while maintaining high demand. One article in Reuters reports: ‘Airbus said the industry could achieve its carbon-reduction goals even while meeting strong travel demand, because of new technology [sustainable biofuels]’ (Hepher, Reference Hepher2019). A few articles note that growing consumer awareness of aviation's climate impact drives the aviation industry to act, such as one Reuters article claiming that jet makers are ‘prioritizing fuel efficiency, and encouraging the use of sustainable fuels and carbon-offsets at a time when the aviation industry faces “flight shame” protests by climate change activists’ (Lampert, Reference Lampert2019b).
The second cluster, with nearly twice as many articles, focuses on economic issues related to global trade and businesses. Many of these articles are not exclusively about aviation, but reference the aviation industry within the context of broader global issues and geopolitical tensions, mainly between the US and China. Other articles focus on the impacts of climate change on private businesses and stress the need for companies, including airlines, to adopt sustainable practices in response, as illustrated by the following quote from a Reuters article: ‘Carbon-intensive sectors like steel, cement and airlines are grappling with the prospect of higher prices or even a tax on carbon, incentivizing a shift to cleaner energy’ (Currie & Thompson, Reference Currie and Thompson2019).
3.1.2. Policy and regulation
The Policy and regulation frame was used in over 20% of articles, roughly evenly divided between four clusters of articles: European climate policies, European aviation policies, carbon offsets, and challenges to aviation growth. The first cluster focuses on national climate policies by European countries, such as Germany's decision to introduce a climate package including ‘a new domestic carbon pricing scheme […] and surcharges on domestic flights’ (Reuters, 2019). Other articles discuss climate policy initiatives by the European Commission, such as the European Green Deal and the EU Emissions Trading System. For example, several articles report on a proposal by the Commission to phase out free carbon allowances for airlines. As noted in Reuters, this proposal was part of a broader effort to introduce ‘a new climate law to turn the bloc neutral in terms of carbon dioxide emissions by 2050’ (Guarascio, Reference Guarascio2019).
The second cluster focuses on aviation policies in Europe, such as flight taxes and biofuel requirements, and their economic implications for airlines and travelers. For example, one article in Business Insider reports on a new environmental tax on flight tickets in France. While the tax received support from environmental groups, the International Air Transport Association (IATA) criticized it, arguing that ‘instead of helping airlines invest in cleaner fuels and technology, it could end up harming the French aviation industry and jeopardize jobs’ (Business Insider, 2019). Another article states that Norway's mandate to blend in 0.5% biofuel could increase airline expenses and potentially lead to higher ticket prices, as noted by the CEO of Scandinavian Airlines (SAS), Rickard Gustafson, in an interview with CNBC: ‘some of the extra fuel costs may be added to fares’ (Karagiannopoulos, Reference Karagiannopoulos2019).
The third cluster focuses on the Carbon Offsetting and Reduction Scheme for International Aviation (CORSIA), a market-based mechanism adopted by the International Civil Aviation Organization (ICAO) in 2016 to stabilize emissions from international aviation. According to a Reuters article, CORSIA ‘is the first of its kind for a single industry in response to climate change’ (Lampert, Reference Lampert2019a). However, critics have argued that the deal underdelivers on climate goals, pointing to its reliance on carbon offsets rather than actual emissions reductions. As quoted in Reuters, Transport and Environment director Bill Hemmings stated, ‘Taking a plane is the fastest and cheapest way to fry the planet, and this deal won't reduce demand for jet fuel one drop’ (Lampert, Reference Lampert2016).
The fourth cluster focuses on challenges in the aviation industry, including issues related to achieving climate goals. One CNBC article states that the industry ‘lags its own climate goals’ (CNBC, 2018), with experts calling for stronger policies to accelerate sustainability efforts. At the same time, an article in The New York Times highlights how the Covid-19 pandemic complicated ‘efforts to tame airlines’ greenhouse gas emissions’ (Plumer & Tabuchi, Reference Plumer and Tabuchi2020), with airlines urging governments to delay climate policies due to financial constraints.
3.1.3. Lifestyle and youth activism
The Lifestyle and youth activism frame was used in about 11% of articles and consists of three clusters: Greta Thunberg's rejection of flying as a form of climate advocacy, her role as a catalyst for youth-led climate activism, and the role of lifestyle changes in mitigating climate change. The first cluster focuses on Greta Thunberg's refusal to fly as a statement of her climate activism, particularly her 2019 sail journey from Plymouth, UK, to New York, US, for the UN Climate Action Summit. One article in Mashable states: ‘Thunberg has chosen a rough, adventurous trip to New York City to avoid contributing unnecessary carbon dioxide emissions into Earth's atmosphere. It's an unmistakable statement made by a now prominent climate activist’ (Kaufman, Reference Kaufman2019). The sail journey not only highlighted Thunberg's commitment to climate action but also helped draw attention to a growing trend to avoid flying for climate reasons, as stated in The Verge: ‘Her trip accomplished more than getting her where she needed to be; it called attention to a growing movement of climate activists shunning aviation’ (Calma, Reference Calma2019).
The second cluster focuses on Greta Thunberg's role in the global climate youth movement and her influence on raising awareness about the climate crisis. The articles emphasize how her school strike in Sweden sparked a wave of student-led protests worldwide, turning her into a prominent figure for climate action. Thunberg's personal lifestyle choices are presented as extensions of her activism and ethical stance, as noted in a CNN article: ‘Thunberg lives by her ideals. She no longer travels by plane and she eats a vegan diet’ (Tutton, Reference Tutton2019).
The third cluster focuses on the role of lifestyle changes in mitigating climate change. Articles discuss the tensions between personal consumer choices, such as changing travel behaviors, and policy reforms. Some argue that lifestyle changes can catalyze broader societal shifts by highlighting the need for systemic change, as argued by psychology researchers Leor Hackel and Gregg Sparkman in Wired: ‘One person skipping a flight will not solve global warming alone, but when one person withdraws from a system that causes harm, they make that harm palpable to others’ (Hackel & Sparkman, Reference Hackel and Sparkman2018). However, others caution that an overemphasis on consumer choices distracts from the need for collective action and policy changes, as highlighted in an opinion piece by David Roberts, writer at Vox: ‘I have zero faith that the consumer choices of well-meaning greens will move us any faster’ (Roberts, Reference Roberts2017).
3.1.4. Disruptive protest
The Disruptive protest frame was used in about 9% of articles and consists of three clusters of articles, focusing on airport protests, their legal implications, and Extinction Rebellion's climate activism. In the first cluster, articles report on protests aimed at disrupting airport operations by global movements, such as Extinction Rebellion and Black Lives Matter, as well as local anti-airport expansion groups. For example, Black Lives Matter coordinated an action in 2016 where protesters chained themselves to each other on the runway at London City Airport ‘to highlight the UK's environmental impact on the lives of black people locally and globally’ (VICE, 2016). Extinction Rebellion has likewise planned and organized protests at airports in London, including a drone protest at Heathrow Airport, which sparked internal debate within the movement, as noted in Reuters: ‘Some volunteers believe that governments will only treat the climate crisis with sufficient urgency if faced with large-scale disruption […]. Others fear that disrupting air travel may alienate large numbers of people’ (Green, Reference Green2019).
The second cluster focuses on legal battles surrounding airport expansions in Europe, such as the planned building of a third runway at Heathrow Airport. One article in Reuters describes a protest action at the airport: ‘Protesters lay on the floor of Heathrow's Terminal 2, with many wearing white masks in a so-called die-in to highlight the impact of air travel on climate change and pollution levels’ (Reuters, 2016). While the building of the runway was initially supported by the British government and approved by the High Court in London, a court decision in 2020 blocked the expansion plans on climate change grounds after a lawsuit filed by environmental groups. As reported in Mashable: ‘the judges found the government's runway plan failed to consider how the added air traffic […] would impact the UK's commitment to slash its carbon emissions, as agreed to in the historic Paris climate accords’ (Kaufman, Reference Kaufman2020).
The third cluster focuses on Extinction Rebellion's climate activism in a broader context. Many articles report on airport protests as part of a wider trend of disruptive climate activism, particularly in the UK, where Extinction Rebellion has organized large-scale actions aimed to disrupt high-carbon infrastructure in protest of the government's inaction on climate change. An article in VICE states: ‘Protesters accuse the British government of providing subsidies for fossil fuels, financing massive fossil fuels projects overseas and approving airport expansion’ (Gilbert, Reference Gilbert2019). Several articles discuss the group's strategy of using radical but nonviolent tactics of civil disobedience, noting that public opinion has been divided. For example, an article in The New York Times highlights that although the group has ‘been largely tolerated in Britain’, members ‘continually debate whether actions should be undertaken that might risk alienating the public’ (Marshall, Reference Marshall2019).
3.2. Main actors and places in US news media frames of aviation and climate change, 2016–2020
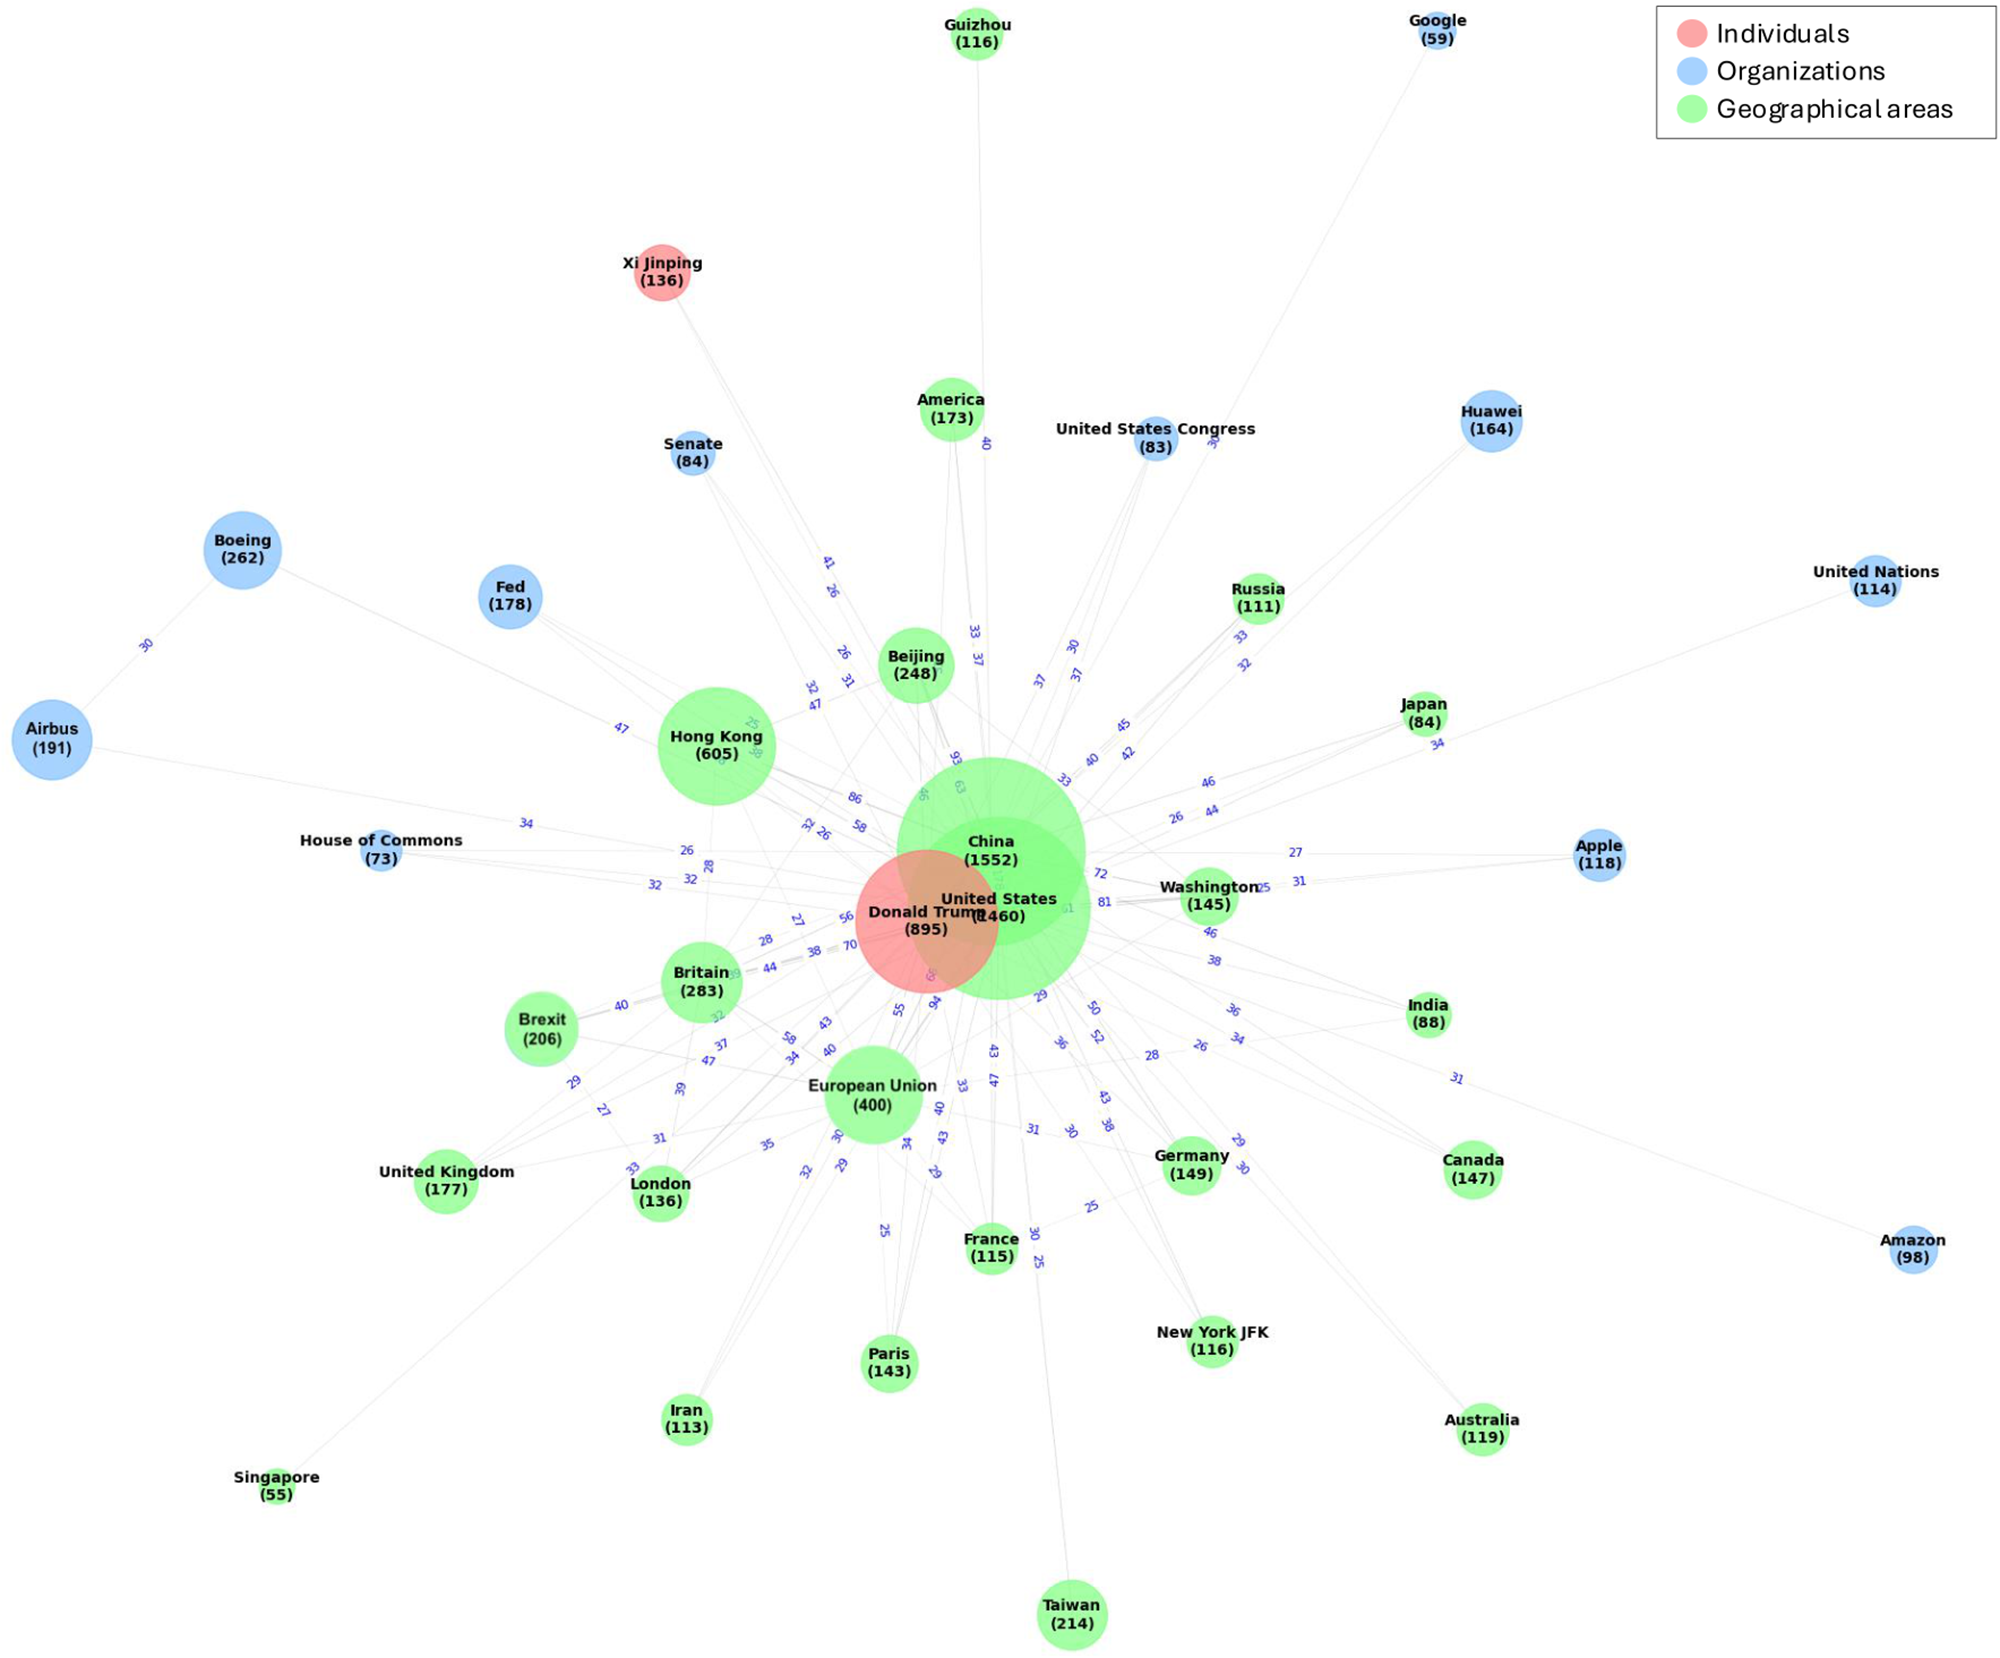
The US and China are central to the Technology and economy frame (Figure 3), reflecting these countries’ positions as major aviation markets. Their respective presidents (Donald Trump and Xi Jinping) are the most frequently mentioned individuals, underscoring the central role of government actors within this frame. References to global aviation companies, such as Boeing and Airbus, along with the Chinese technology firm Huawei, further illustrate the frame's emphasis on the aviation industry and technological innovation.
Key entities (individuals, organizations, geographical areas) in the Technology and economy frame. Circles represent entities, with their size corresponding to the frequency of mentions (the exact count is displayed inside each circle). Lines indicate connections between entities, with the accompanying numbers representing their co-occurrence.

Figure 3 Long description
A network graph illustrating connections between entities, including individuals, organizations and geographical areas. Circles represent entities, with size corresponding to mention frequency, and lines indicate co-occurrence. The central hub includes China, the US, and Donald Trump, with high mention counts of 1552, 1460, and 895 respectively. Another significant node is Xi Jinping with 136 mentions. The graph features a hub-and-spoke structure, dominated by a few central entities, suggesting their prominence in the network.
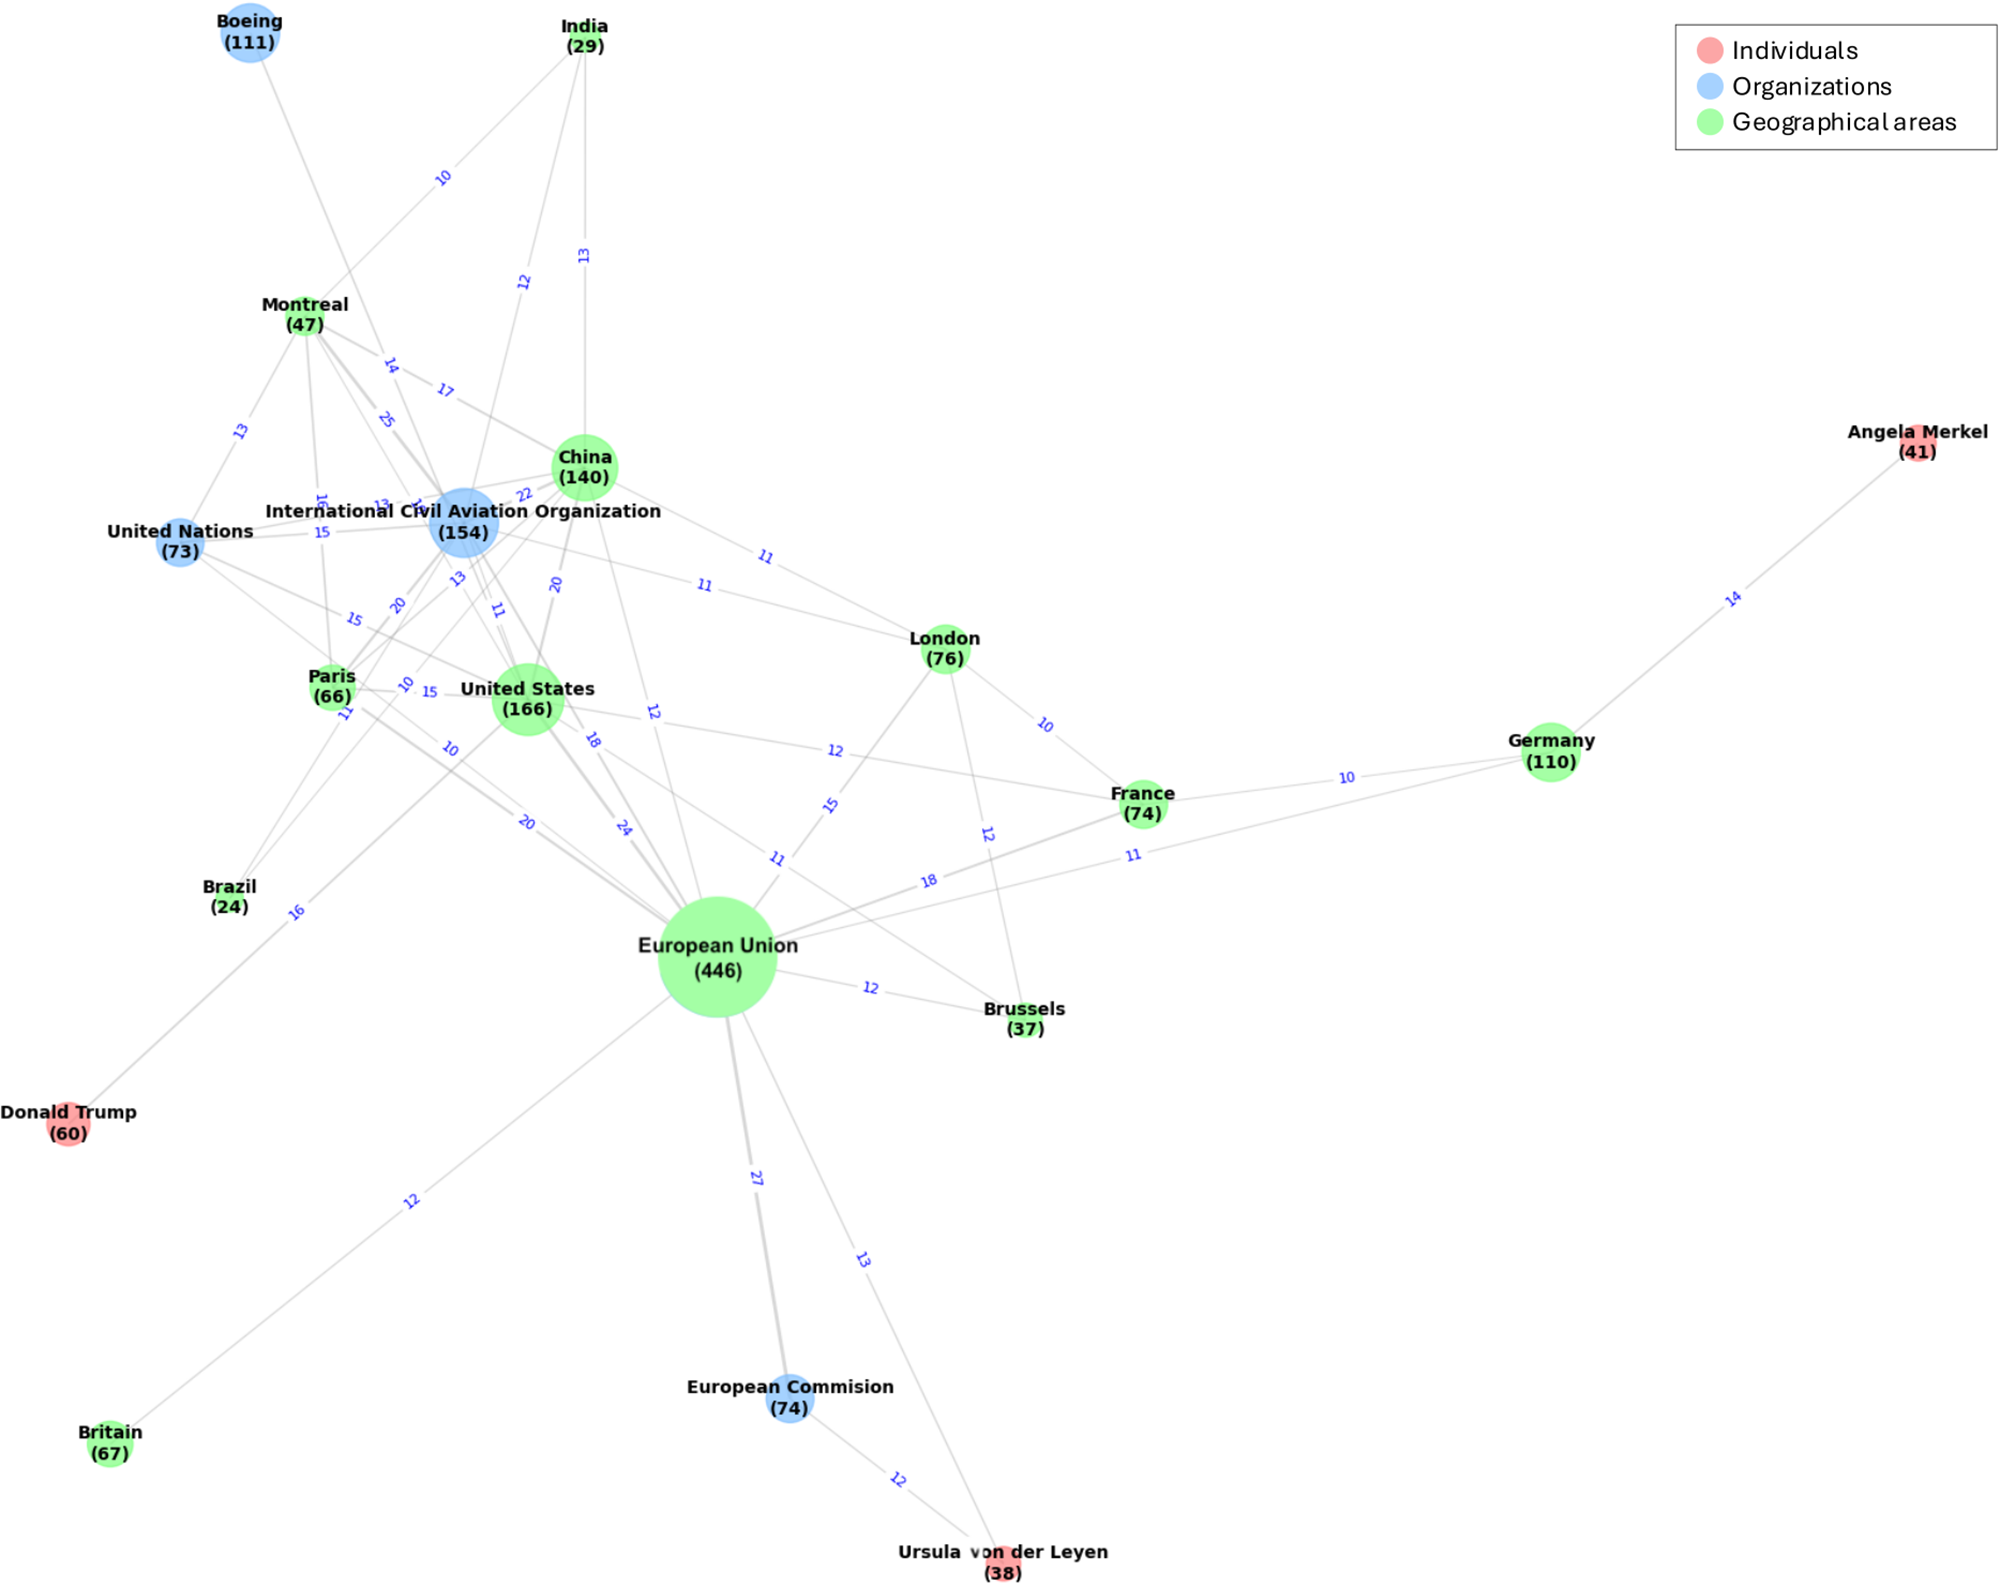
The Policy and regulation frame is heavily focused on the EU (Figure 4). The US is also prominent in this frame, often appearing in connection with the ICAO. The centrality of both the EU and the ICAO illustrates the frame's focus on aviation governance, although the pattern of co-occurrences points to geographical differences in policy approaches. Linkages between the US and the ICAO highlight the country's reliance on global mechanisms, such as CORSIA (the ICAO's carbon offsetting scheme for regulating aviation emissions), while connections between the EU and individual European countries (e.g., France, Germany) underscore that aviation emissions in Europe are governed both by EU-wide policies and additional national measures adopted by member states.
Key entities (individuals, organizations, geographical areas) in the Policy and regulation frame. Circles represent entities, with their size corresponding to the frequency of mentions (the exact count is displayed inside each circle). Lines indicate connections between entities, with the accompanying numbers representing their co-occurrence.

Figure 4 Long description
The diagram displays a network of entities categorized as individuals, organizations and geographical areas. Circles represent these entities, with their size indicating the frequency of mentions, shown as numbers inside each circle. Lines between circles indicate connections, with numbers representing co-occurrence counts. Key entities include the European Union, United States and International Civil Aviation Organization. Other entities like France, Germany, the European Commission, Angela Merkel, and Donald Trump are also prominent.
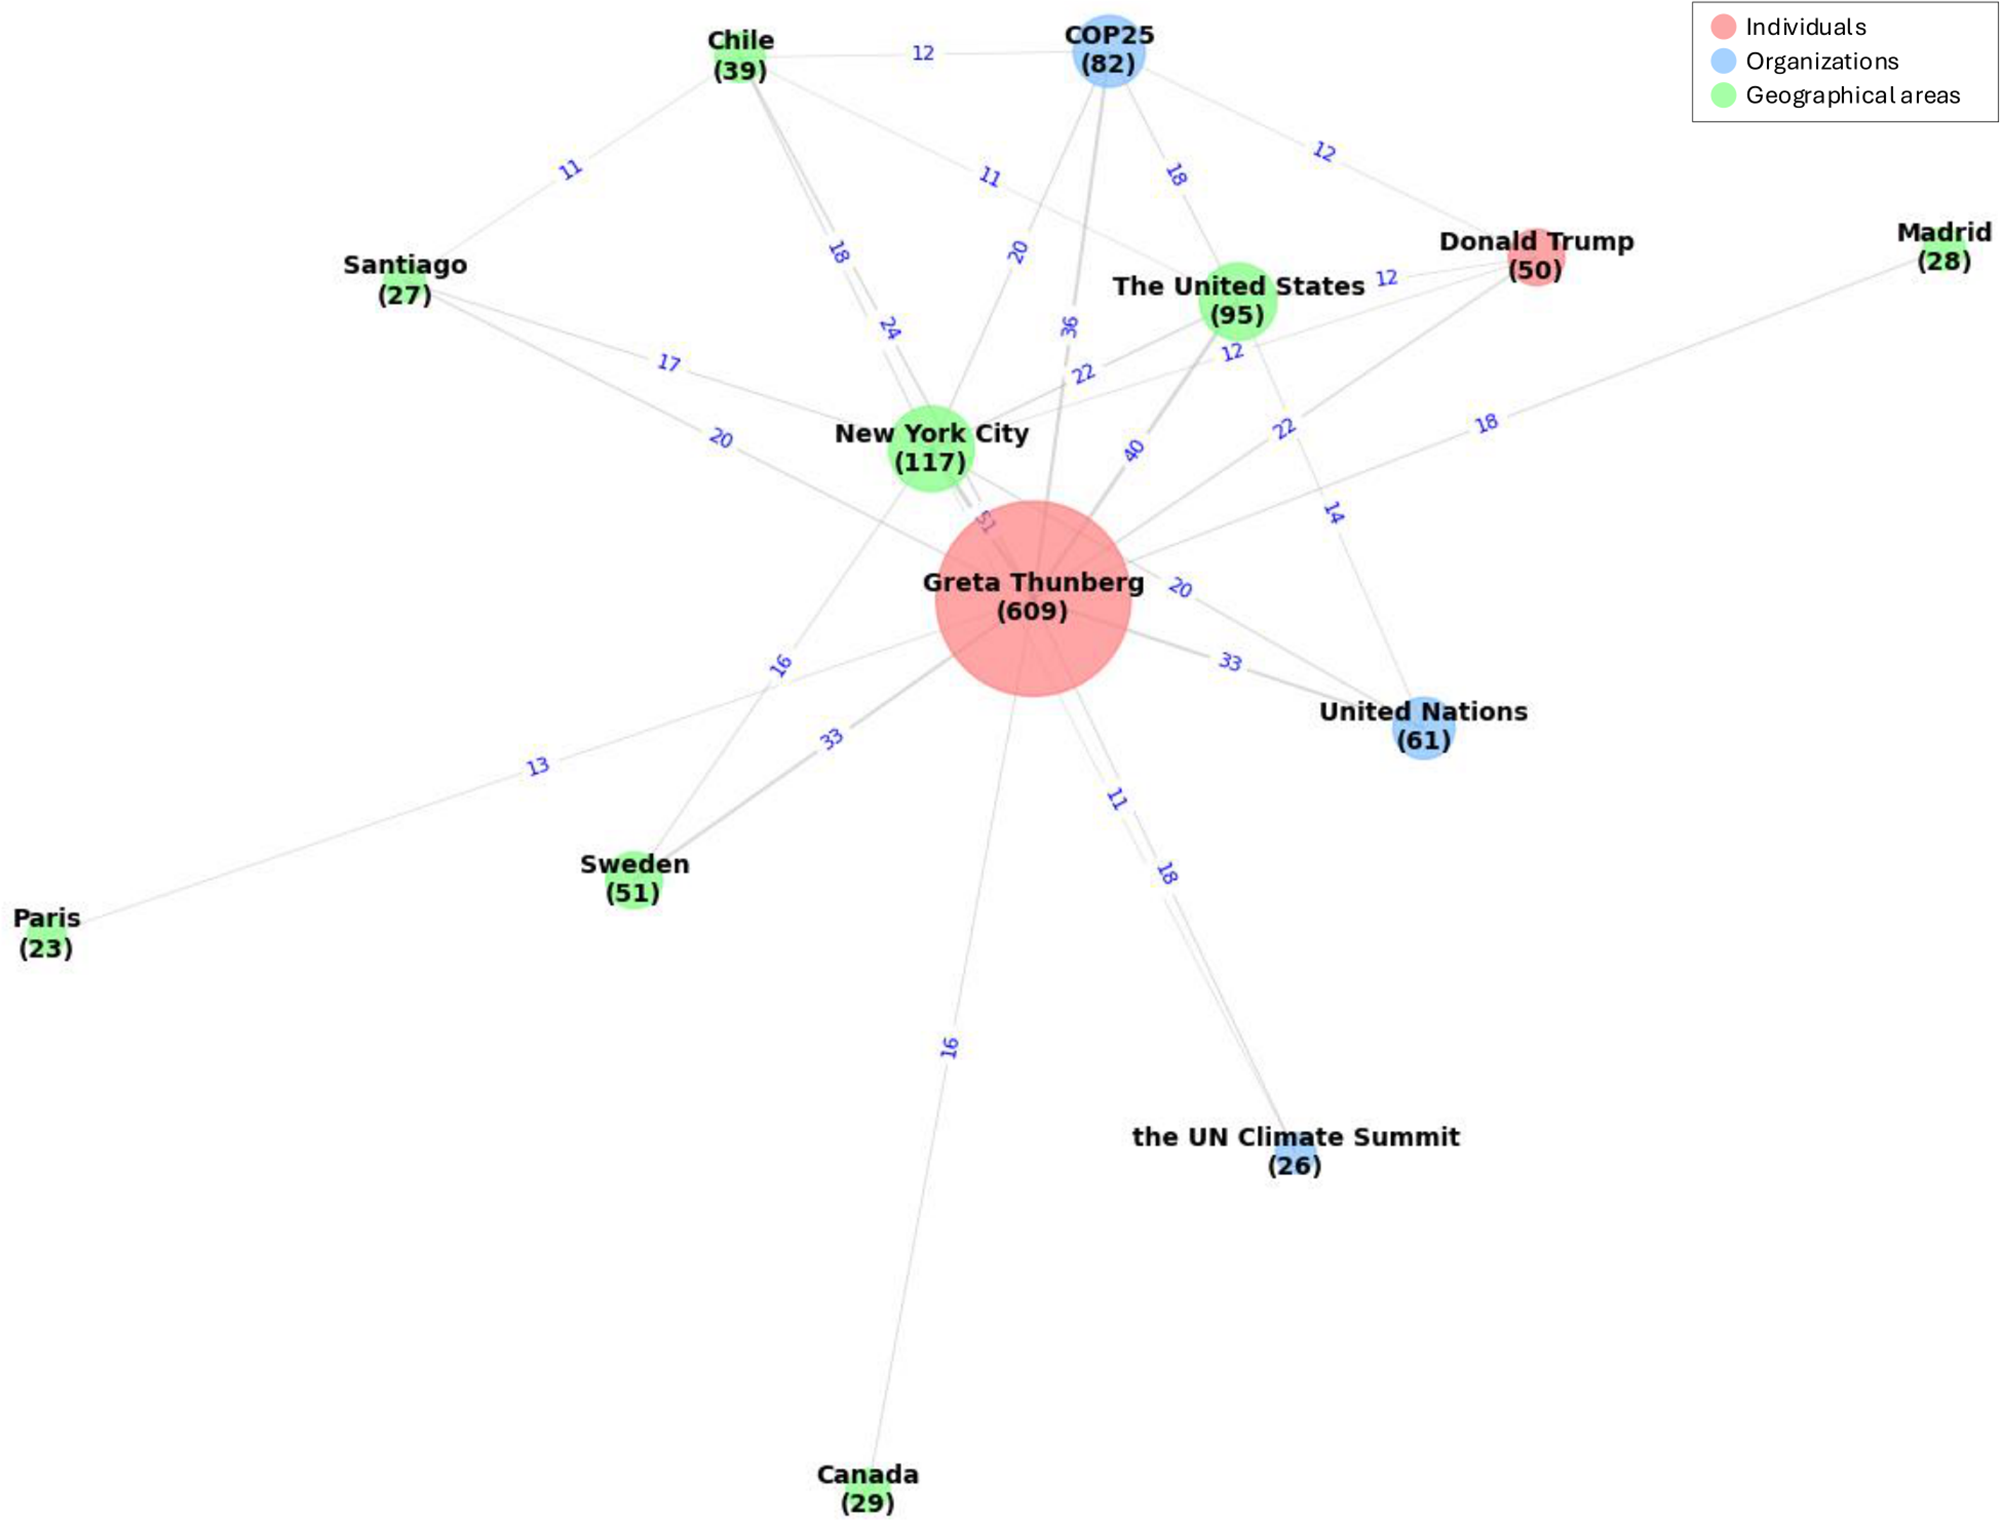
Greta Thunberg is by far the most prominent actor in the Lifestyle and youth activism frame, with over 600 mentions across 87 of the 98 articles analyzed (Figure 5). She is often mentioned in connection with COP25 and the UN Climate Summit, two climate events she sailed to in 2019 to demonstrate the importance of avoiding air travel, as well as the locations associated with these events (the US, New York, Chile, Santiago, Madrid). Sweden also emerges as a key location, reflecting how Thunberg's visibility situates her home country at the center of global debates about aviation and climate change, particularly in relation to behavioral changes and broader civic engagement.
Key entities (individuals, organizations, geographical areas) in the Lifestyle and youth activism frame. Circles represent entities, with their size corresponding to the frequency of mentions (the exact count is displayed inside each circle). Lines indicate connections between entities, with the accompanying numbers representing their co-occurrence.

Figure 5 Long description
The diagram displays a network with Greta Thunberg at the center, represented by a large circle with the number 609 inside, indicating mentions. Lines connect her to various entities, such as COP25 (82), Donald Trump (50), United Nations (61), the UN Climate Summit (26), New York City (117), Chile (39), Santiago (27), Madrid (28), Sweden (51), Paris (23) and Canada (29).
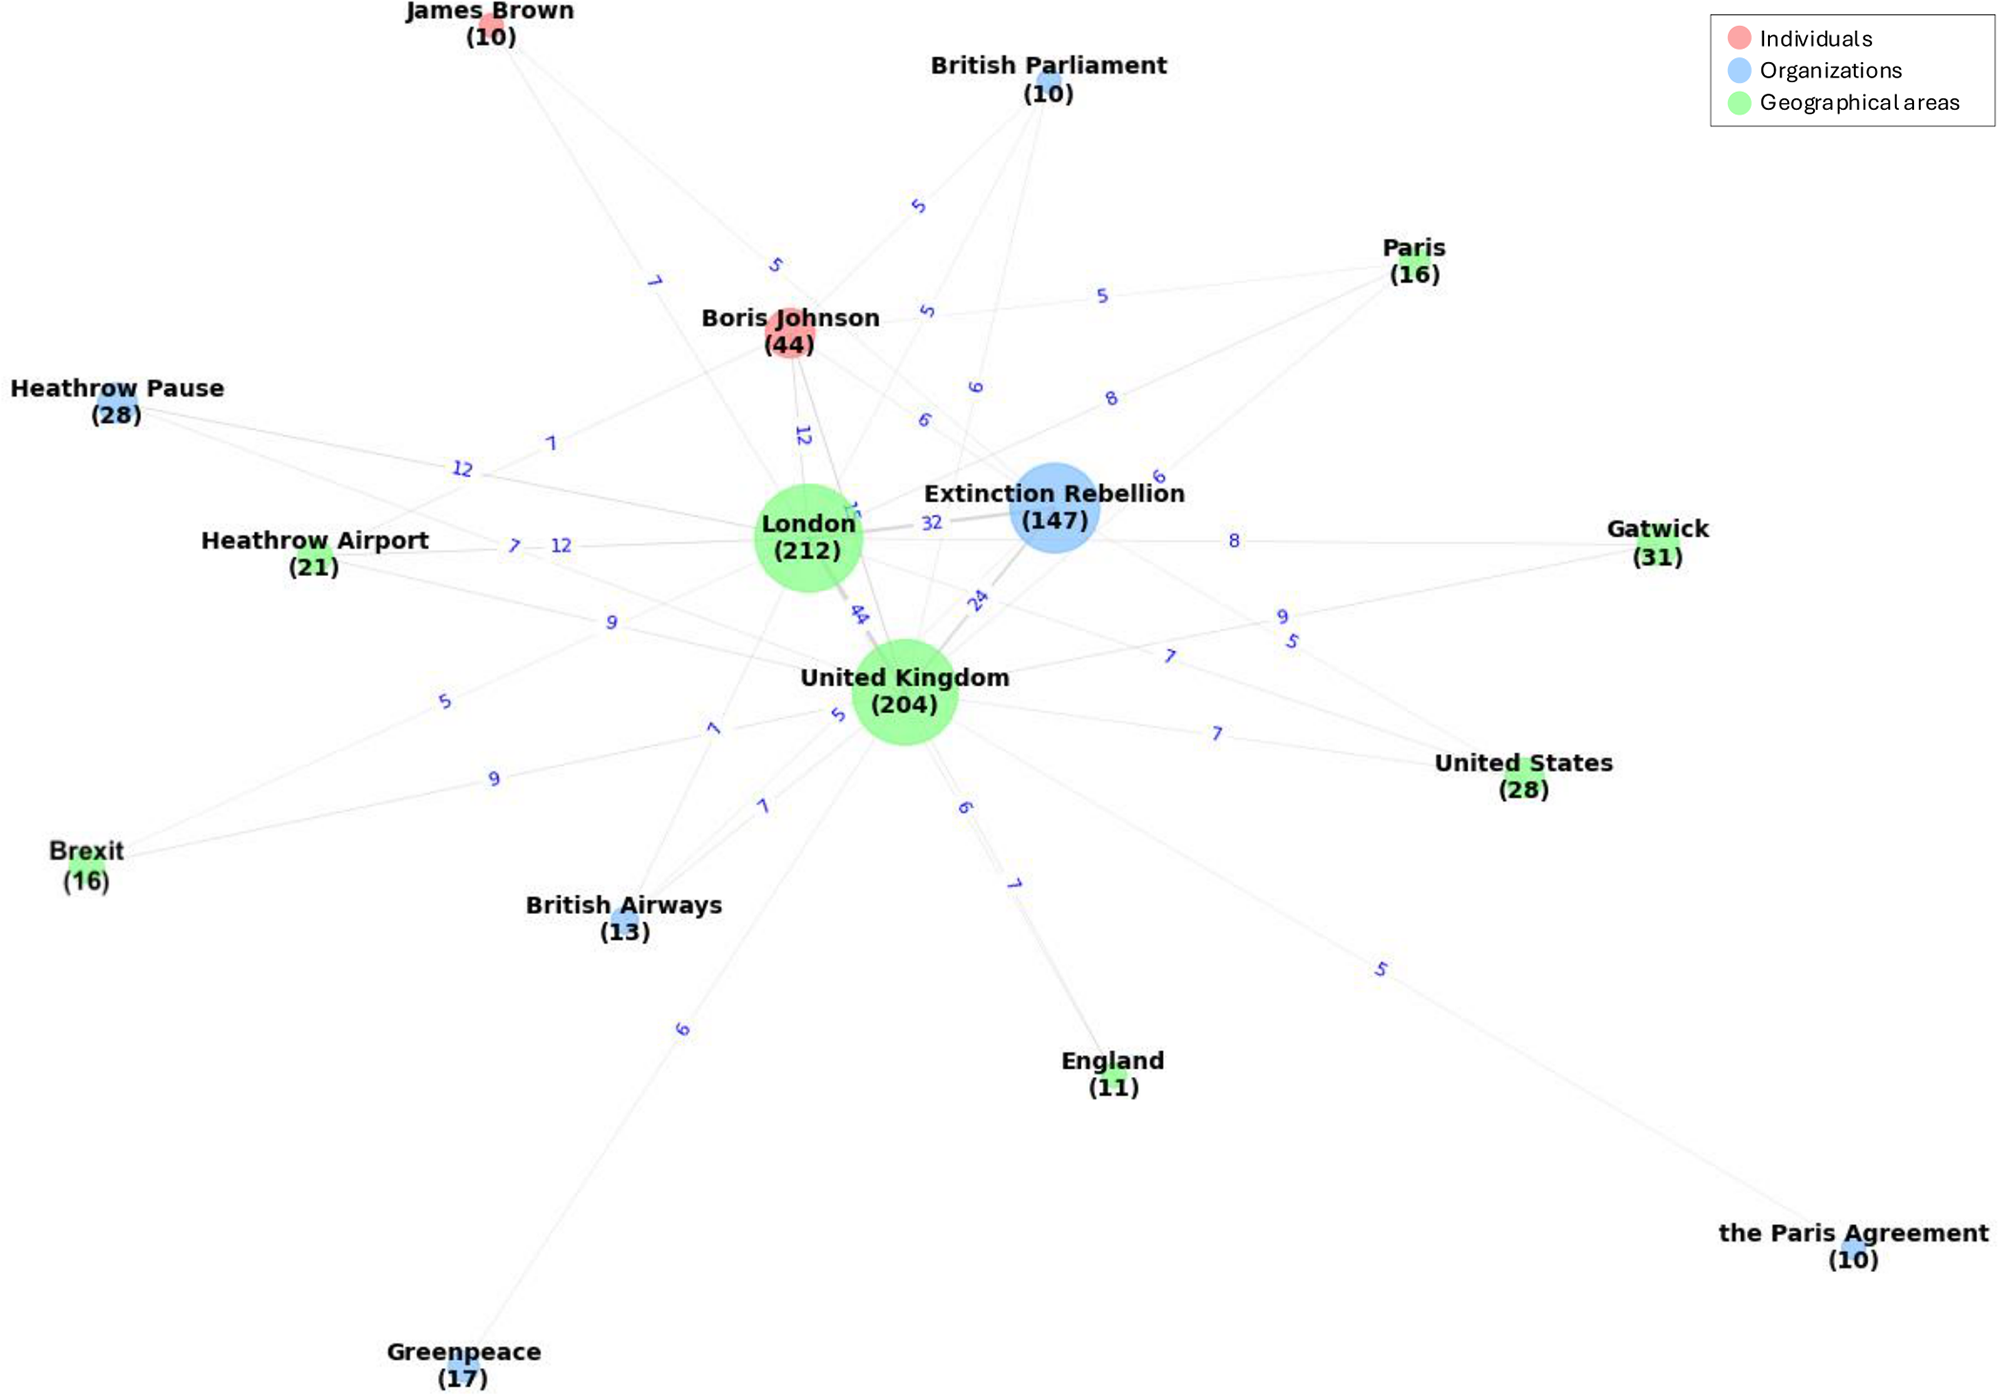
Extinction Rebellion is the most prominent actor in the Disruptive protest frame (Figure 6), reflecting its focus on climate activism oriented around civil disobedience. The pattern of co-occurrences highlights the movement's relationship to the UK, where it was founded and maintains its largest and most active base. References to London's two busiest airports, Heathrow and Gatwick, further draw attention to the UK as a key site of Extinction Rebellion's disruptive actions, illustrating how the movement targets the aviation industry to demand climate action.
Key entities (individuals, organizations, geographical areas) in the Disruptive protest frame. Circles represent entities, with their size corresponding to the frequency of mentions (the exact count is displayed inside each circle). Lines indicate connections between entities, with the accompanying numbers representing their co-occurrence.

Figure 6 Long description
The diagram displays a network of entities connected by lines, with circles representing individuals, organizations and geographical areas.. Extinction Rebellion is a central entity with 147 mentions. Key connections include London (212), United Kingdom (204), Gatwick (31), and Heathrow Airport (21). Other notable entities are Boris Johnson (44), Greenpeace (17), and Brexit (16).
3.3. Comparing news media frames of aviation and climate change across news outlets
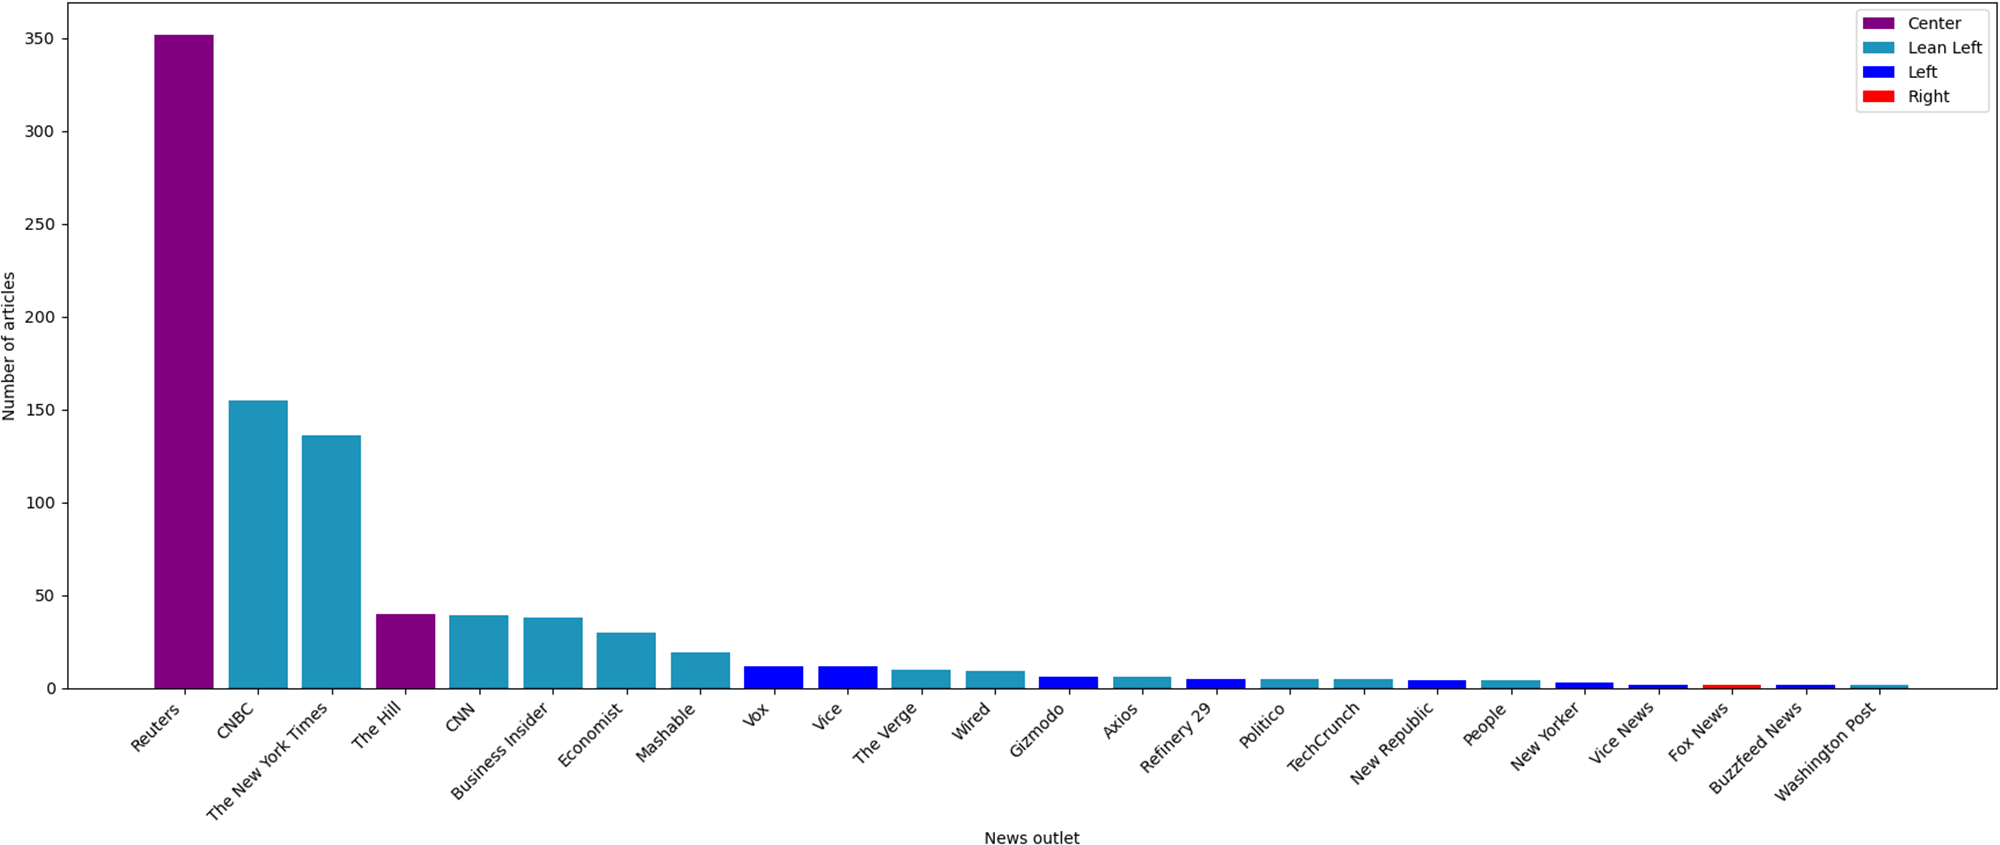
Over 70% of our dataset comes from three media sources: Reuters (about 40% of all articles analyzed), CNBC, and The New York Times (Figure 7). Reuters is classified as a Center outlet, while CNBC and The New York Times are Lean Left (Table 3). A second group of five outlets contributed a further 20% of articles analyzed: The Hill (Center) and four Lean Left outlets: CNN, Business Insider, The Economist, and Mashable. The remaining 16 sources, which were mostly Lean Left or Left but included the Right outlet Fox News, contributed 12 or fewer articles each. Overall, 45% of the dataset came from the two Center publications, while the remainder came from primarily Lean Left publications, with a minor contribution from Left and only a handful of articles from the Right (Figure 7).
The sources of the 898 news articles we analyzed, shown by the news outlet where they appeared. Media bias classifications are from AllSides (see Table 3).

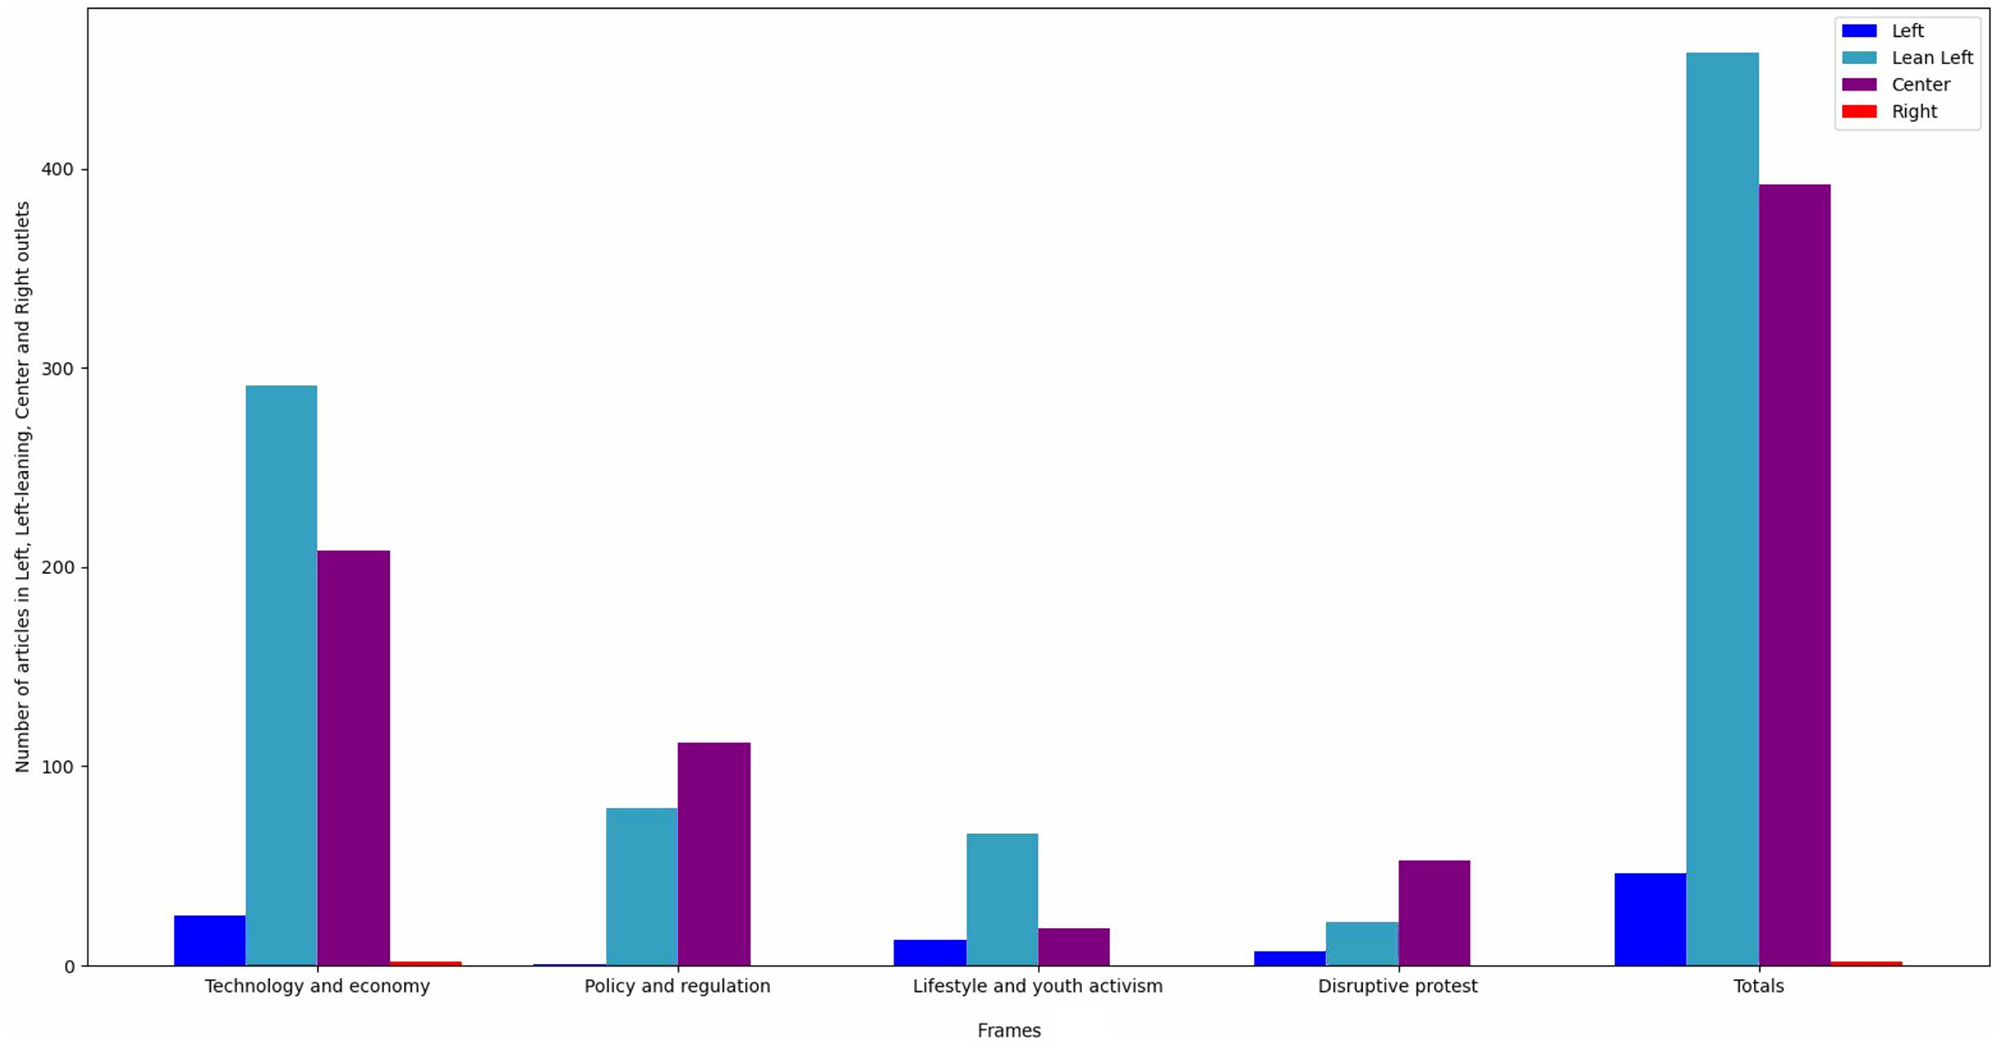
Two frames, Technology and economy and Lifestyle and youth activism, were more often reported on by Lean Left publications, while the other two frames, Policy and Regulation and Disruptive protest, were more commonly reported on by the two Center publications, Reuters and The Hill. The Lifestyle and youth activism frame was notably almost missing from Center articles and included the highest proportion of Left articles. The only Right articles appeared in the Technology and economy frame, reinforcing its mainstream position (Figure 8).
Distribution of media orientation across the four frames on aviation and climate change identified in this study.

4. Discussion
From our analysis of 898 articles collected from the All the news 2.0 dataset, we identified four frames on aviation and climate change in US news media, 2016–2020. The Technology and economy frame emerged as dominant, with almost 60% of articles reporting on the aviation industry from various perspectives (e.g., technological innovation, business news, geopolitics), primarily focusing on the US and China. The prominence of these countries reflects the frame's global focus and its industry-friendly orientation, emphasizing technological solutions to aviation's climate impact. The Policy and regulation frame made up around 20% of the sample. It largely centers on international and regional governance actors, including the ICAO and the EU, reflecting different policy approaches to aviation mitigation, such as carbon offsetting and national legislation (the latter primarily concerning EU member states). The Lifestyle and youth activism frame and the Disruptive protest frame each constituted approximately 10% of the sample, indicating that perspectives challenging aviation growth gained relatively little visibility. Nevertheless, the centrality of Greta Thunberg and Extinction Rebellion within these frames highlights Europe's role as a key region where aviation's climate impact is actively debated and contested.
The dominant Technology and economy frame legitimizes continued growth of aviation by emphasizing the industry's societal functions. This finding aligns with previous research employing a discursive approach to the study of aviation, which, similar to framing analysis, focuses on how meaning is constructed through language (e.g., Hajer, Reference Hajer1995). For example, Ullström et al. (Reference Ullström, Stripple and Nicholas2023) identified hypermobility as a dominant discourse on holiday air travel in Sweden and showed how this discourse normalizes frequent flying. Moreover, the aviation industry has a long history of reproducing a discourse about air travel as too societally important to be restricted (Gössling & Peeters, Reference Gössling and Peeters2007). Recent studies in Sweden have highlighted that this discourse persists, with actors in the aviation industry promoting technological innovations as solutions to aviation's climate impact, while remaining silent about demand management (Christley et al., Reference Christley, Karakaya and Urban2024; Christley & Ullström, Reference Christley and Ullström2025). While such solutions tend to gain attention in the media, they often end up as flawed promises of sustainable aviation, also referred to as ‘technology myths’ (Peeters et al., Reference Peeters, Higham, Kutzner, Cohen and Gössling2016).
Our analysis has shown that US news media predominantly reports on industry-led, technological solutions that allow unchallenged growth of aviation, thus reinforcing the industry's silence around demand management. Interestingly, a comparison of these findings with previous research examining how aviation's climate impact is discussed on Twitter suggests differences in how the issue is framed across mainstream and social media. While Twitter posts about aviation and climate change often focus on issues of fairness, including criticism of frequent flyers (Becken et al., Reference Becken, Stantic, Chen and Connolly2022), we did not identify any fairness frame in mainstream media. We did, however, identify frames that question aviation growth (Lifestyle and youth activism and Disruptive protest), but their limited coverage suggests that critical perspectives have been more prominently articulated on social media than in mainstream news media. While anyone can circulate content on social media, news media depends on access to authoritative sources such as industry and government actors, which might explain the closer alignment between news media frames and industry perspectives. This alignment is further illustrated by the presence of the Technology and economy frame across media outlets of all political leanings, including the only coverage from Right-leaning outlets in our sample.
In other countries, however, mainstream media has more prominently reported on demand management and activism in the context of aviation. Sweden is a notable example, where a discourse problematizing aviation growth and calling for reduced flying has gained rising traction in the news media since 2016 (Ullström et al., Reference Ullström, Stripple and Nicholas2023). This emphasis on reduced flying is reflected in the Lifestyle and youth activism frame identified in our study, which also highlights flying less as a solution to aviation's climate impact. Yet the limited visibility of this frame in US news media, where it appeared almost exclusively in Lean Left and Left outlets, suggests lower issue salience of aviation's climate impact, potentially due to stronger partisan divides in climate-related news coverage.
It is perhaps not surprising that the US media discourse on flying in the context of the climate crisis appears far behind the Swedish one. The US has an uneven history in engaging in domestic and international climate action across the last three decades, repeatedly abandoning or blocking progress at international climate negotiations, with the current administration having abandoned the UN climate negotiations, the Green Climate Fund, and rolling back climate regulations (Unger & Thielges, Reference Unger and Thielges2025). US climate policy has been characterized as focused on costs and the impacts of climate mitigation on economic growth of the American economy, and on emphasizing free markets over the role of the state (Del Bueno Rubial, Reference Del Bueno Rubial2021), which may help explain our finding that the Technology and economy frame was about three times more prevalent than Policy and regulation.
While we are confident that the four frames we identified accurately represent the US news media debate about aviation and climate change during the studied period, we acknowledge limitations in our analysis. First, we note that the publications in the All the News 2.0 dataset heavily represented Lean Left orientations, although the two Center publications produced a large number of articles for our analysis. Right publications were underrepresented, and very few relevant articles were identified there. Further research is needed to understand how Right-leaning media frames aviation in a climate context or to dive into specific news outlets and compare their framings on similar issues. Second, our analysis covers only the pre-pandemic period, which we argue represents a critical phase in public concern about aviation's climate impact. However, future research should explore how the news media debate about aviation and climate change has evolved since 2020. Such a research focus is important considering that global air travel demand returned to pre-pandemic levels in February 2024 (IATA, 2024) and is projected to increase by 3–4% yearly until 2050 (ICAO, 2021). Investigating how the frames we identified have developed alongside this resurgence of air travel could deepen the understanding of the role of news media in shaping public engagement with aviation-related climate action.
This research may contribute to bridging the gap between public understanding and scientific consensus on climate change in the US (see Tindall et al., Reference Tindall, Stoddart and Callison2018) by highlighting how news media coverage overwhelmingly emphasizes supply-side solutions to aviation's climate impact, despite scientific evidence indicating the necessity of demand-side changes (Bergero et al., Reference Bergero, Gosnell, Gielen, Kang, Bazilian and Davis2023; Creutzig et al., Reference Creutzig, Roy, Díaz-José, Geels, Grubler, Maϊzi, Masanet, Mulugetta, Onyige, Perkins, Sanches-Pereira and Weber2022; Grewe et al., Reference Grewe, Gangoli Rao, Grönstedt, Xisto, Linke, Melkert, Middel, Ohlenforst, Blakey, Christie, Matthes and Dahlmann2021; Klöwer et al., Reference Klöwer, Allen, Lee, Proud, Gallagher and Skowron2021). Previous research has suggested that an annual reduction in air travel demand of 2.5% between 2024 and 2050 can halt aviation's contribution to further global warming (Klöwer et al., Reference Klöwer, Allen, Lee, Proud, Gallagher and Skowron2021). Such reductions could be supported by policy measures targeting air travel demand, including passenger aviation taxes or caps on the number of flights (Gössling & Lyle, Reference Gössling and Lyle2021), as well as measures to decrease subsidies and cultural support for aviation, such as The Hague's recent ban of fossil fuel products in public places (Bouman et al., Reference Bouman, Bolderdijk and Smith2025). Yet such measures are paid little attention in aviation policies, which largely favor technological fixes and market-based solutions (Suomalainen, Reference Suomalainen2025). Accurate and comprehensive news media coverage of aviation's climate impact, including the critical need for demand-side solutions, is likely to play a key role in fostering public awareness and support for demand-oriented policy initiatives as part of necessary transformations to meet climate goals.
Supplementary material
The supplementary material for this article can be found at https://doi.org/10.1017/sus.2026.10069.
Acknowledgements
We acknowledge the use of ChatGPT-4 and Gemini 1.5 as AI tools to assist with analyzing article clusters. These tools were used in October 2024, and their outputs supported but did not replace manual qualitative analysis.
Author contributions
S.U.: conceptualization, formal analysis, investigation, writing – original draft, writing – review & editing. C.O.R.: methodology, data curation, formal analysis, visualization, writing – original draft, writing – review & editing. W.v.D.: conceptualization, writing – review & editing. S.R.: methodology, formal analysis, visualization, writing – review & editing. K.A.N.: conceptualization, formal analysis, supervision, writing – original draft, writing – review & editing.
Funding statement
This research was supported by the Swedish Research Council for Sustainable Development Formas (S.U., K.A.N., grant number 2018-01190) and the University of Amsterdam Data Science Centre (C.O.R.).
Competing interests
The authors declare no conflicts of interest.
Data availability
The media articles for this study were obtained from the publicly available All the News 2.0 dataset. The dataset used for analysis (a sample of 898 articles) is available from the corresponding author upon reasonable request.


 Open access

