1. Introduction
Nowadays, consumer credit plays a crucial role in banks’ and households’ financial decisions. On the one hand, lenders have the role of efficiently transferring resources from savers to borrowers; on the other, households use consumer credit to buy goods and services, adapting the timing of their savings and the flow of their consumption to a preferred pattern. The determinants of consumer credit have been widely analysed since the 1990s from both a theoretical and an empirical perspective (see Bertola et al. Reference Bertola, Disney and Grant2006; Vandone Reference Vandone2009; Durkin et al. Reference Durkin, Elliehausen, Staten and Zywicki2014 for comprehensive reviews of the literature’s findings).
Since 2015, consumer credit has been increasing at a remarkable pace in the euro area. Are there any differences across countries? What are the dynamics of demand and supply factors typically connected with consumer credit? Is the growth in debt associated with a building up of financial risks? This article attempts to answer these questions by presenting a corpus of evidence on the recent trends in consumer credit in the main euro area countries. Deep insights into the consumer credit market before the COVID-19 crisis are critical to assess the ability of the system to counteract an economic downturn.
We focus on the four largest national economies in the euro area, namely France, Germany, Italy and Spain, as the expansion of consumer loans in these countries has a large impact on the dynamics of the credit in the euro area. Moreover, given the interconnectedness of financial intermediaries, risks in one of these countries could have sizeable effects on the others within the area. We exploit both macroeconomic and bank data to get insights on financial stability risks (from a financial intermediary’s perspective) and microeconomic survey data to evaluate the heterogeneity in households’ ability to meet their payments.
During 2018, the annual growth rate exceeded 7% and was very similar to that observed in 2005–2006, before the financial crisis. This rapid expansion was common to the main euro area countries and has been associated with stronger credit demand, specifically for consumer durable expenditure. Supply conditions became more relaxed only in Italy and Spain, where credit tightening was far stronger during the past crises. In these two countries, where interest rates are higher than in other euro area countries, banks also increased the share of consumer loans granted to the private sector. Risks stemming from consumer credit expansion are nevertheless mitigated by its lower incidence, compared with mortgages, on households’ total debt and disposable income. Exposure to interest rate risk is also decreasing thanks to a larger share of fixed-rate contracts. The risk heterogeneity remains wide across countries, with Italy and Spain ranking as those with the highest share of delinquencies, even for fewer than 90 days, according to the European Union Statistics on Income and Living Conditions (EU-SILC) data.
After showing evidence for the main euro area countries, we further investigate consumer credit in Italy. Employing a cointegration analysis, we point out that both interest rates and durable consumption are at the heart of consumer loan dynamics. In Italy, financial risks associated with the recent expansion are limited: consumer credit has increased fast mainly among banks with better asset quality and is held by affluent households better able to service their debts; these circumstances contributed to the reduction in the new non-performing consumer loan ratio. For the deeper analysis, we concentrate uniquely on Italy, because it is the country for which we have access to a larger amount of data and information and we can delve into both demand and supply conditions. Nevertheless, a similar exercise to the one presented here could also be done for the other countries, allowing for comparisons and drawing wider or more general conclusions. Italy is thus just an example or a piece of a bigger picture that could be completed by researchers having access to all necessary data and information.
Consumer credit has been systematically analysed in the literature, exploiting both macroeconomic and microeconomic data. The increase in household debt is indeed not a new phenomenon. Christen and Morgan (Reference Christen and Morgan2005) showed that for the United States, the ratio of household debt to disposable income increased from 60% in 1980 to 104% at the end of 2003. They focus on why consumers have assumed so much more debt and financial risk over the period. A number of explanations have been proposed, including rising household wealth (e.g. Maki and Palumbo Reference Maki and Palumbo2001) and increased credit supply (e.g. Debelle Reference Debelle2004). Determinants of households’ participation in the credit market – considering both the role of demand and supply – have also been the object of several studies highlighting the role of socio-economic factors, age, education, income, financial education, presence of informal credit, and institutional factors (see Gropp et al. Reference Gropp, Scholz and White1997; Magri Reference Magri2002, Reference Magri2007; Fabbri and Padula Reference Fabbri and Padula2004; Del Rio and Young 2005; Crook Reference Crook2006; Grant and Padula Reference Grant and Padula2006; Casolaro et al. Reference Casolaro, Gambacorta, Guiso, Bertola, Disney and Grant2006; Jappelli and Pagano Reference Jappelli and Pagano2006; Duygan-Bump and Grant Reference Duygan-Bump and Grant2009, among others). Cross-country differences in debt holdings have been linked to household characteristics (age, education, income, etc.) and their interaction with different economic environments (e.g. Christelis et al. Reference Christelis, Ehrmann and Georgarakos2020; Porta et al. Reference Porta, Lopez-de-Silanes, Shleifer and Vishny1998).
There is also a new and growing stream of literature on the importance of relative income for household debt decisions. Using Dutch household survey data, Georgarakos et al. (Reference Georgarakos, Haliassos and Pasini2014) provide evidence of the existence of the demand-driven effect of income inequality on household debt. In contrast, Coibion et al. (Reference Coibion, Gorodnichenko, Kudlyak and Mondragon2020) and Loschiavo (Reference Loschiavo2020) find evidence of a systematic, supply-driven relationship between local inequality and differential borrowing patterns across richer and poorer households in the US and in Italy, respectively.
A number of works raised concerns regarding the surge in household debt caused by increases in income inequality and their effects on economic crises: Krueger and Perri (Reference Krueger and Fabrizio2006); Kumhof et al. (Reference Kumhof, Rancière and Winant2015); D’Orazio (Reference D’Orazio2019). The latter in particular presents an agent-based model to study the interaction between income inequality and prudential regulations in a macroeconomic framework characterized by consumer debt. Results show that income inequality is detrimental to both macro and financial stability as it leads to higher credit demands, higher unemployment rates, economic volatility, and financial fragility.
Among the first broad contributions, Bertola et al. (Reference Bertola, Disney and Grant2006) focus on consumer credit demand and supply, compare levels of non-housing debt over time and in different countries, and review many studies on the differences across demographic groups in both the United States and in Italy. Vandone (Reference Vandone2009) also presents a comprehensive discussion of demand and supply factors that could drive changes in consumer credit growth and, focusing on European countries, highlights the existence of a wide heterogeneity in the access to this type of loan. Durkin et al. (Reference Durkin, Elliehausen, Staten and Zywicki2014) provide a deep investigation of consumer credit in the United States, exploring demand, supply, trends, technological changes, regulatory structure, and institutional development. Among the most recent contributions, pieces of evidence of consumer credit dynamics are reported in the European Central Bank publications (European Central Bank 2017a, 2017b, 2017c, 2018), mainly focusing on the aggregate trends observed at the euro area level. Building on this literature, we provide an up-to-date description of the development of consumer credit in the main euro area countries, whose dynamics have dramatically changed after the sovereign debt crisis. We present the evolution of the main factors identified as most related to the expansion in these loans. Our comprehensive and descriptive analysis should help provide researchers and policymakers with some insights on the consumer credit evolution in the period prior to the COVID-19 crisis.
This article is organized as follows. Section 2 describes the sources of data. Section 3 analyses consumer credit dynamics in the main euro area countries. Section 4 focuses on Italy, and Section 5 concludes.
2. Data Sources
This article exploits several sources of data.
Among the macroeconomic and bank data, which are used to get some insights on financial stability risks, we rely on the ECB Statistical Data Warehouse (SDW), the euro area Bank Lending Survey (BLS), the Bank of Italy supervisory reports, National Accounts, and CRIF S.p.a. data. The SDW was realised in 2006 and contains all euro area economic, financial and monetary statistics published by the ECB and Eurostat relevant to monetary policy. ECB data are available on the SDW at about their official, pre-announced release time and are accessible for a wide range of euro area users. The BLS provides information on bank lending conditions in the euro area. It is carried out four times a year and supplements existing statistics with information on the supply of and demand for loans to firms and households. The supervisory reports contain statistics at the bank level on balance sheet composition and profitability, capital and leverage, funding and liquidity and are available once a month. National accounts include information on output, expenditure, and income activities of households, corporations, and government and their wealth (net worth). They report both flows (measured over a period) and stocks (measured at the end of a period). We also exploit information on consumer credit from the CRIF S.p.A., which is a global company specializing in credit bureau and business information.
Among microeconomic survey data used to assess the heterogeneity in households’ ability to meet their debt payments, we rely on the EU-SILC and the Survey on Household Income and Wealth (SHIW). The EU-SILC dataset contains comparable cross-sectional and longitudinal, multidimensional microdata on income, poverty, social exclusion, and living conditions for all the euro area countries and for other countries that voluntarily decide to contribute. The SHIW, carried out every two or three years, encompasses detailed data on demographic characteristics, income, savings, wealth, and other aspects of Italian households’ economic and financial behaviour. The most recent surveys include about 8000 households (20,000 individuals), distributed over about 300 Italian municipalities.
3. The Consumer Credit Expansion in the Main Euro Area Countries
In this section we focus on the expansion of consumer loans in the main euro area countries. We first describe the main factors underlying dynamics over time, and then we present evidence of the risks.
3.1 . Factors Underlying Dynamics over Time
The outstanding amount of consumer credit granted by banks has been growing fast in the euro area since 2015.Footnote 1 In December 2018 the annual growth was about 7%, very similar to the growth rates observed from 2005–2006, before the financial crisis. The dynamics over time were, however, quite heterogeneous across countries (Figure 1). For Italy and Spain, the consumer credit growth rates were positive and sizeable before the financial crisis; negative or close to zero during the financial and sovereign debt crisis; and positive and increasing starting in 2015. In recent years, the expansion was lower compared with the pre-crisis period, but it was stronger than that of the euro area average (9 and 13% for Italy and Spain, respectively, in December 2018). France followed dynamics somewhat similar to those of Italy and Spain – except for a decline between 2016 and 2017 – but the growth rate levels were much lower, particularly in the period of expansion. Germany, instead, displayed a different pattern until 2015: the growth rate was close to zero before 2008, mildly positive during the financial crisis, hovering around zero again between the sovereign debt crisis and 2015, and starting to grow again thereafter.
Consumer credit granted by banks (annual percentage changes in outstanding amounts). (To view this figure in colour please see the online version of this journal.)
Source: ECB Statistical Data Warehouse. Latest data refer to December 2018. For Italy, data include securitized loans and exclude credit granted by financial intermediaries other than banks, which represents about 30% of the market.

The expansion was also strong with regard to the flows of new consumer loans granted by banks. After a lengthy period of contraction (Italy and Spain) or stability (France and Germany), since 2015 new loans have increased markedly in all countries (Figure 2).
New consumer loans granted by banks by period of interest rate fixation (1). (€ billion.) (To view this figure in colour please see the online version of this journal.)
Source: ECB Statistical Data Warehouse, supervisory reports for Italian financial intermediaries.
The period of interest rate fixation reflects the number of years for which the interest rate is not allowed to change. (1) For Italy data refer to new consumer loans granted by banks and other financial intermediaries.

Durable consumption has been identified in the literature as closely linked with consumer loans.Footnote 2 Figure 3 presents descriptive evidence for the four countries analysed over the period 2006–2018. For Italy and Spain, the correlations between new consumer loans-to-consumption ratio and consumer durables-to-disposable income ratio are very high and close to or above 90%,Footnote 3 for France and Germany they are positive, but significantly lower (40 and 20%, respectively).
Durable goods and consumer credit during the economic cycle. (Annual data; percentages.) (To view this figure in colour please see the online version of this journal.)
Source: Eurostat, ECB Statistical Data Warehouse. Data refer to the end of the year.

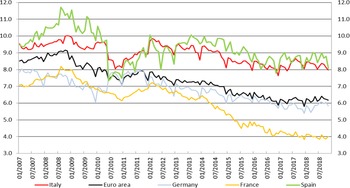
Italian and Spanish banks were attracted to the consumer loan market by the high return on this asset class (Banco de Espana 2018). Although decreasing since 2007 for all countries (Figure 4), the annual percentage rate applied to new consumer loans is still around 6% in the euro area, with significant differences across the main countries: in Italy and Spain this rate is above 8%, in Germany and France, 6 and 4%, respectively. It remains, however, significantly above that recorded for mortgages in each country.
Annual percentage rate of charge on new consumer loans. (Monthly data; percentages.) (To view this figure in colour please see the online version of this journal.)
Source: ECB Statistical Data Warehouse. Annual percentage rate of charge (APRC) includes fees.

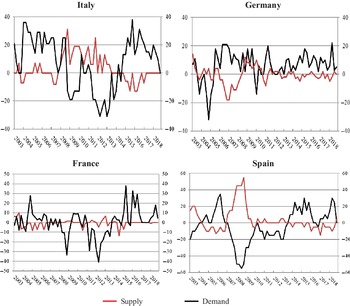
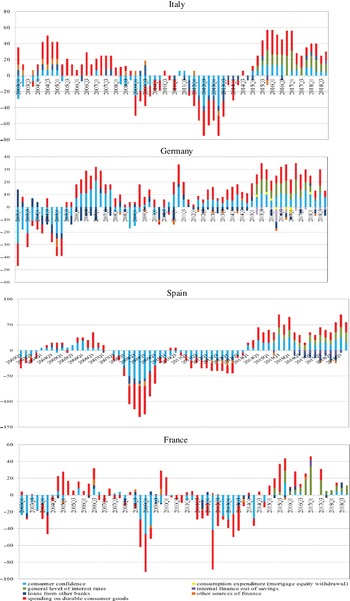
According to the ECB Bank Lending Survey, the expansion in demand for consumer credit (black lines in Figure 5) is positively correlated with the growth of consumer loans, particularly in Italy and Spain. Specifically, consumer durables expenditure and sentiment indicators represent the key factors associated with the demand for consumer loans (Figure A1 in the Appendix). In Italy and Spain, supply effects (red lines, please see the online version of this journal for a colour version of the figure) are also at work in sustaining the growth: after a long period of tightened credit conditions, since 2015 financial intermediaries have eased the terms for consumer loans. This trend is much less noticeable in France and Germany.
Credit demand and supply conditions. (Quarterly data; diffusion indexes.) (To view this figure in colour please see the online version of this journal.)
Source: Bank Lending Survey. For the demand index, values above (below) zero indicate expansion (contraction); for the supply index, values above (below) zero indicate tightening (easing).

3.2. The Risks in Consumer Credit Expansion: Evidence from Macro and Bank Data
The rapid consumer credit expansion has raised concerns about the riskiness associated with this type of credit. At the macro level, one of the mitigating factors most frequently mentioned is the smaller incidence of consumer credit on household total debt and income compared with mortgages. Figure 6 shows that, for the euro area, consumer credit as a percentage of household debt was around 10% in 2018; in Italy it was higher (around 20%), as mortgages are less common here than in other countries. The incidence of consumer loans on disposable income in 2018 was 10 and 12% in the euro area and Italy, respectively.
Relevance of consumer credit. (Percentages; 2018.) (To view this figure in colour please see the online version of this journal.)
Source: ECB Statistical Data Warehouse and National Financial Accounts.

Another relevant issue is interest rate risk. The interest component of the monthly repayment of a consumer loan is sizeable due to the high interest rates and the lower average loan amount compared with mortgages. In years past, euro area households exploited the low interest rate environment to reduce their exposure to the risk of future increases in interest rates (Figure 7). In 2017–2018, the share of new consumer credit with an adjustable rate was around 10% in the euro area (almost 30% in 2005–2006); the share was similar in Italy, which also had the highest fraction of loans with rates fixed for a period longer than 5 years (60% versus 45% in the euro area).
New volumes in consumer credit by initial period of interest rate fixation. (Percentages.) (To view this figure in colour please see the online version of this journal.)
Source: ECB Statistical Data Warehouse, Eurostat. The period of interest rate fixation reflects the number of years for which the interest rate is not allowed to change.

In Italy and Spain, the easing of supply conditions for consumer loans mirrored a significant increase of their share of total bank lending granted to the non-financial private sector. In Italy, this ratio, after hovering around 4% for a decade, rose to 7.8% in 2018, above the euro area average (6.8%) and the level recorded in Germany (7.6%) and France (7.5%; Figure 8);Footnote 4 Spain shows a similar trend.
Ratio of consumer credit to non-financial private sector total loans. (Percentages.) (To view this figure in colour please see the online version of this journal.)
Source: ECB Statistical Data Warehouse.

The ratio of the stock of non-performing loans (NPLs) for consumer credit is another synthetic indicator of credit quality. Unfortunately, no comparable data are available for distinct euro area countries, although we can rely on some figures at the euro area level referring only to the consolidated data of significant banks. In the euro area, the NPL ratio for consumer credit decreased from 10% in 2014 – in the aftermath of the financial and sovereign crises – to around 7% in more recent years (European Central Bank 2017a).
3.3. The Risks in Consumer Credit Expansion: Evidence from Microdata
In this section we exploit microeconomic survey data to further investigate the risks arising from the growth of consumer credit from the household perspective. We consider all indebted households and those with low income, which are more likely to experience financial difficulties in the face of a crisis (Bryan et al. Reference Bryan, Tylor and Veliziotis2010; European Commission 2008; Hartfree and Collard Reference Hartfree and Collard2014), and if there is a negative income shock, they are typically more likely to fall behind with their payments. To capture the higher risks stemming from these households, for instance, the Bank of Italy uses an indicator of financial vulnerability that accounts also for the income level (Michelangeli and Pietrunti Reference Michelangeli and Pietrunti2014; Attinà et al. Reference Attinà, Franceschi and Michelangeli2020).
Useful insights into the risks of consumer credit in the main euro area countries can be obtained from the EU-SILC. We focus on the 2008 and 2016 surveys to assess the changes before and after the crises. The analysis is based on the evolution of participation in the consumer credit market, specifically for low-income households, and of delinquency rates in the main European countries.
Wide heterogeneity in participation persists over time: in 2016 the percentage of households with consumer credit on total households ranges from 8% in Italy to 33% in France (15 and 35% in 2008, respectively; see Table 1, first row). Participation has decreased over the period in all selected countries, although more strongly in Italy and Spain. As in 2008, Italy has the lowest frequency of households relying on this type of loan; since the crisis the percentage has nearly halved.Footnote 5
Households with consumer credit. (Percentages.)

Source: EU-SILC dataset.
Statistics calculated using sample weights. (1) First row reports percentages of households with consumer credit on total households; second row shows percentages of households with consumer credit among poor-income households; third row shows percentages of poor-income households with consumer credit on households with consumer credit. (2) Data for France refer to 2007. (3) Equivalent disposable income.
Reliance on consumer credit is also substantial for households with a very low level of income (see Table 1; second row). Poor-income householdsFootnote 6 range from 9 to 17% of total households with consumer credit, which is on the rise compared with 2008 (8 and 15%, respectively; see Table 1, third row). Spain and Italy exhibit the highest percentages (17 and 14%, respectively), despite a decline in Italy over the period.
Participation is spread more evenly among age classes: the shares are similar in the first three (<35, 35–44, 45–54) and shrink sharply only for households with the oldest heads (>65). In Italy the participation of households in the first age class (< 35) has more than halved over the period (from 21% in 2008 to 10% in 2016)Footnote 7 and is particularly low internationally. This trend is stronger than in other countries and is consistent with more selective lending policies, as arrears remain the highest for the youngest age class (Table 2).
Households in arrears on consumer credit repayments. (Percentages relative to households with consumer credit.)

Source: EU-SILC dataset. Statistics calculated using sample weights. (1) First row reports percentages of households in arrears on consumer credit on total households; second row shows percentages of households in arrears among poor-income households; third row shows percentages of poor-income households in arrears on households in arrears. (2) Data for France refer to 2007. (3) Equivalent disposable income.
When assessing the risks stemming from consumer credit, the non-negligible share of poor-income households relying on this type of loan should not be overlooked, as it could translate into a higher frequency of delinquencies. The EU-SILC survey also measures households with at least temporary repayment difficulties in the previous 12 months.Footnote 8 In 2016, between 4 and 12% of all borrowers were in arrears (6 and 11%, respectively, in 2008; see Table 2, first row); the same percentage among the poor ranges from 13 to 29% and markedly increased over the period (13 and 25%, respectively, in 2008; see Table 2, second row). More than one third of households in arrears are income poor in Spain; the percentage is slightly lower in the other countries surveyed (Table 2, third row).
In Italy the legacy of the crisis and the slower pace of economic recovery have significantly affected households’ ability to discharge their obligations: Italy has the highest percentage of households in arrears (12%) also among the poor-income group (29%). When considering only arrears longer than 90 days, included in the non-performing loans statistics, the share of delinquent households in the total sample is, however, much lower – around 2% (see next section).
4. The Consumer Credit Expansion in Italy
In this section we focus on the expansion of consumer loans in Italy. We first describe the main characteristics of the Italian market and of the households with this type of loan, and then we present econometric evidence of the drivers of the credit growth.
4.1. The Italian Market
The increasing share of consumer loans relative to total loans granted by banks to the private sector in Italy is partly explained by their larger role in this segment of the credit market. Between 2013 and 2018, banks expanded at the expense of financial companies, raising their market share from 50 to 75% (Figure 9).
Consumer credit market in Italy: breakdown by banks and financial companies. (Outstanding amounts, € million.) (To view this figure in colour please see the online version of this journal.)
Source: Bank of Italy, Supervisory reports.

This structural change is mainly due to the merger via incorporation of consumer credit subsidiaries into bank holding companies and the conversion of financial companies into banks. Factors that fuelled this change include modifications to prudential regulation, reduction of the regulatory advantages of financial companies over banks, and greater funding opportunities for banks through access to central bank liquidity-providing operations. Cost savings achieved through the simplification of group governance may have also played a role. Moreover, the opportunities stemming from new information and communication technologies could have increased the incentives for banks to provide a whole package of services (cross-selling) rather than single, specialized products more often offered by financial companies.
Not all banks contribute at the same rate to the increase in consumer loans. From 2015–2017, growth rates were much higher for smaller banks and branches of foreign banks (more than 10%), but in the second part of 2017 and during the first part of 2018 this trend changed. Loans granted by the branches of foreign banks further increased, showing double-digit growth (more than 20%, as shown in Figure 10), while a significant deceleration was observed for smaller banks. For large banks, the rate of expansion has been more stable, less than 10% since 2016: the two major banking groups rank among the top five players in the consumer credit market. Market concentration has remained virtually unchanged over the last five years (Figure 11).
Consumer credit market in Italy: breakdown by bank size. (Quarterly data; 12-month percentage changes.) (To view this figure in colour please see the online version of this journal.)
Source: Bank of Italy, Supervisory reports.

Consumer credit: market shares of top players. (Percentages.) (To view this figure in colour please see the online version of this journal.)
Source: Bank of Italy, Supervisory reports. The ranking of a bank (i.e. the definition of top player) is determined considering its market share.

The high margins earned from consumer credit have not attracted the weakest banks into this market. As shown in Figure 12, the highest growth rate in consumer credit is observed for banks with the lowest share of total non-performing loans.
Consumer credit growth by relevance of total non-performing loans. (Median values across quartiles of NPL ratios.) (To view this figure in colour please see the online version of this journal.)
Source: Supervisory reports.
NPLs refer to total loans, and NPL quartiles are calculated using data referring to the years 2012 and 2013; consumer credit growth rates are those observed from January 2014 to June 2018.

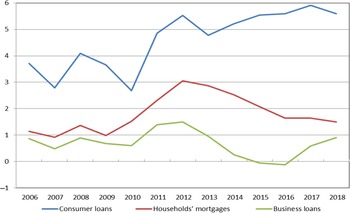
The evidence based on the credit risk-adjusted interest rate, measured with the new bad loan rate, is striking: even adjusted for the higher risk of this asset class, partly explained by the absence of collateral, the return on consumer loans is still much higher than that obtained on household mortgages and business loans (Figure 13).
Risk-adjusted returns on different assets for Italian banks. (Annual data; percentages.) (To view this figure in colour please see the online version of this journal.)
Source: Bank of Italy. The credit risk-adjusted return for the different types of loans is calculated as: APRC – benchmark interest rate – (default rate*loss given default). The default rate is the new bad loan rate for each type of loan.

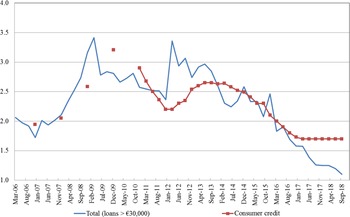
The ratio of new non-performing loans is a good indicator of the current risk inherent with consumer credit expansion (Figure 14). This ratio has been decreasing since 2014; in September 2018 it was equal to 1.7%, lower than the level recorded before the crises (around 2%). The ratio for loans to households larger than €30,000 also shows a similar trend.
New non-performing loan rate for the household sector. (Percentages.) (To view this figure in colour please see the online version of this journal.)
Source: Credit register for loans to households; Crif S.p.a. for consumer credit.
Quarterly inflow of new non-performing loans as a percentage of performing loans in t-4.

4.2. Insights from Microdata on the Italian Consumer Credit Market
As seen in Section 3.3, microdata enable a deeper analysis of risks through evaluation of the heterogeneity in trends across different groups of households, specifically by income classes. As for Italy, we could rely on further data gathered from the Survey of Household Income and Wealth (SHIW): the most recent release refers to the year 2016 and is able to capture the initial phase of consumer credit expansion.
The share of Italian households participating in the consumer credit market remained essentially unchanged between 2014 and 2016, at 12% (Figure 15, panel a); similarly, the share of households with both consumer credit and mortgage was stable, at around 3%. However, the average loan amount increased, and this is mirrored in a rise of the total amount of consumer credit, in line with the evidence from the macrodata. Consistent with the findings of the Bank Lending Survey, the increase in consumer credit has been driven by demand and supply factors. Between 2014 and 2016, the demand for consumer loans in the SHIW (measured as the fraction of households that submit a loan application) increased (from 2 to 4%), while the share of applications for consumer credit that have not been granted, in full or in part, sharply decreased (from 27 to 6%; Figure 15, panel b).
Consumer credit in the SHIW. (Percentage of households.) (To view this figure in colour please see the online version of this journal.)
Source: Survey of Household Income and Wealth. (1) Percentage of households with unsatisfied demand among those that apply for a consumer loan.

Similar to what is observed in the EU-SILC data, in 2016 the percentage of households with consumer credit has decreased since 2008 (from 17 to 12%); the reduction has been stronger among those with income lower than the median value (Figure 16, panel a). Furthermore, the median amount of debt has halved for households belonging to the lower income quartile, while it has almost tripled for those in the upper quartile (Figure 16, panel b). In line with the evidence on income,Footnote 9 we find that the decrease in the share of households with consumer credit is particularly pronounced among young households (i.e. those whose head of the family is younger than 35); on the other hand, the participation in the consumer credit market among households whose head is aged over 55 is almost unchanged (Figure 16, panel c). Furthermore, the median loan amount has almost halved for the youngest between 2008 and 2016, while for the other age classes it has increased or remained stable (Figure 16, panel d). This evidence suggests that, over time, this type of credit is becoming more concentrated among individuals that are better able to meet their debt payments, reflecting a lower fraction of more vulnerable households asking for a consumer loan and a high selectivity of banks in granting them (Assofin, Crif, Prometeia 2018).Footnote 10 The drop in the frequency of young households using consumer credit is common to other euro area countries, but it has been stronger in Italy. As a consequence, only about 10% of young households rely on consumer credit in Italy, much less than around one-fourth in Germany and Spain and more than 30% in France. This gap has likely reduced the role of credit in smoothing consumption during a person’s lifespan in Italy. Young households are indeed more in need of obtaining credit to anticipate their future income increases and face the expenditures connected with buying or renting a new house and raising children (Magri Reference Magri2002; Barnes and Young Reference Barnes and Young2004; Del Rio and Young Reference Del Rio and Young2006; Rothstein and Rouse Reference Rothstein and Rouse2011; Avery and Turner Reference Avery and Turner2012).
Consumer credit by household characteristics. (To view this figure in colour please see the online version of this journal.)
Source: Survey of Household Income and Wealth. Income quartiles refer to equivalent income.

The trends in the median loan amount are mirrored in a decrease in the ratio of consumer credit to income for households belonging to the lower income quartile and in an increase in the same ratio for households in the upper quartile (Figure 17, panel a). Overall, the share of consumer credit held by households in the two highest income quartiles increased from 54% in 2008 to 65% in 2016 (Figure 17, panel b). The higher concentration of debt among households that are better able to withstand negative economic shocks helps to explain the reduction in new non-performing consumer loans.
Consumer credit and risk. (Percentages.) (To view this figure in colour please see the online version of this journal.)
Source: Survey of Household Income and Wealth. Income quartiles refer to equivalent income.

Households in the two upper income quartiles are indeed characterized by a much lower frequency of arrears longer than 90 days in paying back their consumer loans. This frequency has decreased further since 2008–2012 (Figure 18).Footnote 11
Households in arrears for more than 90 days by income quartiles. (Percentage of households among those with consumer credit.) (To view this figure in colour please see the online version of this journal.)
Source: Survey of Household Income and Wealth. Income quartiles refer to equivalent income.

Some households could use consumer credit because they have financial difficulties. In these cases, consumer credit is a means to smooth consumption over time. To assess the potential for consumer credit markets developments, we present evidence of the participation in the consumer credit market by financial strain, measured as difficulty to make ends meet with current income or measured as perception of current income with respect to income in a normal year. Figure 19 indicates that in 2016 the share of households in financial difficulties that used consumer credit decreased, likely reflecting banks’ more selective policies.
Participation in consumer credit markets by financial difficulties. (Percentage of households.) (To view this figure in colour please see the online version of this journal.)
Source: Survey of Household Income and Wealth.

We now evaluate how credit rationing evolved over time. SHIW data indicate that in 2016 the share of households whose loan application was not fully accepted was lower than in the previous years – both for the entire population and for the most fragile households (Figure 20, panel a). However, over time, the share of households choosing a given financial intermediary because it was the only one that was granting the loan has increased (Figure 20, panel b). This evidence suggests that households select some banks that are more likely to accept their applications.
Credit rationing. (Percentage of households.) (To view this figure in colour please see the online version of this journal.)
Source: Survey of Household Income and Wealth.

Another issue that the SHIW helps to explain is why households in the upper income quartiles are willing to pay high interest rates to get credit to satisfy their consumer needs. In the following figures, the focus is on liquid assets held by households with consumer credit. Even among the most affluent households (third and fourth income quartiles), the median value of liquid assets is around €5000 and €10,000, respectively (Figure 21, panel a); this amount may not be enough to buy some durables, such as cars or pieces of furniture.Footnote 12 Therefore, even these households could need a consumer loan, the amount of which is, on average, between 40 and 60% of their liquid assets (Figure 21, panel b). Lower income households are, as expected, more financially constrained: given their lower amount of liquidity, the incidence of consumer loans relative to liquid assets is much higher (80%).
Liquid assets of households with consumer debt by income quartiles. (To view this figure in colour please see the online version of this journal.)
Source: Survey of Household Income and Wealth.

Consumer credit could also be used to smooth consumption in case of abrupt changes in income along the economic cycle (Christen and Morgan Reference Christen and Morgan2005; Karlan and Zinman Reference Karlan and Zinman2009; Wilson et al. Reference Wilson, Findlay, Meehan, Wellford and Schurter2010; Zinman Reference Zinman2010; Morse Reference Morse2011; Cavalletti et al. Reference Cavalletti, Lagazio and Vandone2011). For Italy, by using the SHIW we are able to evaluate the role of consumer loans to help those households facing important negative income shocks: since 2010 for this group of households, those relying on consumer credit were better able to protect their consumption than those without consumer credit.Footnote 13 The difference was larger and statistically significant in 2010, when indeed household consumption increased while their income dropped (Figure A.2 in Appendix) – and more recently in 2016. All in all, some Italian households hit by negative income shocks were able, in the past, to avoid important reductions in their total consumption by using credit.
4.3. The Drivers of the Consumer Credit Expansion
We aim to identify the existence of a long-run relationship between the main factors related to the flow of consumer loans, namely consumer durables and interest rates, in Italy.Footnote 14 To this end, we built a three-variable VAR system treating all variables as exogenous:
 $${z_t} = \mu+ \mathop \sum \nolimits_{k\,=\,1}^p {\theta _k}{z_{t - k}} + {\varepsilon _t} \,\,\,\,t = 1,...,T$$
where z t = [consumer loans, interest rates, durable consumption], consumer loans is the log of new consumer credit loans, interest rates is the rate applied to consumer loans, durable consumption is the log of expenditure on consumer durables.
The three variables are found to be I(1) according to both the Augmented Dickey-Fuller test and the Philips-Perron test (Table 3), indicating that all series are stationary in first-difference.
Testing for unit root (1).

Note: (1)*** Rejection of the null at 1% significance level, ** Rejection of the null at 5% significance level, Rejection of the null at 10% significance level. (2) ADF is the Augmented Dickey-Fuller test. The number of the lags used in the model for each series is equal to 1. Results are confirmed with a higher lag number. Drift term included in all the regressions. (3) PP is the Phillips-Perron test. The number of truncation lags is equal to 1. Results are confirmed with higher lags. Constant included in all regressions.
The lag length of the VAR model is set equal to 4 according to the results showed in Table 4, based on the Akaike information criteria.
Lag order determination.

Notes: Information criteria: AIC = Akaike; HQIC = Hannan-Quinn; SBIC = Schwarz’s Bayesian. The symbol * indicates lag order selected by the criterion.
Table 5 shows the results of the Johansen’s trace test: a cointegration relation among the three variables exists. The cointegrating vectors are reported in Table 6 Footnote 15 and indicate that an increase in durable consumption or a decrease in interest rates drive an increase in consumer loans. Thus, both interest rates and durable consumption are at the heart of consumer loans dynamics in Italy.
Johansen Test for the cointegration rank of the models.

Notes: * denotes rejection of the null at the 5 per cent
Cointegrating vectors.

5. Conclusion
This article presents a comprehensive description of consumer credit in the main euro area countries in recent years. The related literature has thoroughly analysed the topic starting in the 1990s, but recent evaluation of consumer credit from a broad perspective is rather scant; we aim to fill this gap.
Credit demand, specifically for consumer durables expenditure, has been connected with the consumer credit expansion in the main euro countries. Supply conditions have become more relaxed in Italy and Spain. Overall, risks connected with consumer credit expansion are decreasing. A deeper analysis focused only on Italy points to the growth in consumer durables and the decreasing interest rates as the drivers of the consumer credit expansion. The higher concentration of debt among more affluent Italian households – those better able to withstand negative economic shocks – is sustaining in Italy the reduction in the ratio of new non-performing consumer loans, which is currently lower than before the crises.
Our analysis provides evidence of the developments in consumer credit across the main euro area countries on the eve of the COVID-19 crisis; this analysis is critical both for policymakers and academic researchers to get some insights into the equilibrium reached before the crisis, and it is a starting point for an evaluation of the impact of the COVID-19 crisis on the economy.
For the deeper analysis, however, we concentrate uniquely on Italy, which is the country for which we have access to all the necessary data and information for the econometric exercise. Italy represents a piece of a bigger picture, still to be completed, for instance, by researchers from other countries, or by dealing with other countries, or in a collaborative effort with such colleagues. Testing the Johansen cointegration procedures for the other economies as well as including autoregressive distributed lag (ARDL) models for all the observed countries would be a necessary step to generalize the phenomenon and to derive wider conclusions. We leave this to future research.
From a methodological perspective, some additional analyses based on Vector Error Correction Models (VECMs) could be carried out (for instance, in line with Kok et al., Reference Kok, Marques-Ibanez and Rossi2012, on loans to non-financial corporations, among others), evaluating common trend among countries and structural breaks associated with the COVID-19 crisis. In addition, panel data analyses, taking into account differences in institutional features, could be worthwhile investigating. We leave these analyses for future research.
Acknowledgements
We wish to thank Giorgio Gobbi, Francesco Columba, Paolo Finaldi Russo.
About the Authors
Silvia Magri took her Bachelor’s Degree in Economics at the Bocconi University in Milan and her MA in Economics at the University of Essex (UK). In 1992 she started to work at the Institute for Social Research (nowadays REF) in Milan, where the primary topic of her analysis was the study of financial markets. In 1999 she started her career at the Bank of Italy, initially at the Milan Branch and then in Rome, in the Department of Economics and Statistics. Her research focuses mainly on household debt and vulnerability and corporate financial structure, notably of innovative firms, with specific attention on the implications of these issues with regard to the stability of financial system.
Valentina Michelangeli currently works as an Economist at the Directorate General for Economics, Statistics and Research of the Bank of Italy. She is the Deputy Coordinator of the Seminar Committee. Before joining the Bank of Italy, she worked as Senior Analyst at the Congressional Budget Office, in Washington, DC, focusing on the macroeconomic implications of fiscal policy reforms. Her main research interests lie in the fields of household finance and financial stability. Her works include analyses of household consumption, mortgages, portfolio choices, and households’ and firms’ financial vulnerability. She has published in, among other publications, the American Economic Journal: Macroeconomics, Macroeconomic Dynamics, Economics Letters and the International Journal of Microsimulations.
Sabrina Pastorelli is Senior Advisor at the Directorate General for Economics, Statistics and Research of the Bank of Italy. She is Head of the Unit devoted to the Analysis of financial choices of households and firms at the Financial Stability Directorate. She is a member of the OECD Informal Steering Group on SME and Entrepreneurship Financing. Her current research interests include the analysis of the financial conditions of corporates and households, firm financial vulnerability in the international comparison, and access to credit in times of crisis. Previously, she has published essays on economic development in the historical perspective.
Raffaella Pico works as an Economist at the Bank of Italy, in the Financial Stability Directorate, which is part of the Directorate General for Economics, Statistics and Research. She has worked extensively on issues related to households’ debt and vulnerability, mortgage markets, and financial conditions of firms in the construction and real estate sectors.
Appendix
Consumer credit demand. (To view this figure in colour please see the online version of this journal.)
Source: ECB Bank Lending Survey.

Consumption and disposable income in Italy. (Percentage changes on previous year.) (To view this figure in colour please see the online version of this journal.)
Source: Based on Istat data.