An inequality in educational provisions has long existed between children who are diagnosed as meeting the criteria for dyslexia and children with general learning difficulties in addition to poor reading. While children with dyslexia, who have poor reading in combination with average or above average IQ, have maintained consistent access to statutory support through statements of special educational needs, such provisions have often been unavailable to children with poor reading and low IQ in the United Kingdom. The assumption has been that reading difficulties that appear out of line with overall cognitive ability may have a specific cause that can be addressed via targeted remediation, while reading difficulties in line with overall cognitive ability have more general causes. This view is also present in reading disability research where investigations have focused on children with IQ-discrepancy defined dyslexia. As low IQ in itself may cause children to perform poorly on tests designed to reveal the underlying cognitive and sensory causes of poor progress in reading, methodological concerns have led researchers to seek to control the influence of IQ by excluding low IQ poor readers (LIQPRs) from their studies.
The legacy of this two-tiered classification system for poor reading likely stems from assumptions about the relationship between IQ and reading present in the reading literature around 30 years ago. Stanovich (Reference Stanovich1988), for example, described a critical presumption made in almost total absence of empirical evidence, which declared the discrepancy between reading ability and IQ as cognitively meaningful. Children demonstrating discrepancy-defined dyslexia were considered an etiologically and neurologically distinct group from other poor readers (Stanovich & Siegel, Reference Stanovich and Siegel1994). Such assumptions were derived in part from the Isle of Wight study (Rutter & Yule, Reference Rutter and Yule1975), which found that while IQ scores were normally distributed in their sample population, reading scores were not. A hump was identified at the lower tail of the distribution, and it was thought to indicate a “specific reading retarded” group. It was assumed that this hump suggested an aetiology that was distinct from that characterizing poor readers with low IQ. However, the presence of a hump at the lower end of the reading distribution was not replicated in further studies (e.g., Rodgers, Reference Rodgers1983; Share, McGee, McKenzie, Williams, & Silva, Reference Share, McGee, McKenzie, Williams and Silva1987; Shaywitz, Escobar, Shaywitz, Fletcher, & Makuch, Reference Shaywitz, Escobar, Shaywitz, Fletcher and Makuch1992), and the distribution was subsequently explained by ceiling effects in the reading test used in the Isle of Wight study (Van der Wissel & Zegers, Reference Van der Wissel and Zegers1985). Nevertheless, the notion of two types of poor reader groups differentiated by IQ persisted. A decade later, Siegel (Reference Siegel1989) published a pivotal article, which argued that IQ was irrelevant to the definition and analysis of reading disability, yet she faced strong opposition. Even the editor of the issue of the Journal of Learning Disabilities devoted to the topic (volume 22, issue 8, 1989) described Siegel's desire to provide appropriate remediation for all those who need it as a “utopian vision” (p. 159), constrained by funding practicalities (Wong, Reference Wong1989). Now, despite a general acknowledgement from academic researchers (e.g., Snowling, Reference Snowling2008; see Stanovich, Reference Stanovich1998, for a review) and dyslexia organizations (e.g., Dyslexia Action) that all poor readers share deficits in phonological processing, it has been identified as a “puzzling phenomenon” that IQ tests are still widely used to differentiate between generic poor reading and dyslexic reading groups (Elliott & Gibbs, Reference Elliott and Gibbs2008). As Elliott and Gibbs note, the issue is important, since the application of an IQ–reading achievement model may exclude some children from receiving specialized intervention.
Following Stanovich (Reference Stanovich1988) and Siegel (Reference Siegel1989), the theoretical framework underpinning the current study is that IQ skills do not determine a child's progress in word reading. Rather, as they suggest, certain cognitive factors tend to be associated with progress in word reading, and the most important of these cognitive factors is the child's phonological processing skills. We take this framework further, exploring whether basic auditory processing is related to individual differences in phonological skills. Our interest is in the fundamental biological mechanisms that might determine whether an individual finds it easy or difficult to learn to read. Basic sensory processes, such as hearing, are not usually thought of as related to IQ, but specific aspects of basic sensory processing might be related to specific aspects of cognitive development. For example, specific aspects of basic auditory processing may be related to the development of phonological skills (Goswami, Reference Goswami2011). Individual differences in basic auditory sensory processing skills have been related to phonological development in studies of children with IQ-discrepancy defined dyslexia. We suggest here that while IQ may be irrelevant to identifying poor readers, basic auditory processing might be important. Differences in basic auditory processing might be indicative of brain-based differences, which may in turn determine progress in word reading (regardless of IQ).
According to this theoretical position, there should be children with low IQ and good auditory processing, and they should usually be competent word readers. There should also be children with low IQ and poor auditory processing, and they should usually be less competent word readers. A recent study by Kuppen et al. (Reference Kuppen, Huss, Fosker, Mead and Goswami2011) identified such groups of children. They reported on a cohort of low IQ children (mean full scale IQ < 86), which contained good readers (children reading on average 17 months ahead of their chronological age [CA]) and poor readers (children reading on average 19 months behind their CA). The full sample (127 children) covered a range of reading ability and IQ, and they found that individual differences in basic auditory processing were related to individual differences in phonological skills and in reading. This relationship was characterized by some rather than all of the auditory measures used, with sound rise time (the rate at which a tone reached its maximum intensity), sound duration, and sound intensity identified as the critical variables linked to word reading in cross-sectional analyses. The two auditory measures that differentiated the low IQ children who were good versus poor readers were rise time and intensity discrimination. In the current study, we report a longitudinal follow-up (Time 2) of the children tested by Kuppen et al. (Reference Kuppen, Huss, Fosker, Mead and Goswami2011; Time 1).
If our basic theoretical framework is correct, then individual differences in auditory processing skills at Time 1 should be related to individual differences in progress in word reading at Time 2. Further, at Time 2, poor reading skills should be accompanied by poor phonology and poor auditory sensory processing, regardless of IQ, while good reading skills should be accompanied by good phonology and good auditory sensory processing, again regardless of IQ (see Kuppen et al., Reference Kuppen, Huss, Fosker, Mead and Goswami2011). Kuppen et al. (Reference Kuppen, Huss, Fosker, Mead and Goswami2011) reported that LIQPRs showed auditory processing difficulties comparable to those difficulties present in children with IQ-discrepancy defined dyslexia. In contrast, low IQ good readers (LIQGRs) generally did not show auditory difficulties, instead showing auditory processing skills that were equivalent to those of typical IQ controls. The current follow-up study thus enabled longitudinal predictive relationships between basic auditory processing measured at Time 1 and progress in word reading and phonology measured at Time 2 to be assessed. It also provided cross-sectional data at Time 2 with which to examine whether the associations among basic auditory processing, reading, and phonology reported at Time 1 by Kuppen et al. (Reference Kuppen, Huss, Fosker, Mead and Goswami2011) remained stable over time.
The auditory processing tasks used to measure sensory processing were chosen to test the temporal sampling framework originally proposed to link auditory processing, phonological development, and IQ-discrepancy defined dyslexia (Goswami, Reference Goswami2011). They comprised measures of sensitivity to the rate of energy change at sound onset (amplitude envelope rise time), sound duration, sound frequency, sound intensity, and perceptual rhythm. Basic auditory processing of many aspects of sound, such as simple frequency, intensity, duration, and gap detection, have been measured in a large number of previous studies of discrepancy-defined dyslexia (although not in studies of LIQPRs). Hämäläinen, Salminen, and Leppänen (Reference Hämäläinen, Salminen and Leppänen2012) provided a comprehensive review of all the studies of basic auditory sensory processing (nonspeech stimuli) conducted with participants with dyslexia. They reported that many different auditory difficulties had been documented across studies but that these difficulties varied considerably between studies. The auditory parameters showing the most consistent group differences across studies were amplitude envelope rise time (100% of reviewed studies) and frequency modulation at slower rates (<60 Hz; 92% of reviewed studies). The next most frequent parameters to show group differences between dyslexics and controls were frequency discrimination (for small differences, 76% of studies), duration discrimination (75% of studies), and the perception of amplitude modulation (75% of studies). When considering effect sizes, the largest average sample-size weighted effect sizes were found for duration (0.9), rise time (0.8), and frequency (simple pitch discrimination of small differences, 0.7). Finally, Hämäläinen et al. computed the percentage of studies demonstrating relations between auditory processing measures and reading. While all studies measuring amplitude modulation or amplitude envelope rise time showed relations to reading development, far fewer studies varying the other auditory parameters showed such relations. Hämäläinen et al. concluded that the auditory measures most strongly related to dyslexia were rise time, duration, amplitude modulation, and frequency modulation, which they described as speech prosody-related sound features.
As Hämäläinen et al. (Reference Hämäläinen, Salminen and Leppänen2012) noted, a number of recent studies of children with typical IQ who either do or do not have IQ-discrepancy defined dyslexia have measured individual differences in the discrimination of amplitude envelope onsets and found group differences (rise time; Goswami, Fosker, Huss, Mead, & Szücs, Reference Goswami, Fosker, Huss, Mead and Szűcs2011; Goswami, Gerson, & Astruc, Reference Goswami, Gerson and Astruc2010; Goswami, Wang, et al., Reference Goswami, Wang, Cruz, Fosker, Mead and Huss2011; Hämäläinen, Leppänen, Guttorm, & Lyytinen, Reference Hämäläinen, Leppänen, Guttorm and Lyytinen2008; Muneaux, Ziegler, Truc, Thomson, & Goswami, Reference Muneaux, Ziegler, Truc, Thomson and Goswami2004; Richardson, Thomson, Scott, & Goswami, Reference Richardson, Thomson, Scott and Goswami2004; Surányi et al., Reference Surányi, Csépe, Richardson, Thomson, Honbolygó and Goswami2008; Thomson & Goswami, Reference Thomson and Goswami2008; for Dutch, see also Poelmans et al., Reference Poelmans, Luts, Vandermosten, Boets, Ghesquiere and Wouters2011). Further, in a longitudinal study of typically developing English-speaking prereaders, discrimination of amplitude envelope rise time at age 4 was a significant longitudinal predictor of individual differences in a rhyme oddity task at age 6 (Corriveau, Goswami, & Thomson, Reference Corriveau, Goswami and Thomson2010). It therefore seems plausible that a basic sensory difficulty in rise time discrimination affects phonological development, which in turn affects reading. A priori, accurate discrimination of the amplitude envelope of speech is likely to be important for the development of high-quality phonological representations because the amplitude envelope is critical for speech intelligibility (Drullman, Reference Drullman, Greenberg and Ainsworth2006). The amplitude envelope is the fluctuation in the summed energy (intensity) of the signal that reaches the ear drum across different frequency bands, and rises in intensity in this sound envelope correspond to syllable onsets. The overall fluctuations in the amplitude envelope are perceived as speech rhythm (Greenberg, Arai, & Grant, Reference Greenberg, Arai, Grant, Divenyi, Vicsi and Meyer2003), and rise time is related to rhythmic regularity or timing across languages (Hoequist, Reference Hoequist1983; Scott, Reference Scott1998). Impaired sensitivity to rise time would hence result in impaired sensitivity to speech prosody as well as difficulties in segmenting syllables from the continuous stream and in perceiving differences in syllable stress (stressed syllables have larger rise times).
A comprehensive review of the rise time data and of the theoretical framework linking amplitude envelope processing and phonological development is provided by Goswami (Reference Goswami2011). As she describes, recent studies in auditory neuroscience suggest that human speech processing relies on temporal processing at a variety of time scales (Hickok & Poeppel, Reference Hickok and Poeppel2007). Particularly important is thought to be the processing of the temporal modulation patterns associated with syllables (slower modulation rates, 4–8 Hz) and auditory processing of the temporal modulation patterns associated with phonetic segments (more rapid rates, 22–40 Hz; Poeppel, Idsardi, & van Wassenhove, Reference Poeppel, Idsardi and Van Wassenhove2008). These two windows of temporal integration (slow and rapid) are thought to be critical for the final speech percept, and difficulties at both timescales have been reported in children with discrepancy-defined dyslexia. Goswami (Reference Goswami2011) suggested that the phonological difficulties associated with poor reading development might have their origins in impaired processing of the temporal modulation patterns associated with the (slower) syllable rate, as indexed by difficulties in discriminating amplitude envelope rise times. According to this framework, phoneme-level difficulties may arise later as reading is taught and children remap phonology in response to reading instruction (Ziegler & Goswami, Reference Ziegler and Goswami2005). The phonological profiles of LIQPRs are largely similar to those of children with discrepancy-defined dyslexia (Stanovich, Nathan, & Zolman, Reference Stanovich, Nathan and Zolman1988). It is thus of interest to investigate whether individual differences in rise time discrimination are also related to progress in reading over time in children with low IQ.
Rise time and intensity discrimination were the only two auditory processing measures administered by Kuppen et al. (Reference Kuppen, Huss, Fosker, Mead and Goswami2011) that differentiated LIQGRs from LIQPRs. However, Kuppen et al. studied relationships among a number of measures of basic auditory processing (sound rise time, frequency, duration, intensity, and perceptual rhythm), phonological awareness, and reading development, for both LIQPRs and LIQGRs. Kuppen et al. reported that LIQPRs were uniformly poor on the phonological tasks administered, while low IQ children who were ahead in their reading relative to their age (LIQGRs) possessed good phonological skills. Kuppen et al. also found that while LIQGRs performed at a level similar to their age-matched peers on the auditory tasks used (except frequency discrimination), LIQPRs performed poorly on all auditory measures. They further reported that individual differences in basic auditory processing of sound rise time, intensity, frequency, and duration, as well as of rhythm, were significantly related to individual differences in reading in cross-sectional analyses (see Kuppen, Reference Kuppen2010). The strongest concurrent predictors of reading were the rise time, duration, and intensity measures. Kuppen et al. argued that these relationships provided support for Stanovich's (Reference Stanovich1988) phonological core deficit model. Further, the data suggested that low IQ did not necessarily accompany poor auditory sensory performance (with the exception of frequency discrimination). Finally, despite having poor auditory and phonological skills, LIQPRs showed no evidence of atypical lexical development. Specifically, in examining the effects of phonological neighborhood density, LIQPRs, similar to typically developing controls, demonstrated phonological neighborhood density effects. For example, they were superior at remembering target words from dense phonological neighborhoods compared to sparse phonological neighborhoods.
In the current paper, we report a further assessment of many of the children from Kuppen et al. (Reference Kuppen, Huss, Fosker, Mead and Goswami2011), at a time point on average 14 months later than their first assessment. We explore (a) whether the measures of basic auditory processing administered by Kuppen et al. (Reference Kuppen, Huss, Fosker, Mead and Goswami2011) were predictive of progress in reading and phonology 14 months later, (b) whether the associations among basic auditory processing, reading, and phonology documented by Kuppen et al. (Reference Kuppen, Huss, Fosker, Mead and Goswami2011) were stable over time, and (c) whether progress in reading also had an effect on the development of basic auditory processing.
METHOD
Participants
The study reported by Kuppen et al. (Reference Kuppen, Huss, Fosker, Mead and Goswami2011) utilized a cohort of 127 children. Of these, 103 children were available for retesting at the current time point. Longitudinal relations among basic auditory processing, word reading, and phonology were assessed for these 103 participants. In addition, Kuppen et al. reported group-based comparisons for 95 selected participants divided into four hypothesis-driven groups: LIQPRs, LIQGRs, CA controls, and reading level (RL) controls. Of these 95 children, 85 (42 females, 43 males) were retained for the current study. The new groups comprised 24 LIQPR, 10 LIQGR, 27 CA controls, and 24 RL controls.
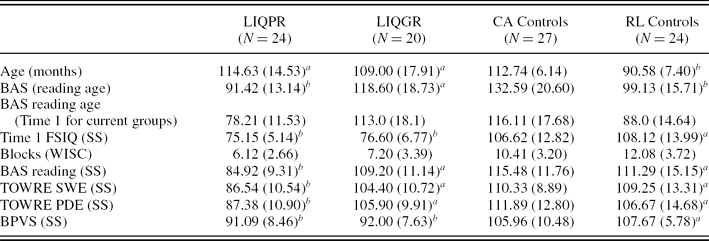
As detailed in our earlier publication, the majority of poor readers were initially identified through a longitudinal project on auditory processing in dyslexia (Goswami, Wang, et al., Reference Goswami2011). The remaining LIQPRs and all other participants were recruited from schools in Cambridge by the first author. All children in the project demonstrated fluency in English and were free from additional learning difficulties (e.g., autism spectrum disorder, attention-deficit hyperactivity disorder, and speech and language impairment). Children received a short hearing screen using an audiometer where sounds were presented at a range of frequencies (250, 500, 1000, 2000, 4000, and 8000 Hz). All children were sensitive to frequencies administered to both the right and the left ears within the 20 dB HL range. Kuppen et al. (Reference Kuppen, Huss, Fosker, Mead and Goswami2011) identified low IQ children as those who had a full scale IQ of less than 86, calculated according to the Wechsler Intelligence Scale for Children, Third Edition (WISC III; Wechsler, Reference Wechsler1992) tetrad short form, composed of two verbal (similarities and vocabulary) and two performance scale (block design and picture arrangement) tests. The tetrad short form was used at Time 1 because it is relatively quick to administer and demonstrates a high validity coefficient (r = .95) when compared with standardized full-scale IQ scores (Sattler, Reference Sattler1981). At Time 2 (the current study), only the block design subtest was readministered, because of time constraints. The majority of the LIQPRs had been identified by teachers, parents, or speech and language therapists as struggling readers. In our earlier report (Kuppen et al., Reference Kuppen, Huss, Fosker, Mead and Goswami2011) these children were on average 38 months behind age-matched controls on the British Ability Scales (BAS) measure of single word reading (Elliott, Smith & McCullouch, Reference Elliott, Smith and McCullouch1996), a lag that by the current test point had grown to 41 months. Ten LIQGRs (5 male, 5 female) were also identified at this time (equated with the LIQPRs on full-scale IQ, mean reading age 113 months, or 17 months ahead of age), all of whom were seen again at the current test point. The LIQGRs for the current analysis remained slightly ahead in reading for their age (by an average of 10 months) and possessed a mean reading age of 119 months. As discussed in our earlier paper, it should be noted that the CA controls also performed ahead of their expected reading age, 20 months at the current test point. The most likely reason for these discrepancies in age and attainment is that the BAS was standardized in 1996, before the advent of the UK National Literacy Strategy.
Two typical reader groups were identified in Kuppen et al. (Reference Kuppen, Huss, Fosker, Mead and Goswami2011). The CA controls were equated with the LIQPR and LIQGR groups on age, and the RL controls were equated with the LIQPR group on BAS reading age in months. Of the original 29 CA controls (average age = 99 months, average reading age = 117 months), 27 (average age = 113 months, average reading age = 133 months) were followed up. For the RL controls, 24 (average age = 91 months, average reading age = 99 months) of the original 26 children (average age = 80 months, average reading age = 86 months) were seen a second time. For completeness of information, Table 1 shows the Time 1 reading ages for the retained (smaller) CA, RL, and LIQPR groups. In addition, 18 of the children seen in the original study who were not included in the group analyses were seen again for the present study.
Participant characteristics for Time 2 by matched group

Note: Standard deviations are in parentheses. LIQ, low IQ; PR, poor reader; GR, good readers; CA, chronological age equated typically developing readers; RL, reading level equated typically developing readers; SS, Standard Scores; BAS, British Ability Scales; FSIQ, prorated full scale IQ; WISC, Wechsler Intelligence Scale for Children; TOWRE, Test of Word Reading Efficiency; SWE, sight word efficiency; PDE, phonemic decoding efficiency; BPVS, British Picture Vocabulary Scale.
aEquivalent to CA.
bSignificantly different from CA.
Standardized tests
The standardized tests administered for the current study were largely the same as Kuppen et al. (Reference Kuppen, Huss, Fosker, Mead and Goswami2011) and included the blocks measure from the WISC III, the Test of Word Reading Efficiency (TOWRE; Torgesen, Wagner, & Rashotte, Reference Torgesen, Rashotte and Wagner1999) for word reading and nonword reading, the BAS for word reading (Elliott et al., Reference Elliott, Smith and McCullouch1996), and the British Picture Vocabulary Scale (BPVS; Dunn, Dunn, Whetton, & Burley, Reference Dunn, Dunn, Whetton and Burley1997) for receptive vocabulary. See Table 1 for outcomes on all these measures.
The TOWRE is a measure of word reading accuracy normed on a US population, composed of the Test of Sight Word Efficiency (SWE) and the measure of phonetic decoding efficiency (PDE). Both measures assess the number of words (SWE) or nonwords (PDE) that can be accurately decoded in 45 s. In addition, the BAS word reading test provides an untimed measure of children's word reading accuracy normed on a UK population. On all BAS tests, questions are ordered with increasing difficulty, using age-related start points to minimize testing time and reduce fatigue. Children proceed until they fail a target number of items (the ceiling). In word reading this stopping point is 8 or more failed items in a block of 10 words. Because the outcomes for the TOWRE SWE directly mirrored those of the BAS word reading test, only the latter measure is reported here. The exception to this rule is in Table 1, where participant characteristics are reported for all measures.
The BPVS was used to measure receptive vocabulary. This test requires children to indicate which of four pictures best illustrates the meaning of a word spoken by the examiner. The words utilized represent actions, animals, toys, and so on, and cover a variety of word types such as nouns and verbs. Questions increase in difficulty from an age-appropriate starting point, and the ceiling is reached when a child has made 8 or more errors in a set of 12 words.
Experimental measures of phonological processing
Rime oddity (RO) task
The RO task (Richardson et al., Reference Richardson, Thomson, Scott and Goswami2004) was delivered in one of three presentation orders using digitized speech created from a native speaker of standard Southern British English. Phonological neighborhood density was manipulated with 10 trials presenting words from dense neighborhoods (e.g., that, wag, nag) and 10 trials presenting words from sparse neighborhoods (e.g., dutch, budge, hutch). Children were required to repeat the word that ended with a different sound (e.g., that, wag, nag—that). Using words selected from the De Cara and Goswami (Reference De Cara and Goswami2002) database, the mean rime neighborhood density for the dense condition was 19.43 (SD = 2.91) and for the sparse condition it was 6.83 (SD = 3.35). Conditions were matched for phonotactic probability, spoken word frequency, and written word frequency (see Appendix A).
Phonological short-term memory (PSTM)
The PSTM task (Thomson, Richardson, & Goswami, Reference Thomson, Richardson and Goswami2005) consisted of 16 trials, each with four unique monosyllabic consonant–vowel–consonant words presented by the same Southern British English speaker. Again three presentation orders were used, and individual trials were controlled to prevent any phoneme from occurring more than once. The presentation of dense versus sparse trials was randomly varied within each order. Trials were equally divided between words with dense (e.g., knit, laid, rack, pub; fed, tub, shake, lip) and sparse (e.g., hem, dull, join, song; fib, road, peg, shook) rimes. The mean number of rime neighbors for dense stimuli according to the DeCara and Goswami (Reference De Cara and Goswami2002) database was 18 (SD = 3.3) and for sparse stimuli it was 7 (SD = 2.7). Density conditions were balanced for lead neighbors (words possessing the same onset and vowel) and spoken frequencies or familiarities (see Appendix A for all items). Children were required to listen through sound attenuating headphones, and responses were captured by DAT recorder.
Auditory processing tasks
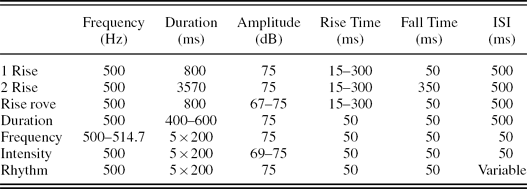
The auditory battery presented measures of amplitude rise time, duration, frequency, intensity, and rhythm (see Appendix A for descriptions of each task). Tasks administered represented measures selected to explore different aspects of auditory perception, particularly related to the discrimination of the amplitude envelope. An overview of the parameters for the Time 1 tasks is presented in Table 2. All tasks were delivered using the Dinosaur program, a child-friendly acoustic threshold estimation interface (originally created by Dorothy Bishop, Oxford University, and reprogrammed for the current study by Martina Huss; see Goswami, Wang, et al., Reference Goswami, Fosker, Huss, Mead and Szűcs2011). Trials were delivered in an AXB format (where X is standard and either A or B differ from X in one direction), or a two-interval forced choice paradigm. Children were required to choose the target stimuli either by pointing to the screen or by indicating the color of the dinosaur producing the target sound. Auditory and visual response feedback indicating correct/incorrect answers simultaneously sustained the child's interest while providing the opportunity for learning. Catch trials, presenting the easiest discrimination, were presented a maximum of four times to assess attention levels in each child. Each child was provided with five practice runs, and comprehension of the task was confirmed before the initiation of the recorded trials. Psychoacoustic stimuli were presented binaurally through Sennheiser HD580 headphones at 75 dB sound pressure level, and the testing laptop was fitted with an Echo Indigo Sound card. Earphone sensitivity was adjusted using a Zwislocki coupler in one ear of a KEMAR manikin (Burkard & Sachs, Reference Burkard and Sachs1975).
Auditory stimulus parameters for the Time 1 tasks
Note: ISI, interstimulus interval.
A two-interval forced choice paradigm with an ABABA format was used for the frequency and intensity tasks as administered by Kuppen et al. (Reference Kuppen, Huss, Fosker, Mead and Goswami2011). This format, which uses shorter, repeated tones, was chosen to minimize auditory memory demands on the participants in light of their lower IQ. As such, the ABABA tasks were created to provide a sensitive measure of frequency and intensity since children were simply required to identify a change in the characteristic of interest. However, in a recent study with Chinese children with discrepancy-defined dyslexia, it was found that performance on the intensity ABABA measure differed significantly between groups (dyslexic children significantly worse than CA controls) and was a significant predictor of Chinese character reading. Performance on a simple intensity task was not (Wang, Huss, Hämäläinen, & Goswami, Reference Wang, Huss, Hämäläinen and Goswami2010). Therefore, a simple intensity task was added to the test battery. The simple intensity task required children to listen to two short (200 ms) tones and identify which of the two sounds was softer.
RESULTS
Analysis
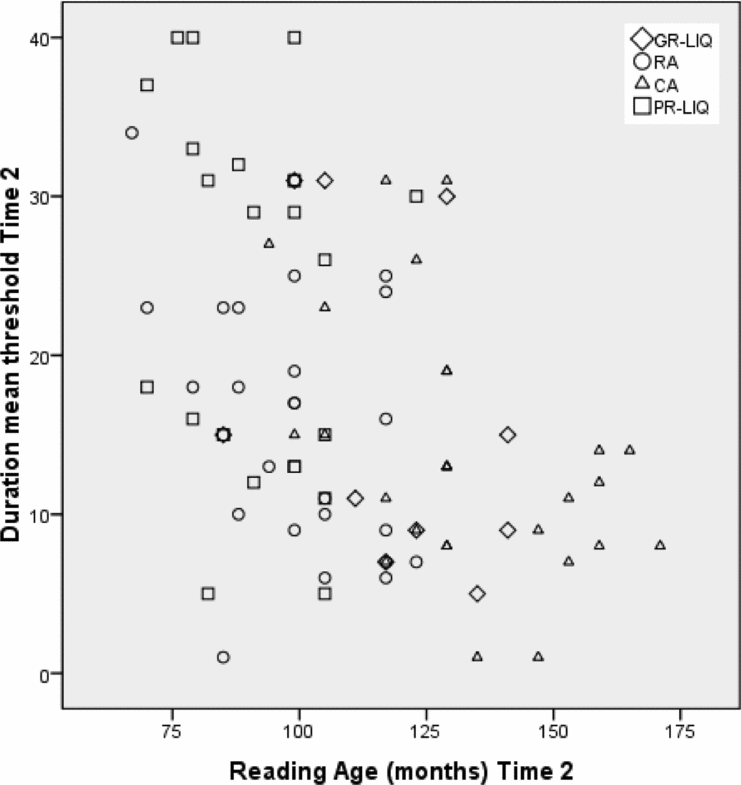
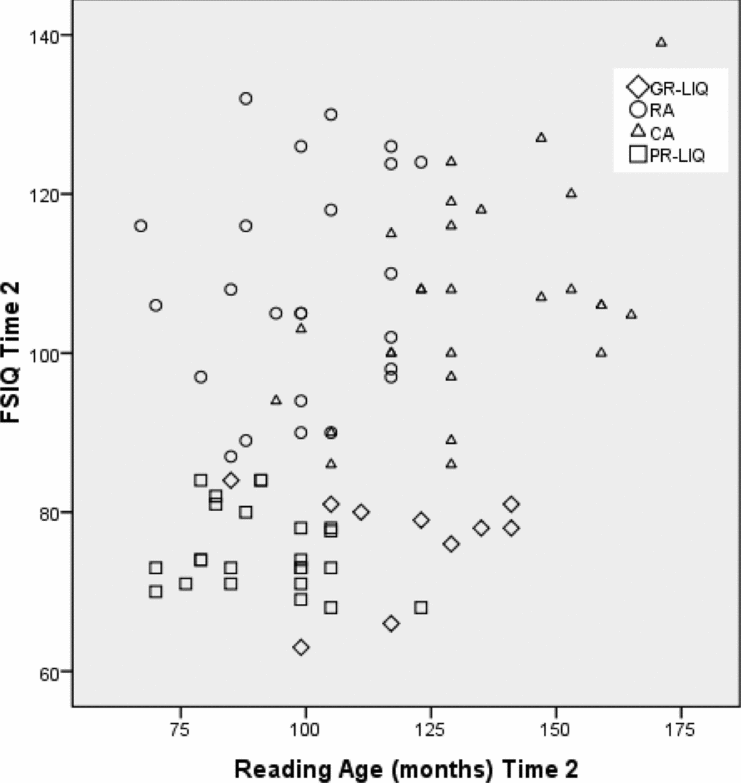
In order to compute possible longitudinal relations between individual differences in basic auditory processing and progress in reading and phonological development, data from the total cohort of 103 children was used. Within this cohort, age, reading ability, auditory processing, and IQ were continuously distributed, as depicted in Figure 1 and Figure 2. To assess the stability of the relations among auditory sensory processing, reading, and phonology reported at Time 1 (Kuppen et al., Reference Kuppen, Huss, Fosker, Mead and Goswami2011), the equated groups were compared. Group analysis enabled the comparison of the performance of LIQPR to (a) younger children of a similar reading ability (RL controls), (b) better readers of a similar age (CA controls), and (c) better readers of a similar mean IQ (LIQGRs). As such, variables related to underlying factors in progress in reading may be identified. For example, if auditory processing is related to absolute progress in reading, one might expect to see the RL control and LIQPR groups performing at similar levels on the auditory tasks, since they are equated for reading, while the CA control and LIQGR groups would both demonstrate lower thresholds. If both the CA and the RL control groups outperform the LIQPRs on auditory tasks, then this would suggest that the auditory factor is related to reading development (reading has developed more efficiently in the younger RL controls, since they have higher standard scores than the older LIQPRs). However, if some areas of auditory processing are related to age, one might expect the LIQGR and CA control groups to perform at a similar level to the LIQPRs, with the RL control group demonstrating higher thresholds. Comparisons between the age- and IQ-matched LIQPR and LIQGR groups are also of interest, since any sensory or cognitive measure that is similar between these two groups is likely to be related to low IQ.
Example scatterplot (reading age Time 2, duration threshold Time 2).
Example scatterplot 2 (reading age Time 2, full scale IQ Time 2).
Longitudinal associations between auditory processing and progress in reading and phonology
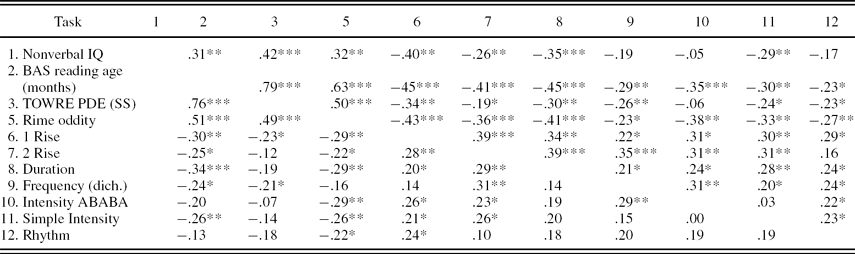
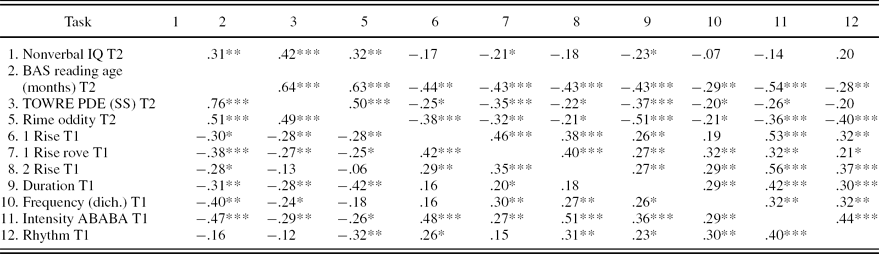
Table 3 presents the raw and partial (controlling for age and nonverbal IQ [WISC blocks]) correlations among the standardized, phonological, and auditory measures for the sample of 103 children at the current test point, and Table 4 presents the time-lagged correlations with the reading and phonological measures at Time 2 and the same auditory measures when given at Time 1. From inspection, it is evident that at both time points the majority of the partial correlations show a significant relationship between the mean auditory thresholds and BAS single-word reading performance (reading age). The partial correlations also demonstrate that all of the auditory tasks, with the exception of frequency and two rise, were significantly related to phonological performance (measured by the RO task).
Raw (above the diagonal) and partial (controlling for age and nonverbal IQ, below the diagonal) correlations between auditory measures and reading and phonological measures at current test point for entire sample (N = 103)
Note: BAS, British Ability Scales; TOWRE PDE (SS), Test of Word Reading Efficiency phonemic decoding efficiency (standard score).
Raw (above the diagonal) and partial (controlling for age and nonverbal IQ, below the diagonal) correlations between auditory measures at T1 and reading and phonological measures at T2 for entire sample (N = 103)
Note: T1, Time 1; T2, Time 2; BAS, British Ability Scales; TOWRE PDE (SS), Test of Word Reading Efficiency phonemic decoding efficiency (standard score).
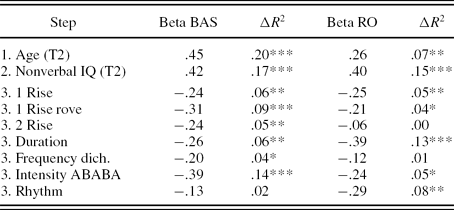
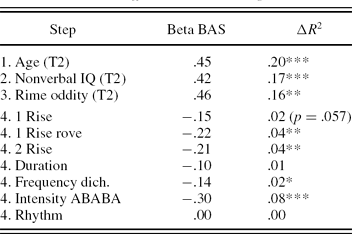
To calculate the unique variance in reading and phonological awareness explained longitudinally by each auditory task, a series of three-step fixed-order multiple regression equations was run taking reading age in months at Time 2 as the dependent variable (as in Kuppen et al., Reference Kuppen, Huss, Fosker, Mead and Goswami2011). For each analysis, age was added as Step 1, followed by nonverbal IQ (blocks) as Step 2,Footnote 1 and then each individual auditory measure from Time 1 (Kuppen et al., Reference Kuppen, Huss, Fosker, Mead and Goswami2011) as Step 3 (seven equations). The data are shown in Table 5. Inspection of Table 5 demonstrates that all of the Time 1 auditory measures, with the exception of rhythm (ΔR 2 = .02, p = .13), predicted significant individual variance in current BAS single-word reading outcomes (reading age). In addition, Time 1 auditory tasks, with the exception of the two rise (ΔR 2 = .003, p = .55) and frequency (ΔR 2 = .01, p = .18) tasks, also predicted significant unique variance in the RO measure. Therefore, individual differences in basic auditory processing are predictive of individual differences in single-word reading and phonological awareness 14 months later in a sample including low IQ children. Consistent with the concurrent predictors of reading identified by Kuppen et al. (Reference Kuppen, Huss, Fosker, Mead and Goswami2011), all the auditory processing measures were significant longitudinal predictors of reading, with the exception of rhythm. With the addition of RO as a third step in the multiple order regressions to account for concurrent differences in phonological awareness (see Table 6), rove, two rise, frequency, and intensity remained significant longitudinal predictors.
Stepwise regressions showing the unique variance in BAS reading age (months) and RO at T2 contributed by the different auditory processing measures at T1 (standardized beta coefficients and R2 change)
Note: BAS, British Ability Scales; RO, time oddity; T2, Time 2; T1, Time 1.
*p ≤ .05. **p ≤ .01. ***p ≤ .001.
Stepwise regressions showing the unique variance in BAS reading age (months) at T2 contributed by the different auditory processing measures at T1 after controlling for performance on the rime oddity task (standardized beta coefficients and R2 change)
Note: BAS, British Ability Scales; T2, Time 2; T1, Time 1.
*p ≤ .05. **p ≤ .01. ***p ≤ .001.
Stability of associations among auditory processing, reading, and phonology
Standardized tests used to equate groups at Time 1: Performance at Time 2
To explore whether the groups of children continued to be equated for reading as in Kuppen et al. (Reference Kuppen, Huss, Fosker, Mead and Goswami2011) or whether the different groups had developed literacy skills at different rates, a series of one-way analyses of variance (ANOVAs) was run to compare the LIQPR, RL control, and CA control children. Because the LIQGR group was small in number (10 children), the Shapiro–Wilks test was used to check the normality of the LIQGR distributions. This showed that PSTM, intensity ABABA, duration, and frequency were not normally distributed, and so a nonparametric test, the Mann–Whitney U, was used for comparisons with the LIQGR group. For ease of reporting, the Mann–Whitney U is reported for all LIQGR comparisons here, although t tests were also used to compare performance on the other measures. In all cases, the t tests gave the same outcome as the Mann–Whitney U test. The ANOVAS comparing the LIQPR, RL control, and CA control children showed that, as would be expected, the RL control group had a significantly lower mean age compared to the CA controls and the LIQPRs, age F (2, 72) = 44.21, p < .001 (Newman–Keuls post hoc tests). In contrast, for reading age in months, the RL controls were significantly different from the CA controls, but not from the LIQPRs, F (2, 72) = 43.16, p < .001. This indicated that the RL control children had not progressed significantly faster in reading than the LIQPR children, since both groups were also equated for reading age at Time 1. As would be expected, the LIQPRs performed more poorly than both the CA and the RL control groups on the standardized measures, which take age into account. Here, the LIQPRs were significantly different from the CA controls (p < .001) and the RL controls (p < .001) for blocks (WISC), F (2, 72) = 21.95, p < .001; BAS reading, F (2, 72) = 44.95, p < .001; and TOWRE PDE, F (2, 72) = 24.97, p < .001.
For the LIQGRs and the CA controls, the Mann–Whitney U tests showed no significant differences for age (U = 111.00, N1 = 10, N2 = 27, p = .43), BAS reading age in months (U = 88.50, N1 = 10, N2 = 27, p = .11), BAS reading ability (U = 91.00, N1 = 10, N2 = 27, p = .14), or TOWRE PDE (U = 87.50, N1 = 10, N2 = 27, p = .11). Hence, as at Time 1, the LIQGRs were performing as well as the CA controls. However, the CA controls were significantly better than the LIQGRs on the nonverbal IQ measure (blocks, U = 70.00, N1 = 10, N2 = 27, p < .05) and also on the BPVS (U = 32.50, N1 = 10, N2 = 27, p < .001).
When the LIQGR group was compared to the LIQPR group, no significant differences were found in age (U = 98.50, N1 = 10, N2 = 24, p = .42) or blocks (U = 89.00, N1 = 10, N2 = 24, p = .24), thus maintaining the matching variables used at Time 1 (age and IQ matched). Receptive vocabulary was also equivalent at Time 2 (BPVS U = 112.50, N1 = 10, N2 = 24, p = .92). However, there was a significant group difference for BAS reading age (U = 28.50, N1 = 10, N2 = 24, p < .001), BAS reading ability (U = 6.50, N1 = 10, N2 = 24, p < .001), and TOWRE PDE (U = 18.50, N1 = 10, N2 = 24, p < .001). Hence, literacy skills were still significantly different between the two low IQ groups.
In summary, the measures used to equate children at Time 1 have been largely stable by group. The children in the LIQGR group are still comparable to the CA controls on all of the standardized measures of reading and nonword reading. The children in the LIQPR group are still comparable to the RL controls in terms of reading age. Hence, both groups of low IQ children have kept pace with their typically developing matched group (LIQGRs with the CA controls, LIQPRs with the RL controls). However, there are some signs that the pace of progress in reading is plateauing for the low IQ children. The absolute progress in reading for the LIQGRs was only 6 months over a calendar period of 13 months, while for the LIQPRs it was 13 months over a calendar period of 18 months. This may indicate a slower rate of reading development in the low IQ children. When comparing the low IQ good and poor readers, the LIQPRs are still performing significantly more poorly on the reading measures, but both groups are still equally poor at the test of receptive vocabulary (BPVS), the one measure for which the LIQGRs differ from the CA controls. These findings replicate those reported in Kuppen et al. (Reference Kuppen, Huss, Fosker, Mead and Goswami2011) and indicate that vocabulary has not improved over time for the LIQGR children, despite their better decoding abilities.
Phonological measures: Performance at Time 2
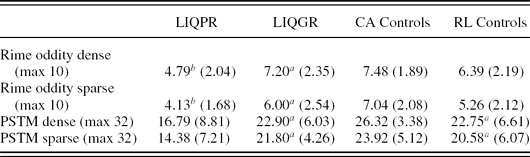
Group performances on the phonological measures are given in Table 7. The phonological deficit in LIQPRs as presented in Kuppen et al. (Reference Kuppen, Huss, Fosker, Mead and Goswami2011) is again notable, suggesting stability over time. All groups seem to perform more accurately in high neighborhood density trials. This is evident on both the newly administered RO task and the readministered PSTM task. A one-way ANOVA by group (CA control, LIQPR, RL control) revealed a significant main effect of density for each task, RO: F (1, 71) = 15.82, p < .001, η2 = 0.18; PSTM: F (1, 70) = 22.37, p < .001, η2 = 0.24. Present on both tasks was a significant main effect of group, RO: F (2, 71) = 14.84, p < .001, η2 = 0.30; PSTM: F (2, 70) = 15.56, p < .001, η2 = 0.31. In this three-group analysis, Bonferroni post hoc tests identified the LIQPRs as continuing to show significantly poorer skills than the CA controls on both tasks. However, they were also significantly poorer than the younger RL controls. At Time 1, phonological awareness skills (oddity onset judgment) had been equivalent, although PSTM skills had not (LIQPRs significantly poorer). As in Kuppen et al. (Reference Kuppen, Huss, Fosker, Mead and Goswami2011), group status did not interact with neighborhood density in either task.
Number of correct trials (oddity) and items (PSTM) for phonological tasks
Note: Standard deviations in parentheses. LIQ, low IQ; PR, poor readers; GR, good readers; CA, chronological age equated typically developing children; RL, reading level equated typically developing readers; max, total number of trials; PSTM, phonological short-term memory.
aEquivalent to CA.
bSignificantly different from CA.
The nonparametric analyses comparing the LIQGRS to the CA controls and to the LIQPRs found that the LIQGRs were not significantly different from the CA controls on the RO (U = 115.50, N1 = 10, N2 = 27, p = .51) or the PSTM task (U = 79.50, N1 = 10, N2 = 25, p = .10). However, LIQGRs were significantly better than the LIQPRs on both phonological tasks (RO: U = 56.50, N1 = 10, N2 = 24, p < .05; PSTM: U = 46.00, N1 = 10, N2 = 24, p < .01).
The phonological analyses showed that the LIQPR group children were stable over time in having phonological skills that were significantly poorer than the CA controls and the LIQGRs, but they were not stable with respect to comparisons with the younger RL children. In the oddity task used at Time 1 (oddity onset judgment), the RL control children performed at a similar level to the LIQPRs. In the oddity task used here (oddity rhyme judgment), the RL controls were significantly better than the LIQPRs. At Time 1, the RL control children were significantly better than the LIQPR children in the PSTM task. They maintained that superior memory performance here. The LIQGRs continued to perform significantly more accurately than the LIQPRs in both the phonological awareness and the phonological memory tasks, but as at Time 1, they performed at the same level as the CA controls in both tasks. Hence, group differences in phonological skills are largely stable over time, but the LIQPR children have fallen further behind the younger children with typical IQ (the RL controls). Given the slower development of phonological skills in the LIQPR group, it may be that a further follow-up at a future time point would also find them falling behind the RL controls in absolute reading attainment.
Auditory measures at Time 2
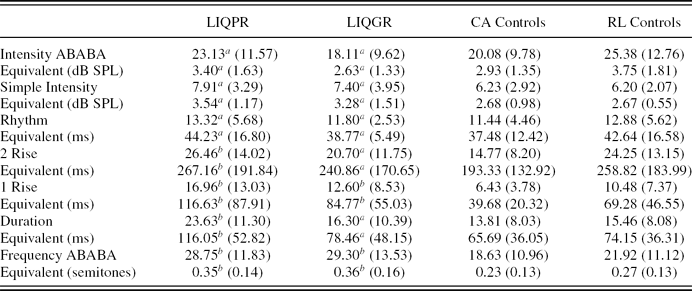
To identify outliers on the auditory measures, the boxplot function from the Statistical Package for the Social Sciences was used, and values outside the three interquartile range from the box were removed. No outliers were identified for intensity ABABA, simple intensity, rhythm, duration, or frequency. However, similar to Kuppen et al. (Reference Kuppen, Huss, Fosker, Mead and Goswami2011), the distribution for frequency was bimodal. A cutoff of 25 (1.18 semitones) was used to code performance dichotomously. Outliers were identified in the two rise (one CA child) and one rise (one CA child) tasks. The mean performance by group for the auditory tasks after the removal of these outliers is provided in Table 8. Here it can be seen that LIQPRs have consistently higher thresholds (i.e., reduced auditory sensitivity) compared to CA children. This is also the case when considering the RL controls. With the exception of the simple intensity task, where the two groups performed at the same level, younger RL controls appear consistently to demonstrate lower auditory thresholds than their older reading-impaired peers, possibly suggesting an effect of reading experience on auditory discrimination, at least for the auditory variables measured here.
Mean auditory thresholds by group
Note: Standard deviations are in parentheses. Threshold equivalents to Probit values are provided. LIQ, low IQ; PR, poor readers; GR, good readers; CA, chronological age equated typically developing readers; RL, reading level equated typically developing readers; SPL, sound pressure level.
aEquivalent to CA.
bSignificantly different from CA.
As in Kuppen et al. (Reference Kuppen, Huss, Fosker, Mead and Goswami2011), and for ease of comparison with that report, a series of one-way ANOVAs was run comparing the performance of the CA controls and the LIQPRs. If maturation alone determines auditory performance, thresholds should be comparable. Using a traditional cutoff alpha of 0.05, the poor readers had significantly higher thresholds on the two rise, F (1, 48) = 13.20, p = .001, η2 = 0.22; one rise, F (1, 45) = 13.87, p = .001, η2 = 0.24; duration, F (1, 49) = 12.99, p = .001, η2 = 0.21; and frequency, F (1, 49) = 10.06, p < .01, η2 = 0.17, tasks. All of these differences had been significant at Time 1 (Kuppen et al., Reference Kuppen, Huss, Fosker, Mead and Goswami2011) with the exception of duration discrimination. On the simple intensity task (not used at Time 1), this relationship approached significance, F (1, 47) = 3.60, p = .064, η2 = 0.07. Mean thresholds were not significantly different on the intensity ABABA, F (1, 46) = .97, p = .33, η2 = 0.02, and rhythm, F (1, 47) = 1.68, p = .20, η2 = 0.03 tasks, although thresholds in the LIQPR group were higher. Both tasks had been performed significantly better by the CA controls at Time 1. Hence, stability over time was present for the one rise, two rise, and frequency tasks only, where the LIQPRs continued to show deficits in auditory sensitivity.
To control the overall false discovery rate for the series of tests to below 5%, a two-stage adaptive linear step-up procedure as advocated by Benjamini, Krieger, and Yekutieli (Reference Benjamini, Krieger and Yekutieli2006) was used. In this procedure all of the p values are lined up in ascending order, and each p value is assigned a number, for example, (1–3) p = .001, (4) p = .01, (5) p = .06, (6) p = .20, (7) p = .33. Where p is less than the alpha (0.05), divided by the number of tests (7), times the number assigned in the ascending line-up (i.e., 1–7), the null hypothesis is rejected. By this method the previously identified significant differences were confirmed (two rise, one rise, duration, and frequency). Therefore, the LIQPRs showed age-inappropriate and reduced sensitivity to rise time, frequency, and duration. However, in contrast to Time 1, rhythm perception and intensity discrimination thresholds (intensity ABABA) were now not statistically different from the thresholds of higher IQ children of the same age who were better readers.
As in Kuppen et al. (Reference Kuppen, Huss, Fosker, Mead and Goswami2011), to identify the severity of the difficulties experienced by the LIQPRs, a bottom 5th percentile cutoff was calculated for each auditory measure using the performance of the CA control group (following the procedure of Ramus, Pidgeon, & Frith, Reference Ramus, Pidgeon and Frith2003). This enabled us to assess whether group differences were caused by poor performance in a few LIQPRs only and whether the identity of those falling below the cutoff would be stable over time. For the rise time tasks, 62.5% (15 out of 24 LIQPR children) fell below this criterion on the two rise task and 58.3% (14 out of 24) fell below it on the one rise task. For the intensity ABABA task, this was 20.8% (5 out of 24), for the simple intensity task it was 17.4% (4 out of 23), for rhythm 13.6% (3 out of 22), for duration 54.2% (13 out of 24), and for the frequency task 37.5% (9 out of 24). Therefore, the tasks that posed difficulties for the largest numbers of LIQPRs were the rise time and duration measures. Regarding the one rise task, 10 out of the 14 children had been previously identified as being below the bottom CA 5th percentile at Time 1, suggesting stability of impairment. The comparable figure for the two rise task was 9 out of 15, for the duration task 4 out of 13, and for the rhythm task 3 out of 3. No children fell below the cutoff at Time 1 on the frequency or intensity tasks. Hence, the rise time measures were the auditory measures showing the greatest stability over time for those LIQPRs who were most severely affected.
Group differences between auditory performance for the LIQGRs and the CA controls were explored using nonparametric Mann–Whitney U tests. In contrast to Time 1, the LIQGRs did demonstrate a significantly higher threshold (poorer performance) than the CA controls on the one rise task, U = 58.00, N1 = 10, N2 = 23, p = .03. They also showed a significantly higher group threshold for frequency, U = 72.00, N1 = 10, N2 = 27, p = .03, as also found at Time 1. However, significance was not retained for either measure when using the Benjamini et al. (Reference Benjamini, Krieger and Yekutieli2006) procedure. The other measures showed no significant differences between the LIQGRs and the CA controls, namely, intensity (intensity: ABABA, U = 88.50, N1 = 9, N2 = 24, p = .44; simple intensity: U = 112, N1 = 10, N2 = 26, p = .53); rhythm: U = 120.50, N1 = 10, N2 = 27, p = .63; two rise: U = 92.00, N1 = 10, N2 = 26, p = .19; and duration: U = 121.00, N1 = 10, N2 = 27, p = .65. Hence, the stability of auditory processing over time for the LIQGR group was good. As in Kuppen et al. (Reference Kuppen, Huss, Fosker, Mead and Goswami2011), auditory processing skills were numerically but not statistically different when comparing the CA controls and the low IQ children who were good readers, despite the large differences in IQ. The LIQGRs and the CA controls were also still statistically equivalent in single word reading. Hence, relations for the LIQGR group were stable over time at this test point, even though mean group reading performance was now only 10 months ahead of CA (compared to 17 months ahead at Time 1).
A comparison of the auditory performance of the LIQPRs and the RL controls was also undertaken. It is worth reminding the reader that these two groups were still equated for mean reading age but that the RL group now demonstrated significantly better phonological processing ability as measured by both phonological measures (oddity and the PSTM). At Time 1, the RL control group children were not significantly different from the LIQPR group for any auditory measure (Kuppen, Reference Kuppen2010). However, given their stronger progress in phonological processing, it might be expected that the auditory processing measures would now also show some significant differences between the younger RL children and the LIQPRs. A series of one-way ANOVAs comparing the LIQPRs and the RL controls revealed that the LIQPRs at the current time point had significantly higher thresholds on the one rise, F (1, 45) = 4.35, p < .05, η2 = 0.09; duration, F (1, 46) = 8.30, p < .01, η2 = 0.15; and frequency tasks, F (1, 46) = 4.52, p < .05, η2 = 0.09, with simple intensity also approaching significance, F (1, 41) = 4.03, p = .051, η2 = 0.09. The LIQPRs and the RL controls performed at a statistically equivalent level on the remaining auditory tasks: intensity ABABA, F (1, 46) = 0.41, p = .53, η2 = 0.01; rhythm, F (1, 44) = 0.07, p = .79, η2 = 0.002; and two rise, F (1, 46) = 0.32, p = .58, η2 = 0.007. However, significance was not retained for the one rise and frequency measures when using the Benjamini et al. (Reference Benjamini, Krieger and Yekutieli2006) procedure. Hence, the auditory measure most strongly related to the development of phonological processing distinct from reading may be duration.
It was also decided to compare whether the CA and the RL control groups would differ for any of the auditory processing measures. This was not done by Kuppen et al. (Reference Kuppen, Huss, Fosker, Mead and Goswami2011), because the default assumption is that younger children will always show higher thresholds than older children in sensory tasks (e.g., Ramus, White, & Frith, Reference Ramus, White and Frith2006: “a reading age [and therefore younger] control group could only have poorer sensorimotor performance” [p. 266]). If reading experience rather than maturation affects auditory development, then it is possible that for some auditory measures the RL controls might no longer be significantly poorer than the CA controls. It is also possible in this scenario that both groups have reached adult levels in their task performance. A series of one-way ANOVAs comparing CA and RL controls found a significant group difference for the rise time tasks only: two rise, F (1, 48) = 9.52, p < .01; one rise, F (1, 44) = 5.49, p < .05. On all other tasks, these two groups were statistically equivalent: intensity, F (1, 46) = 2.60, p = .11; simple intensity, F (1, 44) = 0.002, p = .97; rhythm, F (1, 49) = 1.03, p = .32; duration, F (1, 49) = 0.53, p = .47; and frequency, F (1, 49) = 1.13, p = .29. However, significance was only retained for the two rise measure when using the Benjamini et al. (Reference Benjamini, Krieger and Yekutieli2006) procedure.
Finally, LIQGR and LIQPR performances were compared. At Time 1, the LIQGRs had shown significantly lower thresholds than the LIQPRs for the one rise and the intensity ABABA measures. This was interpreted to show that these two auditory measures were particularly important for the development of intact reading skills when IQ was low. As will be recalled, the LIQGRs at Time 2 still had superior reading and phonological skills to the LIQPRs. Nevertheless, at the current test point, the LIQGRs demonstrated statistically equivalent auditory thresholds to the LIQPRs in all auditory tasks, despite having numerically lower thresholds. Mann–Whitney U tests showed no significant differences in intensity ABABA, U = 75.50 N1 = 9, N2 = 24, p = .19; simple intensity, U = 103.50, N1 = 10, N2 = 23, p = .66; rhythm, U = 100, N1 = 10, N2 = 22, p = .70; two rise, U = 87, N1 = 10, N2 = 24, p = .22; one rise, U = 98.5, N1 = 10, N2 = 24, p = .42; duration, U = 72.00, N1 = 10, N2 = 24, p = .07; and frequency, U = 111.00, N1 = 10, N2 = 24, p = .75. However, because the numerical value of mean thresholds in the LIQPR group was consistently lower than that of the mean thresholds in the LIQGR group, these null effects are difficult to interpret. In addition, as noted by Kuppen et al. (Reference Kuppen, Huss, Fosker, Mead and Goswami2011), the small size of the LIQGR group makes it difficult to draw any strong conclusions.
Overall, the group comparisons suggest that auditory processing skills were relatively stable over time for all groups regardless of IQ. Once the Benjamini et al. (Reference Benjamini, Krieger and Yekutieli2006) procedure was applied, significant differences were found between the LIQPRs and the CA controls for rise time, duration, and frequency, and between the LIQPRs and the RL controls for duration. At Time 1, the LIQPRs had differed from the CAs for all auditory measures (except for duration for the CA comparison). For the LIQGRs, auditory sensitivity compared to the CA controls was statistically equivalent for all measures except frequency, as at Time 1. Within the low IQ cohort, the LIQPRs no longer showed significantly higher thresholds for rise time and intensity compared to the LIQGRs, instead showing statistically equivalent thresholds for all measures. However, auditory thresholds were uniformly lower in the low IQ children who were poor readers. Although the small group size for the LIQGRs precludes strong conclusions, the data suggest that sensitivity to frequency is strongly tied to IQ, suggesting that the group differences for frequency between the CA controls and the LIQPRs depend on IQ differences rather than reading differences. Finally, the LIQPRs showed the most severe and consistent auditory deficits in the rise time measures (around 60% of LIQPRs were below the 5th percentile of the CA control distribution for the one rise and two rise tasks). This was followed by duration (55% of LIQPRs were below the 5th percentile). Overall, therefore, the auditory measures most consistently associated with reading and phonology across all the group comparisons were the rise time and duration measures.
However, the group comparisons may be affected by the different amounts of time that had elapsed between Time 1 and Time 2 for the different groups (RL control group, average 10.4 months; CA control and LIQGR groups, 13.0 and 13.3 months, respectively; LIQPR group, 18.4 months). In order to ensure that the time elapsed was not affecting the conclusions drawn about auditory sensitivity, a series of repeated measures 3 × 2 (Group × Time Point) analyses of covariance (ANCOVAs) was run on the auditory threshold data. Simple intensity was not included in these ANCOVAs because it was not administered at Time 1. In these analyses, reader group was the between-subjects measure, time point (Time 1 vs. Time 2) was the within-subjects variable, and time elapsed between each time point was the covariate.
The ANCOVAs showed a significant main effect of the covariate for the intensity and rhythm measures only, intensity: time elapsed, F (1, 63) = 7.52, p < .01, η2 = 0.11; rhythm: time elapsed, F (1, 64) = 7.50, p < .01, η2 = 0.11. Time elapsed did not interact with group nor time point, suggesting that the time elapsed affected the mean threshold for the whole cohort for these two tasks. As will be recalled, these were the two measures for which the LIQPR group were no longer significantly poorer than the CA controls in the main analyses, suggesting that this could be due to the longer time elapsed between test points for the LIQPRs (a maturation effect). There was only one significant interaction, which was between time point and the covariate for the two rise task (Time Point × Months Elapsed), F (1, 70) = 4.02, p < .05, η2 = 0.05. For the two rise task, findings were stable from Time 1 to Time 2 in terms of group differences (CA > LIQPR, CA > RL, LIQPR = RL). One possibility is that the younger RL children may also have shown significantly lower thresholds than the LIQPRs for the two rise measure if equal time had elapsed between test points for the two groups. However, since group did not interact with any factors in any of the ANCOVAs, the most important result is that time elapsed played a role in the auditory assessment of intensity and rhythm only. Hence, the earlier conclusion that rise time and duration were the auditory measures most closely related to progress in reading is not affected by the time elapsed factor.
Finally, it was decided to compare the relative importance of rise time, duration, and frequency to progress in reading by computing a longitudinal multiple regression analysis predicting reading at Time 2 when the auditory factors of rise time (one rise), duration, and frequency (dichotomous measure) were all entered into the equation together at the same step. This was done by Kuppen et al. (Reference Kuppen, Huss, Fosker, Mead and Goswami2011) in order to isolate those auditory measures that predicted unique variance in reading development. In this final equation, reading age in months at Time 2 was the dependent variable, age was entered as Step 1, nonverbal IQ (blocks) was entered as Step 2, and then one rise, duration, and frequency (dichotomous) measured at Time 1 were entered together at Step 3. The three auditory variables together accounted for 12% of unique variance in reading (p < .001). As in the concurrent regression reported by Kuppen et al. (Reference Kuppen, Huss, Fosker, Mead and Goswami2011), the significant predictors of reading in this longitudinal analysis were one rise (β = –0.20, p < .05) and duration (β = –0.19, p < .05), but not frequency. If two rise was used as the rise time measure instead of one rise, the findings were very similar (all three variables together accounted for 11% unique variance in reading, p < .001; and the significant predictors were two rise, β = –0.17, p < .05, and duration, β = –0.21, p = .01, but not frequency, β = –0.12, p = .13).
DISCUSSION
The study of children with low IQ who are poor readers is critical for a comprehensive investigation into the fundamental biological mechanisms that might determine whether an individual finds it easy or difficult to learn to read. Earlier we suggested that while IQ may be irrelevant to identifying poor word readers, basic auditory processing might be important. Basic sensory processes, such as hearing, are not usually thought of as related to IQ, but they might be related to specific aspects of cognitive development known to be important for progress in reading, such as phonological skills. In this way, they may be linked to poor reading. Our data suggest that one aspect of auditory processing, sensitivity to frequency (pitch), is related to IQ. This was previously reported for adults by Banai and Ahissar (Reference Banai and Ahissar2004) and for children by Halliday and Bishop (Reference Halliday and Bishop2006). It was also found by Kuppen et al. (Reference Kuppen, Huss, Fosker, Mead and Goswami2011) for this cohort of children and has recently been reported for children in a large cohort of 1,400 participants by Moore, Ferguson, Edmondson-Jones, Ratib, and Riley (Reference Moore, Ferguson, Edmondson-Jones, Ratib and Riley2010).
However, our study also suggests that individual differences in some basic auditory sensory processing measures, namely, sensitivity to sound rise time and sound duration, are not related to IQ but are related to the development of word reading and of phonological awareness. For these two auditory measures, the low IQ children who were poor readers showed consistently impaired performance given their age, both in terms of the number of low IQ children falling below the fifth percentile of the distribution for their age and in terms of sensory measures that revealed significantly poorer sensitivity compared to younger children (the RL controls; although recall that the rise time comparisons did not survive the stringent Benjamini et al., Reference Benjamini, Krieger and Yekutieli2006, correction). The rise time and duration measures were also those identified as unique predictors of progress in word reading by the longitudinal multiple regression analyses. This finding concurs with many previous cross-sectional studies using similar auditory measures that were conducted with children with IQ-discrepancy defined dyslexia (e.g., Goswami, Wang, et al., Reference Goswami, Wang, Cruz, Fosker, Mead and Huss2011; Richardson et al., Reference Richardson, Thomson, Scott and Goswami2004) and with one previous longitudinal study of typically developing children with typical IQ (Corriveau et al., Reference Corriveau, Goswami and Thomson2010).
The data also showed that absolute progress in reading-related skills for the LIQPRs appeared to be getting weaker over time. We found here that the LIQPRs had been outstripped in progress in phonological development by the younger RL-matched children, even though the LIQPRs were tested after a gap of 18 months from Time 1 and the RLs were tested after a gap of 10 months. The younger RL group was now statistically superior in all phonological measures. Further, the LIQPRs showed 13 months of progress in reading over an 18-month period, while the RL controls made 11 months of progress over 10 calendar months. The age-matched comparison revealed that the CA controls made 16 months of progress over 13 calendar months. Therefore, both of the typically developing groups gained more months of progress in word reading relative to time elapsed since Time 1, while the LIQPRs gained fewer months of progress relative to time elapsed. The LIQPRs also showed significantly less development from Time 1 in terms of sensitivity to rise time, duration, and frequency compared to the younger RL controls. This is despite the LIQPRs having had more time to develop auditory sensitivity (8 extra months). As noted earlier, only the RL auditory threshold for duration remained significantly lower than the LIQPR threshold after the Benjamini et al. (Reference Benjamini, Krieger and Yekutieli2006) correction. Nevertheless, it seems likely that a further follow-up in the future, equating time elapsed since Time 1 for the LIQPRs and the RLs, would find that the younger children now also showed significantly lower auditory thresholds. In an ongoing longitudinal study of dyslexia, by the age of 11, the children with dyslexia had significantly higher rise time thresholds than younger RL controls who were then 9 years old (Goswami, Huss, Mead, Fosker, & Verney, Reference Goswami, Huss, Mead, Fosker and Verney2012).
The low IQ children who were good single-word readers also appeared to show trends suggestive of weaker absolute progress. Their reading had developed on average by only 6 months in 13 months, compared to 16 months on average for the CA controls, even though the groups were still equated statistically for word decoding skills. It may be that a further follow-up would reveal plateau effects for reading development. Hence, while variation in basic auditory processing might be indicative of brain-based differences that determine progress in word reading irrespective of IQ, IQ may itself play a role in the continued development of reading once competent decoding skills have been acquired by low IQ children with intact auditory processing. As discussed in Kuppen et al. Reference Kuppen, Huss, Fosker, Mead and Goswami2011, poor vocabulary skills associated with low IQ could be contributing to poor reading development. In addition, the poor receptive vocabulary skills shown by both low IQ groups may suggest that these children have more general language impairments and also are not reading very much (see Kuppen, Reference Kuppen2010). Investigations into individual variation in children's vocabularies suggest reading volume may be a primary factor in vocabulary development (Cunningham & Stanovich, Reference Cunningham and Stanovich2001; Hayes, Reference Hayes1988). We are currently investigating the development of reading comprehension in the same reader groups studied here.
As noted previously, the LIQGRs continued to show significantly weaker receptive vocabulary skills (BPVS) compared to the CA controls, despite still having statistically equivalent auditory, phonological, and decoding abilities. Other language skills, such as semantic and syntactic knowledge, as well as phonological skills, may thus be important in determining overall reading progress. One model of reading development, Share's self-teaching hypothesis (Reference Share1995), suggests that the ability to decode new words may be reliant on a child's level of vocabulary. For example, decoding an irregular word such as have using regular grapheme–phoneme correspondences will produce a pronunciation rhyming with gave (/haev/). Knowing that this latter pronunciation is not a real word may help children to teach themselves to decode the word correctly (example taken from Harlaar, Hayiou-Thomas, Dale, & Plomin, Reference Harlaar, Hayiou-Thomas, Dale and Plomin2008). According to Share, children may also make use of sentence context and grammatical rules to read new words. However, Snowling and Hulme (Reference Snowling, Hulme, Snowling and Hulme2005) suggest the use of such strategies may be problematic for children with language difficulties. Low IQ children, similar to children with specific language impairments, may also lack sensitivity to the grammar and context of language, factors that might help to activate the appropriate semantic and phonological representations in typically developing readers. Such a contention is supported by the triangle model proposed by Seidenberg and McClelland (Reference Seidenberg and McClelland1989). This framework suggests that while early reading development relies heavily on the mapping of letters to sounds, children with semantic weaknesses may have difficulties with the later stages of learning to read. Particular difficulties may arise with more advanced reading abilities such as decoding irregular words and developing automatic word recognition skills (Snowling & Hulme, Reference Snowling, Hulme, Snowling and Hulme2005).
Recent findings in the literature on IQ-discrepancy defined dyslexia are also relevant to this point. Studies from Shaywitz and colleagues (Reference Shaywitz, Escobar, Shaywitz, Fletcher and Makuch1992) of relatively large cohorts of children show a decoupling of IQ and reading development between the ages of 5 and 17. Matthew effects, where the capable student becomes more capable and the struggling student falls further behind his classmates (Stanovich, Reference Stanovich1986), have been demonstrated in both reading and IQ for IQ-discrepancy defined poor readers (Ferrer, Shaywitz, Holahan, Marchione & Shaywitz, Reference Ferrer, Shaywitz, Holahan, Marchione and Shaywitz2010). Such theoretical models carry strong implications for definitions of poor reading. A child assessed as presenting a “specific” reading difficulty at age 6 may easily cross arbitrary division lines to become a LIQPR later in development. Thus, a child detected later in development as struggling with literacy may not qualify for additional support within local education statement guidelines, simply owing to the timing of the assessment.
In conclusion, the results presented here generally support our earlier conclusions (Kuppen et al., Reference Kuppen, Huss, Fosker, Mead and Goswami2011) that word reading ability is determined by individual differences in auditory processing and phonological skills rather than by individual differences in IQ. These findings support the theoretical view expressed by many over the past 30 years that IQ is irrelevant to the definition of reading disability (Fletcher, Francis, Rourke, Shaywitz, & Shaywitz, Reference Fletcher, Francis, Rourke, Shaywitz and Shaywitz1992; Siegel, Reference Siegel1989; Vellutino, Fletcher, Snowling, & Scanlon, Reference Vellutino, Fletcher, Snowling and Scanlon2004). Poor progress in word reading is associated with quite specific sensory and cognitive factors, namely, auditory and phonological skills, which are not in themselves dependent upon IQ. Further, we argue here that impaired sensory processing of sound rise time and sound duration may be an underlying biological mechanism in reading disability regardless of IQ. As noted also by Hämäläinen et al. (Reference Hämäläinen, Salminen and Leppänen2012), these auditory parameters are important for perceiving the prosodic structure of the speech stream. As well as poor readers with high and low IQ showing similar information-processing mechanisms with respect to word recognition and similar response to treatment (Stanovich, Reference Stanovich1999), our data indicate that poor readers with high and low IQ show similar basic auditory processing deficits (Kuppen et al., Reference Kuppen, Huss, Fosker, Mead and Goswami2011; Richardson et al., Reference Richardson, Thomson, Scott and Goswami2004). These findings also have important implications for educational provisions. Specifically, we may be confident that IQ-discrepancy definitions have no place in assessing suitability for literacy-related statutory educational support. Children with low IQ who are poor readers are equally deserving of supplementary support, whether their literacy difficulties are defined as “specific” or not.
APPENDIX A
To aid in obtaining an accurate threshold of auditory sensitivity, an adaptive staircase procedure (Goswami, Wang, et al., Reference Goswami, Wang, Cruz, Fosker, Mead and Huss2011) was used. This was a combined 2-up 1-down and 3-up 1-down procedure, which changed to a 2-up 1-down after two reversal points (a reversal point is a correct answer followed by an incorrect answer or vice versa). To present stimuli within the area of interest as quickly as possible, the step size halved after the fourth and sixth reversal points. Trials typically terminated after the eighth reversal point or after a maximum of 40 trials, whichever was shorter. The threshold score was then calculated using the measures from the last four reversal points. Due to concerns over successfully identifying a threshold for low IQ children, a probit function was used, which, in combination with a 3-up 1-down staircase, allowed a 79.4% correct point to be calculated. The threshold therefore indicated a 79.4% chance that at the identified discrimination point the child would answer the next trial correctly.
Rise time, one amplitude envelope (one rise task)
For this task, three 800-ms tones were presented where the second stimulus was always a standard tone. The standard had a 15-ms linear rise time envelope, a 735-ms steady state, and a 50-ms linear fall time. The standard was also presented for a second time in either the first or third position. The remaining tone was selected in an adaptive manner from a continuum of stimuli that varied the linear rise time envelope, with the longest rise time being 300 ms. Children were introduced to three cartoon dinosaurs. It was explained that each dinosaur would make a sound and that the child's task was to decide which dinosaur's sound had a softer rising sound than the others (longer rise time). The concept of a “softer rising sound” was reinforced by actions performed by the researcher. A soft brushing movement against the table (a softer rising sound) was contrasted with a sharp hand tap.
Rise rove task
This task was run at Time 1 only but is presented here for reference purposes because it appears in the current longitudinal analyses. The rise rove task was identical to the one rise task (AXB delivery), except that the intensity of the sounds varied randomly between 65 and 75 dB, so that intensity was not a complementary cue to rise time.
Rise time, two amplitude envelope (two rise task)
Forty stimuli of 3573 ms (2.5 cycles) in duration were created using a sinusoidal carrier at 500 Hz amplitude modulated at the rate of 0.7 Hz (depth of 50%). A square wave was the basis of the underlying envelope modulation. The presentation format was two-interval forced choice. Rise time was again varied from 15 to 300 ms with a fixed linear fall time of 350 ms. The longest rise time was used as the standard. Children were asked to choose from three single sounds from the dinosaur that had the sharper beat. This corresponded to the sound with the shorter rise time.
Duration discrimination task (AXB)
A continuum of 40 stimuli was created using pure tones. An AXB format was used where the standard tone, presented second, was 400 ms. A repetition of the standard was presented again in either the first or the third position, and the length of the longer adaptively selected tone ranged up to 600 ms. Each tone was presented at 500Hz with a 50 ms rise and fall. Children were asked to choose the cartoon sheep that made the longest sound.
Frequency discrimination task (frequency ABABA)
The presentation format for the frequency discrimination task was two-interval forced choice. Two sequences of five tones were presented. In each sequence, five 200-ms sine tones were used with 50-ms rise times, 50-ms fall times, and 50-ms interstimuli intervals. In each trial, one of the two sequences presented tones of a consistent frequency (AAAAA), while the comparison presented a sequence where alternate tones had a higher frequency (ABABA). The task used a continuum of 40 stimuli ranging from 500 to 514 Hz. The task was introduced by explaining that each cartoon bird made a series of sounds. The child was asked to decide which bird made sounds that were not all the same pitch. Demonstrations of tones that were consistent and differing in pitch were provided by the experimenter.
Intensity ABABA discrimination task (intensity ABABA)
The intensity ABABA task employed two sequences of tones in a similar format to the frequency measure. In each sequence five 200 ms sine tones were presented with 50-ms rise times, 50-ms fall times, and 50-ms interstimuli intervals. In one sequence the tones were all of constant intensity 75 dB (AAAAA), whereas in the comparison sequence, alternate tones had reduced intensity (ABABA). The task used a continuum of 40 stimuli that decreased in intensity at constant 1.7% steps from the standard 75-dB tone. It was explained that each cartoon monkey made a series of sounds, and children were asked to identify which monkey made the mixture of loud and soft sounds.
Simple intensity
Children were presented with two tones. The standard was a pure tone with a frequency of 500 Hz presented at 75-dB SPL with a duration of 200 ms and a 50-ms rise and fall. The adaptively selected tone ranged from 55- to 75-dB sound pressure level and represented one of 40 steps. Children were asked to pick the softer sound.
Rhythm discrimination task
Children were again presented with two sequences of five sounds in a two-interval forced choice format. In one sequence a 500-Hz sinusoid with 200-ms duration and 50-ms rise and fall time was presented with equal 150-ms interstimulus intervals. The second sequence had a linearly modified interval between the third and the fourth tones, ranging from 150 to 15 ms, thereby disrupting the isochronous rhythm. Children were told that while one penguin walked in a steady rhythm, the other walked in an unsteady rhythm and had a skip in its step. This distinction was supported by the experimenter tapping on the desk. Children were asked to identify the penguin who demonstrated the unsteady rhythm or “skip.”
Words used in the rime oddity task
Words used in the PSTM task
ACKNOWLEDGMENTS
This research was conducted while the first author held a PhD studentship at the University of Cambridge, supervised by Usha Goswami. Support for this research was partially provided by funding from the Medical Research Council (G0400574). Usha Goswami was also supported by a Major Research Fellowship from the Leverhulme Trust.