INTRODUCTION
A physiological-based description of crop growth can be explained through estimating changes in the total amount of radiation and ‘the efficiency of radiation conversion to dry matter’, which was defined as radiation use efficiency (RUE, g/MJ) by Monteith (Reference Monteith1977). This concept is widely used in crop models to simulate crop dry matter accumulation. RUE can be measured as ‘the slope of the regression of the gross amount of dry matter produced upon the cumulated amount of intercepted light energy’ (Charles-Edwards et al. Reference Charles-Edwards, Doley and Rimmington1986). According to Gallagher & Biscoe (Reference Gallagher and Biscoe1978), RUE values for common C3 plants range from 2·0 to 3·0 g/MJ, while those for C4 plants range from 3·0 to 4·0 g/MJ (Kiniry et al. Reference Kiniry, Jones, O'Toole, Blanchet, Cabelguenne and Spanel1989). RUE is influenced by the combination of light interception and the photosynthetic activity of individual leaves within the canopy, which are affected by environmental and management factors (Foale et al. Reference Foale, Wilson, Coates and Haydock1984; Sinclair & Horie Reference Sinclair and Horie1989; Rosenthal & Gerik Reference Rosenthal and Gerik1991; Rosenthal et al. Reference Rosenthal, Gerik and Wade1993).
Cotton cultivars have shown diverse growth rates, which may be attributable to differences in RUE (Rosenthal & Gerik Reference Rosenthal and Gerik1991). Studies demonstrate that cotton RUE values vary, dependent upon various environmental conditions as well as cultural and management practices. Cultural practices, such as cultivar selection and plant density, were reported to affect RUE (Foale et al. Reference Foale, Wilson, Coates and Haydock1984; Rosenthal & Gerik Reference Rosenthal and Gerik1991; Rosenthal et al. Reference Rosenthal, Gerik and Wade1993). Also, Sinclair & Horie (Reference Sinclair and Horie1989) reported that management practices, such as soil fertilization, could influence the differences in RUE as a result of an influence on photosynthetic activity. Some of the reported RUE values of cotton in the USA are: 2·55 g/MJ for irrigated cv. Acala SJ-2 grown in California (Howell & Musick Reference Howell and Musick1985), 2·3 g/MJ for irrigated cv. Paymaster 2326 grown in Texas High Plains (Ko et al. Reference Ko, Maas, Lascano and Wanjura2005) and 1·5 g/MJ for cv. Acala and 1·3 g/MJ for cv. Tamcot gown in Texas Prairies (Rosenthal & Gerik Reference Rosenthal and Gerik1991).
Charles-Edwards et al. (Reference Charles-Edwards, Doley and Rimmington1986) stated that the amount of photosynthetically active radiation (PAR) intercepted by a plant depends on leaf area distribution, which directly affects the light interception coefficient (k) for Beer's law. According to Monsi & Saeki (Reference Monsi and Saeki1953), k can be described as

where T is transmitted radiation through a canopy, I is incoming radiation, and LAI is leaf area index. Kiniry et al. (Reference Kiniry, Simpson, Schubert and Reed2005) noted that reduced k values are estimated for more upright leaves and allow better light penetration into leaf canopies, eventually causing RUE to increase when biomass is source-limited. This was demonstrated by reports for peanut (Bell et al. Reference Bell, Wright and Harch1993) and diverse C4 grasses (Kiniry et al. Reference Kiniry, Tischler and Van Esbroeck1999). However, it has not been reported that changes in k affect the RUE values for cotton crops.
Since many crop models use RUE and k as their parameters, appropriate values of the parameters must be determined before a crop model is employed. In the present study, 2 years of diverse weather conditions in terms of rainfall were purposely chosen and RUE and k values determined for different cultivars at various irrigation regimes. To validate the parameter RUE in South Texas, crop yield was also simulated using the environmental policy impact calculator (EPIC) crop model with the RUE values determined.
MATERIALS AND METHODS
Field study for parameterization
Cotton was grown on an Uvalde clay soil (fine-silty, mixed, hyperthermic Aridic Calciustolls, with a pH of 8·1) during 2006 and 2007 at Texas A&M AgriLife Research Center in Uvalde, Texas (29·2175 N, 99·7572 W; 283 m asl). In 2006, six commercial cotton varieties from Bayer CropScience (Research Triangle Park, NC, USA) were planted on 11 April: ST5599, ST4892, ST4664, ST4700, ST5007 and 989B2R. Seed density was 20 647 seeds/ha with 1 m between rows; crops were harvested on 7 September. In 2007, four varieties from Bayer CropScience and Delta and Pine Land Company (Scott, MS, USA) were planted on 23 April and harvested on 17 October: ST4554, DP555, DP164 and FM9063. The varieties selected were among those best adaptable to this region from commercially available varieties for both years. After having narrow yield variations among the varieties in 2006, varieties were selected considering more various genetic pools in 2007. The experiments in both years were arranged in a split-block design with each main plot (irrigation) replicated twice and each subplot (variety) replicated three times. A 90° wedge of the centre pivot circled field (c. 4·8 ha) was divided equally into 15° irrigation regimes, which were maintained at 1·00, 0·75 and 0·50 crop evapotranspiration (ETc) values. The varieties were randomly arranged within each main plot.
Irrigation scheduling and ET regimes for the field were imposed according to daily calculations of the standardized ASCE-PM equation (ASCE-EWRI 2005). Actual crop water use requirements for cotton were determined based on the relation to a well-watered reference grass. The equation was as follows:

where Kc is the crop coefficient and ETo is the reference evapotranspiration. ET from a tall fescue grass (Festuca arundinacea Schreb.) with a height of 0·12 m and a surface resistance of 70 s/m was the ETo surface employed in Kc. The total amount of irrigation from seeding to maturity (prior to defoliation) was 487·7 mm in 2006 and 139·7 mm in 2007. During these periods, rainfall recorded was 71·4 mm in 2006 and 575·8 mm in 2007. Weather data, including rainfall and daily solar radiation (SR), were collected at a weather station 150 m from the field.
Measurements of fraction of PAR intercepted, leaf area index (LAI) and plant dry weights were taken on 11 June, 28 June, 16 July and 12 September 2007. PAR interception was measured during the growing season with a 1 m long LI-191SA line quantum sensor (LI-COR Inc., Lincoln, NE, USA). A series of measurements was taken in rapid succession, consisting of 10 PAR readings above the canopy, 10 below the canopy and 10 more above the canopy. While taking the readings below the canopy, the light sensor was moved across the plant row. Measurements were taken between 11:30 and 12:30 central daylight time during times with moderately stable incident SR. Tollenaar & Bruusema (Reference Tollenaar and Bruusema1988) demonstrated that radiation measured near to solar noon can be representative of integrated daily radiation. The fraction of PAR intercepted was determined with the mean values of the above- and below-canopy measurements, respectively.
Destructive samples were taken of biomass accumulation in 1·0 m lengths of row on 31 May (151 days after sowing (DAS)), 20 June (171 DAS), 18 July (199 DAS) and 21 August (233 DAS) in 2006; 11 June (161 DAS), 28 June (179 DAS), 16 July (197 DAS) and 12 September (255 DAS) 2007. A representative plant was randomly selected from each sample and leaf area was measured with a LI-COR LI-3100 leaf area meter (LI-COR Inc., Lincoln, NE, USA). The plants were weighed after being dried in a forced-air drying oven at 70°C until the weight stabilized. Leaf area of the entire sample was calculated from the leaf area of the one plant and the ratio of the total dry weight of all plants divided by the dry weight of the one plant. Based on these techniques, values for LAI, above-ground dry weight (AGDW) and intercepted PAR were derived.
Light interception coefficients (k) were calculated from transmitted (T) and incoming (I) PAR data. Values for k were calculated for each variety as

Daily radiation intercepted by the canopy was calculated from the determined k, incoming and reflected PAR, and interpolated LAI estimated between radiation measurements. Incoming PAR was assumed to be 0·45 of daily total SR (Monteith Reference Monteith1965; Howell et al. Reference Howell, Meek and Hatfield1983; Meek et al. Reference Meek, Hatfield, Howell, Idso and Reginato1984). RUE was calculated from the slope of the AGDW (g/m2) as a function of accumulated intercepted PAR (MJ/m2).
Simulation study
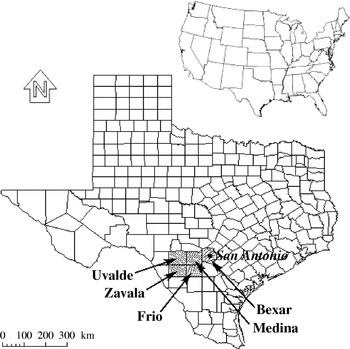
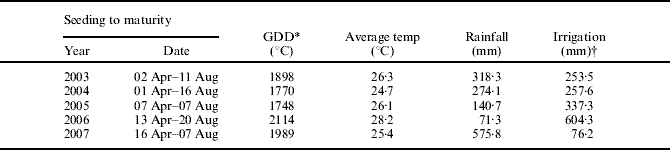
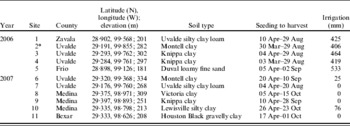
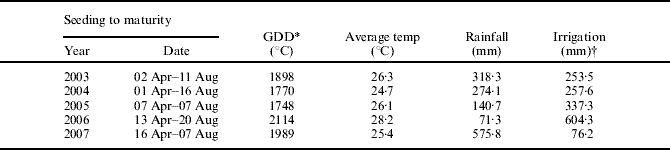
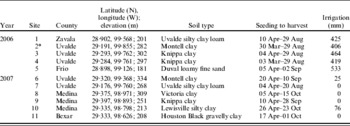
Two different types of field data sets were used: a set of field data collected on a research field of Texas A&M AgriLife Research Center in Uvalde, Texas, in 2003, 2004 and 2005; and a set of field data collected on farm fields at three counties of South Texas in 2006 and 2007 (Fig. 1). Cotton cultivar ST4892 (Bayer CropScience) was grown at the Research Center field for the 3 years. Cumulative growing degree days (GDD), general weather conditions and total amounts of irrigation during each crop season are summarized in Table 1. Cotton lint yield was determined by randomly sampling and harvesting 3 m2 for each plot. For the grower's field data, detailed information on each field and its cultural practices are summarized in Table 2. Cotton lint yield was determined based on the measurement of total lint harvested from each field.
Map of the region where cotton data were obtained for parameterization and simulation.

Summary of weather conditions and irrigation amounts during each cotton growing season at Texas AgriLife Research Center at Uvalde, Texas
* GDD, growing degree days, above a base temperature of 12°C.
† Total amounts of irrigation. Irrigation rates based on in-field-calculated ETc rates.
Summarized information of farms and their cropping practices in 2006 and 2007 used in crop simulation
* Two fields were used from this site.
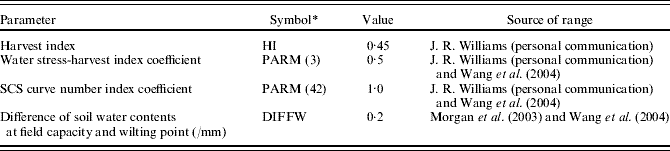
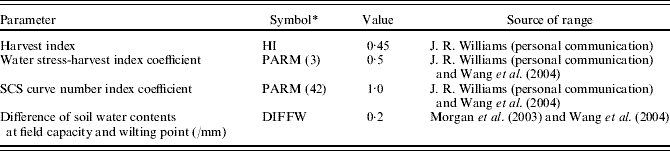
The EPIC model (Williams et al. Reference Williams, Jones and Dyke1984) was employed in the present simulation study. EPIC includes physiologically based components to simulate erosion, plant growth and related processes. Model components include weather, hydrology, erosion, nutrient cycling, soil temperature, crop growth, tillage, pesticide fate, economics and plant environmental control. The plant growth model in EPIC (Williams et al. Reference Williams, Jones, Kiniry and Spanel1989) simulates agronomic crops, pastures and trees, with each crop having unique values for the model parameters. Values of several yield-related parameters (Wang et al. Reference Wang, Williams, Izaurralde and Atwood2004) used for crop simulation in the present study are listed in Table 3. The harvest index (HI) is the ratio of economic yield to the above-ground biomass. The water stress-harvest index, PARM(3), sets the fraction of growing season when water stress starts to reduce the HI. The Soil Conservation Service (SCS) curve number index coefficient, PARM(42), regulates the effect of potential evapotranspiration in driving the SCS curve number retention parameter. The retention parameter impacts runoff volume and changes with soil water content. The differences in soil water content for each layer between field capacity and wilting point (DIFFW) impact water storage for plant use and water stress factor for crop growth.
Yield-related EPIC parameters used
* Parameter symbols used in the EPIC model.
Weather data used in the simulations were collected with a standard Campbell Scientific meteorological station (Campbell Scientific Inc., Logan, UT, USA) at each location and are available at the Texas AgriLife Research and Extension Center website (http://uvalde.tamu.edu/weather/weather.php, verified 12 November 2008). Simple linear regression and paired t-test were analysed using PROC REG and PROC TTEST (SAS version 9.1, Cary, NC, USA), respectively.
RESULTS
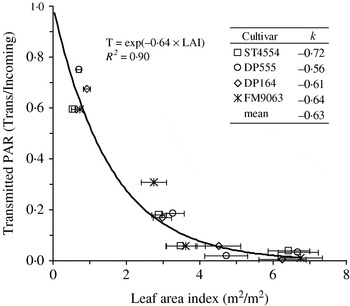
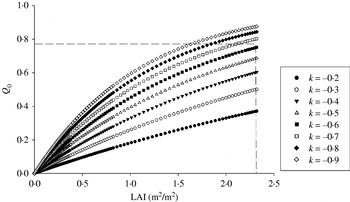
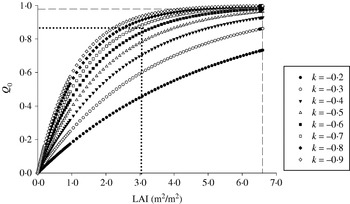
Values of the light interception coefficient (k) obtained for different cultivars under different irrigation treatments in 2007 ranged from −0·56 to −0·72 (Fig. 2). The mean value of k determined with Eqn (3) was −0·63, which generally matched the one estimated with the relationship between fractional transmitted radiation and LAI. A k value in 2006 was determined based on the relationship between the proportion of the daily light energy intercepted by the crop canopy (Q 0=1−e−k·LAI) and k values (Fig. 3), assuming that the Q 0 value agreed with the measured cotton canopy cover in the field. This estimation method was previously used by Ko et al. (Reference Ko, Maas, Lascano and Wanjura2005). In the present study, the k estimate was c. −0·65 when the crop canopies fitted to the maximum LAI value (2·3 m2/m2).
Fraction of transmitted PAR as a function of LAI and light extinction coefficients (k) for Beer's law for each cultivar using data obtained in 2007. Horizontal bars represent errors at 95% confidence interval. The empirically obtained estimate of k is presented in the table and the regression is presented for a support purpose.

Ratio of the daily light energy intercepted by a canopy (Q 0) v. LAI for different light extinction coefficient (k) values from −0·2 to −0·9 using data obtained in 2006. The dashed horizontal line represents the crop canopy at the maximum LAI value (the dashed vertical line).

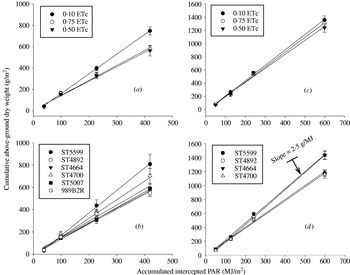
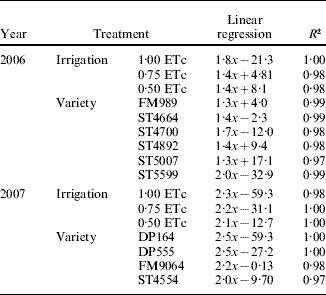
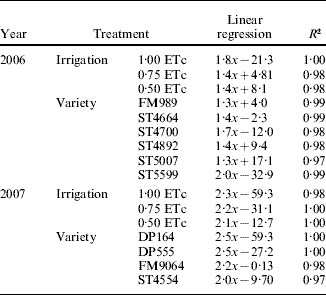
To obtain RUE, accumulated intercepted-radiation was compared with AGDW for each irrigation treatment and each cultivar (Fig. 4). As plant biomass increased, significant differences in AGDW were found between 1·00 and 0·50 ETc treatments as well as among the cultivars. However, there were no interactions between irrigation and cultivar, either in 2006 or 2007. Slopes of the linear relationships represent RUE values for irrigation treatments and different cultivars, showing average values of 1·5 g/MJ in 2006 and 2·2 g/MJ in 2007. RUE values in 2007 ranged from 2·0 to 2·5 g/MJ, while those in 2006 ranged from 1·3 to 2·0 g/MJ (Table 4). Since an RUE estimate is considered to be determined for crops under environmentally unperturbed conditions, the maximum value (2·5 g/MJ) found was tentatively determined as an RUE parameter of cotton grown under the South Texas conditions.
Cumulative AGDW as a function of cumulative absorbed PAR for different irrigation treatments and varieties in 2006 (a and b) and 2007 (c and d). RUEs are the slopes of the relationships: solid lines for all data (1·5 and 2·2 in 2006 and 2007, respectively) and dashed lines for smallest and largest values (detailed results presented in Table 4). Vertical bars represent errors at 95% confidence interval (n=16 and 12 for irrigation and cultivar, respectively).

Linear relationships between cumulative AGDW and accumulated absorbed photosynthetically active-radiation (x) for different irrigation treatments and cultivars in 2006 and 2007. RUEs are the slopes of the relationships
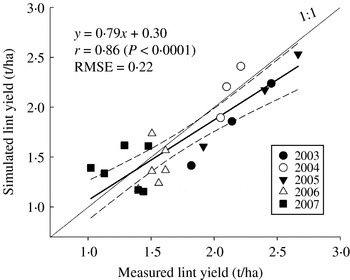
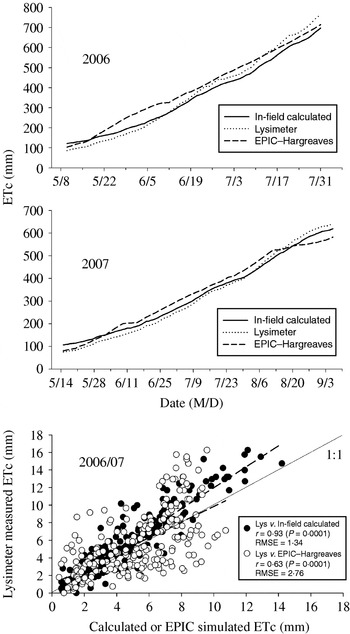
The EPIC model was then calibrated using the RUE estimates to determine an appropriate RUE value for simulation studies in South Texas. When the RUE value of 2·5 g/MJ was employed, EPIC simulated the variability in lint yields, with a correlation coefficient (r) of 0·86 and root mean square error (RMSE) of 0·22 Mg/ha (Fig. 5). While some of the farm field data points in 2007 were overestimated in simulation, paired t-tests showed that simulated yields were not significantly different from the measured yields with P=0·282 for collective data (P=0·063 for the experimental field data from 2004 to 2005; P=0·807 for the farm field data in 2006 and 2007). The regression line was generally close to the 1:1 line with a slope of 0·79 and R 2 of 0·74. Measured yields ranged from 1·0 to 2·7 t/ha while simulated yields ranged from 1·1 to 2·5 t/ha. The upper 95% confidence interval of the regression ranged from 1·2 to 2·6 t/ha while the lower 95% confident interval ranged from 0·9 to 2·1 t/ha. Lysimeter-measured crop water use under unstressed crop conditions was previously compared with two different methods of irrigation calculation: firstly, in-field calculation with the standardized ASCE-PM formula and secondly, EPIC using the Hargreaves–Samani equation (Hargreaves & Samani Reference Hargreaves and Samani1985). This was performed as a preliminary validation of the EPIC model. No statistical difference was found between the ETc values of lysimeter-measured and the two different methods of irrigation calculation (data not shown). However, cumulative ETc varied during the growing seasons among the three methods of measurements (Fig. 6). Meanwhile, in-field calculated ETc agreed with the lysimeter-measured ETc with r value of 0·93 and RMSE of 1·34, and EPIC–Hargreaves–Samani simulated ETc agreed with lysimeter measured ETc with r value of 0·63 and RMSE of 2·76. While daily ETc rates were somewhat in general agreement between the measured and simulated values, the variations of daily cumulated ETc were within an acceptable range. In-season differences among ETc methods varied, possibly due to inexact simulation growth curves or growth stage specific crop coefficients.
Measured v. simulated lint yield with EPIC model using data obtained at Texas AgriLife Research Center field from 2003 to 2005 and at farm fields from 2006 to 2007. Dashed lines represent the 95% confidence interval for the mean of the simulated values.

Lysimeter-measured ETc v. two methods of estimating ETc (in-field-calculated with the standardized ASCE-PM equation and EPIC-simulated using the Hargreaves–Samani equation) for cotton, Uvalde, TX, in 2006 and 2007. The in-field calculation was made using Eqn (2), i.e. ETc=Kc×ETo.

DISCUSSION
Two different k determination methods were demonstrated, one with direct measurement of the light interception by the plant canopy (Fig. 2) and the other with indirect estimation using the relationship between the proportion of the daily light energy intercepted by the crop canopy (Q 0=1−e−k·LAI) and k values (Fig. 3). However, care should be taken when the latter is employed to determine k values. Estimates can vary depending on the canopy conditions as shown for the indirectly estimated k value in 2007 (Fig. 7), which was between −0·6 and −0·7 based on the relationship between the Q 0 and k values when the crop canopy fitted to the maximum LAI (6·5 m2/m2). One of the solutions for this would be to determine a k value before the plant canopy reaches full ground cover (e.g. the dotted lines in Fig. 7).
Ratio of the daily light energy intercepted by a canopy (Q 0) v. LAI for different light extinction coefficient (k) values from −0·2 to −0·9 using data obtained in 2007. The dashed horizontal line represents the crop canopy at the maximum LAI value (the dashed vertical line).

The k value determined in the present study is in agreement with the range of k value for the plants with horizontal leaves hypothesized by Rosenberg et al. (Reference Rosenberg, Blad and Verma1983). In addition, the k value generally corresponded to the value of −0·65, used in the EPIC model (Williams et al. Reference Williams, Jones, Kiniry and Spanel1989). On the other hand, the k value obtained in the present study was slightly higher than the values of −0·77 found by Ronsenthal & Gerik (Reference Rosenthal and Gerik1991) in Texas and −0·76 found by Howell & Musick (Reference Howell and Musick1985) in California, but generally lower than the value of −0·45, described by Jackson & Hearn (Reference Jackson and Hearn1990), grown in Texas. According to the note by Kiniry et al. (Reference Kiniry, Simpson, Schubert and Reed2005), changes of k values affect RUE values. Such a trend was reported for peanut (Bell et al. Reference Bell, Wright and Harch1993) and diverse C4 grasses (Kiniry et al. Reference Kiniry, Tischler and Van Esbroeck1999). However, it has not been reported that changes in k affect the RUE values for cotton crops. A cotton study in Australia by Milroy & Bange (Reference Milroy and Bange2003) also demonstrated that RUE values were not affected by the changes of k values, which ranged from −0·51 to −0·99.
The RUE values found in the present study in 2007 were within the range common for C3 plants (2·0–3·0 g/MJ; Gallagher & Biscoe Reference Gallagher and Biscoe1978) and generally agreed with the cotton RUE values of 2·55 g/MJ, found by Howell & Musick (Reference Howell and Musick1985), and of 2·3 g/MJ, found by Ko et al. (Reference Ko, Maas, Lascano and Wanjura2005). However, the values found in the present work in 2006 corresponded to the cotton RUE values of 1·5 and 1·3 g/MJ for each variety of the cultivars Acala and Tamcot, reported by Rosenthal & Gerik (Reference Rosenthal and Gerik1991). The difference of the RUE values between the 2 years in the present study can be attributed to two extreme seasonal rainfalls, 71·4 mm in 2006 and 575·8 mm in 2007. Even though irrigation was applied based on the actual crop water use requirements in both years, it is considered that plants in 2006 were grown under environmental stress involving water deficit in comparison with those in 2007. Similar differences were reported by Milroy & Bange (Reference Milroy and Bange2003) ; depending on field conditions, RUE varied from 3·1 to 0·8 g/MJ at the same location.
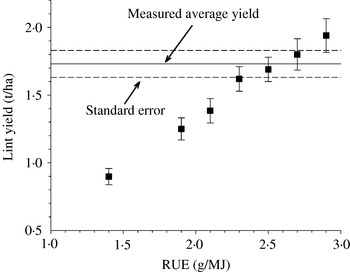
Parameterization is a modelling technique that uses an empirical function to approximate the response of a physical system over a given range of environmental conditions (Huschke Reference Huschke1959). This technique reduces the complexity of models, simplifies the input requirement of models and makes them easier to use for operational purposes. Appropriate parameter estimation is critical to reproduce the field conditions of a crop when using crop models, including EPIC. The traditional method of establishing the model parameter values has been through the analysis of data obtained from controlled-environment and field studies (Maas Reference Maas1993). The parameter value of k varies with foliage characteristics, solar angle, row spacing and direction, and latitude (Thornley Reference Thornley1976), while the value of RUE varies dependent upon various environmental conditions as well as cultural and management practices (Foale et al. Reference Foale, Wilson, Coates and Haydock1984; Sinclair & Horie Reference Sinclair and Horie1989; Rosenthal & Gerik Reference Rosenthal and Gerik1991; Rosenthal et al. Reference Rosenthal, Gerik and Wade1993; Milroy & Bange Reference Milroy and Bange2003). Given that the value of k used in EPIC (−0·65) is representative of crops with narrow row spacing (Williams et al. Reference Williams, Jones, Kiniry and Spanel1989), the present study employed various RUE values to EPIC for simulating cotton lint yield (Fig. 8). In parameterization, as the empirical function will not necessarily produce accurate results for all possible conditions, the modeller selects the empirical functions that will result in sufficient accuracy for conditions likely to be experienced in the application of the model (Maas Reference Maas1993). As the present simulation results show that the parameters used did not necessarily reproduce the field conditions, the various RUE values were objectively employed to explore the feasible range of the parameter value to fit to the measured lint yield. While the RUE values of 2·3–2·7 g/MJ can be applied to reproduce the cotton growth within the standard error range, the simulated lint yield with RUE 2·5 g/MJ closely agreed with the measured lint yield. Therefore, it is considered that the RUE value of 2·5 g/MJ is suitable to reproduce the measured field conditions.
Simulated lint yields as a function of various values of RUE. Vertical bars represent error at 95% confidence interval (n=21).

Daily ETc rates were in general agreement between the measured and simulated values and the variations of daily cumulated ETc were within an acceptable range. In-season differences among ETc methods varied, possibly due to inexact simulation growth curves or growth stage specific crop coefficients. The validation result demonstrates that the EPIC model using the RUE estimate can reproduce the field conditions of cotton in South Texas. Previously, Williams et al. (Reference Williams, Jones, Kiniry and Spanel1989) reported that EPIC could accurately simulate crop responses to irrigation at locations in the western USA. More recently, Ko et al. (Reference Ko, Piccinni, Steglich, Gerik, Marek, Howell and Kemanian2007) verified that EPIC could be employed to simulate crops under various irrigation managements in the conditions of South Texas. In addition, the model has successfully been calibrated elsewhere in the world, such as China (Huang et al. Reference Huang, Gallichand, Dang and Shao2006) and France (Cabelguenne et al. Reference Cabelguenne, Jones, Marty, Dyke and Williams1990).
EPIC has been verified as a suitable model for simulating long-term average crop yields. However, further efforts with intense investigation of the other parameters for the model are needed to adequately simulate yield in particular low- and high-yielding years, as shown in some of the farm field data for the present study as well as found in previous studies by Bouzaher et al. (Reference Bouzaher, Shogren, Holtkamp, Gassman, Archer, Lakshminarayan, Carriquiry and Reese1993) and Martin et al. (Reference Martin, Nearing and Bruce1993). As Kiniry et al. (Reference Kiniry, Major, Izaurralde, Williams, Gassman, Morrison, Bergentine and Zentner1995) pointed out, overestimation of the amount of plant-available water at field capacity can cause EPIC to overestimate yield in dry years. It is considered helpful to measure maximum depth of water extraction using appropriate cultivars in the region.
The k (−0·63) and RUE (2·5 g/MJ) values of cotton were determined based on the field experiment and employed the values to reproduce the field conditions using EPIC, which simulated the variability in lint yields with r of 0·86 and RMSE of 0·22 t/ha. The main conclusion from the present work is that appropriate parameter estimates, including RUE, are critical to reproduce the field conditions of a crop. The results also show that with appropriate parameter estimation, EPIC can give reasonable mean-yield simulations for crops of interest in the South Texas conditions.
This study is a partial outcome of the Precision Irrigators Network (PIN) project, funded by Texas Water Development Board (TWDB: Project No. 0603580596) and Rio Grande Basin Initiative (RGBI: Grant No. 2005-34461-15661). The authors would like to express their appreciation to Dr Gerik and his group for their supports in calibrating the EPIC model. We thank Brian Trees and Amy Wentz for taking field measurements and Texas Water Resources Institute (TWRI) for administrative project assistance. We would also like to thank the anonymous editor and reviewers for the valuable comments.