When Charlie Chaplin was eight, he performed in three large music halls an evening. Ten years later, in 1915, each night he could be seen in thousands of halls across the world. The remarkable transformation of spectating into a non-rival setting where Chaplin could be watched in many places simultaneously was made possible by motion pictures. They industrialized entertainment by automating it, standardizing it, and making it tradable.
In 1900 live performers provided almost all spectator entertainment. By 1938 live entertainment's share had fallen to less than 3 percent of all performances and 8 percent of all entertainment expenditure. Even in absolute terms, live entertainment was only two-thirds of its previous size. In 1900 most live entertainment was of the popular, at times vulgar type, such as popular theater, vaudeville, and burlesque. Opera probably constituted less than 4 percent of all live entertainment provided.Footnote 2 The vast majority of popular live entertainment disappeared in several technological step changes that made motion pictures an ever closer substitute. By 1938 what remained was elite high-brow entertainment, heavily subsidized and supported by charities, or high value-added, high-concept commercial entertainment such as musicals and Broadway plays.
By 1938 motion pictures provided entertainment even at marginal hours and in marginal places, offered an unprecedented variety of performances, especially for smaller towns, offered sound and sometimes color, close-ups and loudspeakers equalizing the auditorium experience. They gave every consumer the chance to see a superstar such as Chaplin instantly in their own town.
While it is not difficult to grasp this revolution in entertainment provision intuitively, no attempt has been made to quantify the productivity growth. I aim to do just that, and find that TFP growth was higher than in any other well-measured industry.
With proper industry and market definition, measures of productivity in personal services need not be stagnant. Often final year substitution elasticities are implicitly assumed for preceding periods, implying that the industrialized service was an entirely different product. William Baumol and William Bowen, for example, found stagnating productivity growth in the U.S. performing arts, although they did not measure TFP growth.Footnote 3 While acknowledging the massive productivity increase audiovisual delivery technologies enabled, they assumed “performing arts” to be an entirely different market. This was less accurate before 1940 than in the 1960s, when the surviving live entertainment was far more differentiated, and that was precisely how it survived.
I present historical evidence showing that motion pictures can reasonably be assumed to be a close substitute for live entertainment and then estimate productivity growth between 1900 and 1938. I then estimate entertainment's contribution to U.S. economic growth.
I introduce the spectator-hour—one person consuming one hour of entertainment—as a new output measure. Previous research often used inputs as output proxies. Baumol and Bowen, for example, mention the person-hours a string quartet's members perform, resulting in stagnant productivity and disregarding the additional spectator-hours sold through larger-scale auditoriums or audiovisual technologies.
Entertainment output in 1938 was 27 times 1900 output, a growth of over 8 percent annually, double the estimates of existing studies on the growth in recreation services, which range from 3.3 to 4.2 percent per annum. Only one-third of output growth was driven by inputs, the rest by TFP growth.
This falsifies the notion that productivity in personal services was stagnant by definition. It provides counterpoints to the Baumol model, which posits a stagnant sector (certain services) and a progressive sector (such as manufacturing). In estimating productivity in entertainment, the Baumol model makes four assumptions. Differences between “progressive” and “stagnant” activities are inherent technologically. All nonlabor costs are ignored. Stagnant and progressive sector wages move up and down together, and both sectors’ wages increase when progressive sector productivity increases.Footnote 4
The stagnation assumption is violated by the sharp increase in the live capital-labor ratio after cinemas entered into competition with live entertainment. One cannot focus exclusively on wages and ignore capital costs. Further, sectoral wage differences were important because “stagnant” sector wages were probably substantially lower than progressive sector wages. The fourth assumption, that all wages and progressive sector productivity moved together, cannot be rejected by our findings.
Baumol also makes four propositions. Stagnant sector costs rise without limit. Progressive sector costs remain constant. The stagnant sector tends to vanish in competitive circumstances. Holding output shares fixed, all labor moves to the stagnant sector eventually, which contributes to declining growth rates. In fact, the “stagnant” live sector did come close to vanishing, but the other three propositions do not hold. Costs declined in both sectors. Output shares were not fixed, labor did not shift into the stagnant live sector, and growth rates did not fall before 1940.
Examining the economics of superstars, Sherwin Rosen remarked that new non-rivalrous delivery technologies made a more skewed income distribution for talent not inconsistent with a total welfare increase.Footnote 5 I show that the shift to a non-rivalrous service kick-started productivity growth, forever changing the industry.Footnote 6
Using growth accounting techniques applied historically to steam by Nicholas Crafts, I find that motion pictures’ contribution to aggregate growth was far lower relative to General Purpose Technologies (GPTs) such as steam, railways, and electricity than their absolute TFP growth, but that it was not insignificant.Footnote 7 Motion pictures accounted for about 2 percent of U.S. GDP growth and 3 percent of aggregate TFP growth. Disaggregating following methods used by William Nordhaus, over 90 percent of the contribution of motion pictures was driven by TFP growth: 61 percent came from the pure productivity effect, 22 percent from the share effect, and 10 percent from the input-shift effect.Footnote 8 Investigating the accumulated impact on final year (1938) GDP and TFP—an approach linking Robert Solow's residual to Robert Fogel's social savings methodology—leads to similar conclusions.Footnote 9
These findings reinforce the important role played by services in the reinterpretation of the contributors to U.S. growth before 1940. Douglas Irwin and Stephen Broadberry, for example, show how services, not manufacturing, explain the U.S. productivity lead between 1870 and 1940, and Alexander Field shows how mass services like utilities, transport, and distribution bolstered interwar U.S. productivity growth.Footnote 10
Jack Triplet and Barry Bosworth explain the measured post-1973 services productivity slowdown as arising from the Bureau of Economic Analysis's move from manufacturing extrapolations to a services measurement concept. They put the post-1995 productivity surge firmly within services. The results here show that productivity growth also extended to some personal services that became industrialized in the first half of the twentieth century.Footnote 11
MOTION PICTURES AS A CLOSE SUBSTITUTE
During the nineteenth century, stand-alone entertainment venues gave way to theater circuits and local stock companies to traveling groups, helped by the railways. Central booking offices on Union Square in New York routed performers efficiently across the nation. Innovations such as the steel frame and reinforced concrete enabled a sharp increase in theater size, as well as price differentiation by allowing cheaper tickets for the galleries. Falling working hours, rising disposable income, urbanization, rapidly expanding transport networks, and strong population growth boosted the demand for entertainment.Footnote 12
At the turn of the century, when the existing industry faced decreasing returns to further process innovations, motion pictures industrialized live entertainment by automating it, standardizing it, and making it tradable. This industrialization may have been not unlike the way in which information and communication technology (ICT) would automate, standardize, and make tradable certain services after 1945.Footnote 13
Actors needed to give only one performance, which was reproduced infinitely. This standardized the public's viewing experience. Spectators were guaranteed they would see the entertainment as advertised, without understudies, second-rank sets, reduced musical support, or actors having a bad night. Where earlier only creative inputs had been mobile and relatively permanent in time, now the performances themselves became storable and tradable. They were not produced any more at the time and place of consumption, often mentioned as a characteristic of a service. Tradability increased competition among creative inputs for the audience's attention and integrated entertainment markets. Until the emergence of cinema, the number of actors and actresses per 100,000 inhabitants increased sharply.Footnote 14 It stagnated subsequently, while real revenue per performer increased sharply.
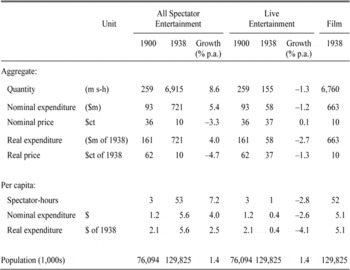
In 1900 Americans consumed 3.4 hours of spectator entertainment per capita per year, on average, at a price of 36 cents each.Footnote 15 By 1938 they consumed 54 hours, at a price of 10 cents each. The quantity consumed per capita increased by over 7 percent annually, on average, and expenditure rose by 2.5 percent, while the real price fell by over 4 percent a year (Table 1). By 1938 the spectator entertainment industry had grown to 27 times its 1900 size; live entertainment constituted only 2.3 percent of total quantity and 8 percent of expenditure. A whole industry had gone with the wind.Footnote 16
U.S. SPECTATOR ENTERTAINMENT CONSUMPTION IN 1900 AND 1938

Notes:
s-h = spectator-hour; m = million; ct = cent; p.a. = per annum. Growth is the average annual growth over the 1900–1938 period.
Source:
See section “The Growth in Total Factor Productivity” in the text.
This article's key underlying assumption is that motion pictures provided a close substitute for live entertainment. This is supported by five pieces of historical evidence. First, demand for a product usually falls when its price increases. The number of motion picture tickets, however, grew rapidly while prices increased. Between the mid-1900s and the mid-1910s prices for film increased three- to fourfold—from 5 cents to between 10 and 20 cents—while demand grew rapidly.Footnote 17 Such a phenomenon could be explained by unmeasured quality change and a process in which the product was used as a substitute for another product. With each quality improvement—such as longer films, more drama films, the feature film, more cuts per minute, the close-up, and talking pictures—prices increased, but film also became a better substitute for live entertainment.
Second, vaudeville and variety theaters often showed motion pictures intermittently with live acts on a single ticket, literally substituting some acts for celluloid. Third, old live venues were converted into cinemas.Footnote 18 Theater historian Jack Poggi writes:Footnote 19
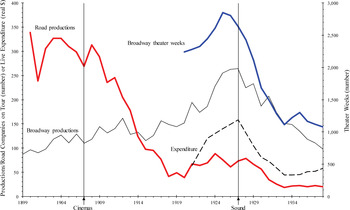
First the movies created a new audience, many of whom had never been to the theater; but the desertion of the galleries in theaters in all the large cities indicates that they also began to lure away that part of the theater audience with the lowest income. Then, as the movies improved in quality and respectability, people from the business and professional classes might be expected to change their entertainment habits…. Possibly the habitual New York theatergoers went to both theater and films for a time and then gradually limited their attendance at live theater to special occasions. This theory would explain why the less popular plays began closing more quickly, causing a drop in the number of theater weeks…The motion pictures could not have crushed the legitimate theater if there had been a real preference for live drama. Theater managers would never have turned their buildings over to the movies if they could have made more money by booking plays; a few might have been satisfied if there had been equal profit, or even a little less, in live theater. Again, we come back to the same point: people were simply not willing to pay the price necessary to maintain live theater, except in the largest cities. If they could get what they wanted from the movies, why should they look elsewhere?
It follows that the quality-adjusted price of those disappearing plays must have been higher than that of motion pictures.
Fourth, after each step in the improvement in the substitutability of motion pictures, demand for live entertainment fell sharply. From the mid-1900s onwards motion picture theaters replaced small-town live entertainment, proxied by “road productions” in Figure 1. From 1927 talking pictures constituted a major jump in substitutability that led to the demise of most of the remaining live acts.Footnote 20 They replaced much of the high value-added metropolitan entertainment, proxied by “Broadway” in Figure 1. Before “talkies,” Americans spent $1.33 per capita on live theater, versus $3.58 on movies. By 1938 the figures were $0.45 vs. $5.15. Talking pictures triggered a second investment wave, the benefits of which occurred almost immediately because the basic motion picture industry infrastructure was now in place.
Fifth, live and filmed entertainment inherently shared many characteristics. As Timothy Bresnahan and Robert Gordon noted, any innovation usually has characteristics of a new good and of a substitute.Footnote 21 Quality improvements are generally achieved across a vector of dimensions, with some of the improvement's dimensions being close to existing products, some offering a far higher quality, and some constituting entirely new dimensions. Using the hedonic approach and regarding quality as multidimensional, the extent to which an innovation is a substitute can be assessed. Kelvin Lancaster suggests that looking exclusively at cross-price elasticities allows in principle shoes and ships to be just as close substitutes as margarine and butter, while the hedonic approach of using quality dimensions comes closer to consumers’ intuitive understanding of what constitute close substitutes.Footnote 22 In longitudinal processes rather than comparative statics, multidimensional quality is even more important, as new products were often further improved through incremental innovations that made the original innovation an ever closer substitute.
INDICATORS OF LIVE ENTERTAINMENT PRODUCTION, 1899–1938

As an example, Bresnahan and Gordon note that the motor car in some respects was an entirely new product, and in other respects a substitute for the horse, the cart, public transport, walking, or cycling. To capture the full welfare benefits, one would need to take the passenger-miles travelled, with their cost in money and time, and correct for the changing economic geography brought about by the car.
This approach implies that both cinema and live entertainment had multiple quality dimensions, and that the shared dimensions differed not always in the same direction. Each form of entertainment constituted a bundle of quality dimensions that could differ in magnitude and would not entirely overlap. Consumers could only buy these bundles of entertainment, not the individual quality dimensions, implying that the market prices we observe for different forms of entertainment may not be directly comparable. Dimensions along which the quality of motion pictures was indisputably higher than live entertainment included the continuous availability of shows throughout the day, week, and year, availability in marginal places that could not support a live theater, uniformity of viewing experience across the auditorium, close-ups, the number of setups, and the availability of the most successful shows and stars.Footnote 23
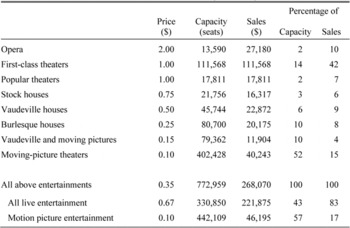
Detailed entertainment price and quantity data for Boston in 1909 offer a snapshot of the substitution process.Footnote 24 Consumers could choose between at least eight forms of theatrical entertainment, ranging from opera at a $2 ticket price to moving pictures at 10 cents. Three years after their emergence, cinemas supplied half of Boston's capacity in Table 2, but took in only a sixth of expenditure, given their low prices. The cheapest vaudeville shows reacted by interspersing live performances with films. The radical new technology not only swept away the traditional entertainment delivery technology, it also opened up new markets, supplying consumers that had never seen theatrical entertainment before. Gradually, cinema would outcompete more and more lower-priced live entertainment, leaving standing only the most differentiated and expensive forms.Footnote 25
PRICES, CAPACITY, AND SALES POTENTIAL FOR VARIOUS TYPES OF THEATRICAL ENTERTAINMENTS, BOSTON, 1909

Notes:
Capacity = the weekly seating capacity as estimated by the Boston Committee (venue capacity times number of performances). Sales = sales potential, when all seats are sold at the listed prices. For the bottom two rows “Vaudeville and motion pictures” has been equally split between live and motion picture entertainment.
Source:
Calculated from data from Boston Committee 1909, as mentioned in Jowett, “First Motion Picture Audiences.”
To proxy output growth in services, often employment or capital is used.Footnote 26 As these are inputs, this inevitably leads to observing limited TFP growth. We propose a common measure for output for both live and filmed entertainment, the “spectator-hour.” Similar to passenger-miles, a venue's number of seats times the performance duration constitutes the spectator-hours produced, and the number of filled seats times the performance duration the hours actually sold. Contemporary market surveys, such as the Trade Information Bulletins published by the Department of Commerce, prominently feature data on seating capacities and therefore support our choice of measure.Footnote 27
The spectator-hour does not take into account changes in quality of experience. Given the massive increase in production expenditures and new product characteristics—such as cinema itself, the feature film, talking pictures, and air-conditioned venues—overall quality change was undoubtedly positive.Footnote 28 Robert Lamson, for example, studied the quality of motion picture theaters between 1947 and 1964, including dimensions such as crowding, parking spaces, and theater age.Footnote 29 Quality change was substantial and not captured in the national accounts. Adjustment for quality would have lowered the traditional admission price by about two-thirds, and increased total factor productivity from zero to 2.7 percent.
This article estimates a lower bound to productivity increase in spectator entertainment because it ignores quality improvements. Still measuring productivity growth under these conditions increases our confidence in the findings. Refraining from quality adjustments makes the findings also more comparable to existing productivity estimates for other industries.
THE GROWTH IN TOTAL FACTOR PRODUCTIVITY
Two benchmark years have been selected: 1900, the first census year before cinema's takeoff, and 1938, when the industrialization was complete. After 1927 sound had driven out most live entertainment, while television had yet to arrive.Footnote 30 The choice of 1938 as final year makes the findings more conservative, as the economy was operating below its peak and GDP had fallen compared to 1937.Footnote 31 Given that it was income elastic, entertainment consumption was below trend.Footnote 32 This is further evidenced by total real expenditure growth after 1938, which grew steadily from $721 million in 1938 to $1,248 million in 1945.Footnote 33
At times the sectoral data are sparse and incomplete, especially for 1900. In some cases, approximate estimates had to be made based on indirect indicators. Following Fogel's approach, it is not our aim to get the exact value of entertainment's growth contribution—something that is hardly possible given data imperfections—but merely to show that given the available evidence and with conservative assumptions, TFP growth must have been considerable.
Growth accounting captures the contribution of technological change to growth through the Solow residual (TFP). With the standard Cobb-Douglas production function and competitive assumptions

the Solow residual (A) is computed as

where Y measures output in spectator-hours, K capital in constant dollars, L quality-adjusted hours of labor, and α the share of capital in industry income.
To estimate output (Y), I first estimate expenditure, then average price per spectator-hour, and then divide to arrive at total spectator-hours produced. For 1900 expenditure is estimated using the Department of Commerce, Historical Statistics, series starting in 1909 with an aggregate value for “Motion Picture Theaters” and “Legitimate theaters and opera and entertainment by nonprofit institutions.”Footnote 34 These series are extrapolated backward to 1901 using the growth rate of John Owen's series for real “per capita demand for recreation” multiplied by the U.S. population. They are extrapolated backward one more year to 1900 assuming that the 1900/01 growth rate was half Owen's 1901–1906 annual rate, to make the estimate more conservative.Footnote 35 A second rough ballpark estimate was made by interpolating 1889/90 and 1917–1919 household expenditure data on “amusements, vacations, etc.,” yielding a 1900 value that was one-third lower.Footnote 36 The first estimate is used because a higher 1900 output will make our TFP estimate more conservative. The 1938 expenditure is from the Department of Commerce, Historical Statistics.Footnote 37
For 1900 average ticket prices and performance durations for high-, intermediately, and low-priced entertainment were estimated from the theater history literature.Footnote 38 Taking the share of “theaters available for nationwide touring” in all theaters, as reported for 1905 by Felicia Hardison Londré and Daniel J. Watermeier, for each of the three price bands I assumed weights of 50, 25 and 25 percent in ticket sales to calculate the average price per spectator-hour.Footnote 39 A second estimate came from the well-documented average live entertainment price in Boston in 1909 from Table 2, which was transposed into a price per spectator-hour with the same performance duration assumptions, and then extrapolated back to 1900 using Owen's recreation price index. The result was a marginally higher price—36.8 vs. 35.9 current cents.Footnote 40 The lower price is used, as it will increase 1900 output and so bias the findings against finding TFP growth.
The 1938 motion picture ticket price is derived from the NIPA Admission Price Index motion picture series combined with nominal average ticket prices from the Department of Commerce as reported by Michael Conant, dividing by an estimated 2.75 hours average duration.Footnote 41 The popularity of double features might have made actual duration longer, but a more conservative estimate results in fewer 1938 spectator-hours, and so lower TFP growth.
The 1938 live entertainment price was estimated using the price series for “average” and “top” prices for Broadway “straight shows” and “musicals” between 1926 and 1965 from Thomas Moore, and assuming that nonmetropolitan live entertainment accounted for 90 percent of all ticket sales and was priced at a third of the average Broadway price.Footnote 42 The resulting average price is divided by an estimated average performance duration of 2.25 hours. Since live entertainment accounted for just 8 percent of all spectator entertainment expenditure in 1938, aggregate TFP growth will not be very sensitive to this estimate. The average price for all spectator entertainment is the weighted average of the motion picture and live prices. Finally, 1900 and 1938 outputs are obtained by dividing expenditure by price.
Capital in 1900 had to be estimated from theater history studies. Londré and Watermeier estimate that in 1905, 1,700 “theaters nationwide available to touring combinations” existed, broadly concurring with Alfred Bernheim's observation that “the number of theaters open for road shows outside the metropolitan centers such as New York, Chicago, Boston, St. Louis, Providence, etc.” was 1,520 in 1910.Footnote 43 Londré and Watermeier estimate that in addition, 1,000 “unlisted theaters nationwide available to touring combinations” existed. I assume that a further 1,000 vaudeville and 1,000 other live entertainment venues existed, such as the burlesque, repertory, and nonprofit theaters, making a total of 4,700 venues in 1905. This figure is extrapolated back to 1900 by assuming capital grew at the same rate as total entertainment expenditure.
Using anecdotal historical construction costs and acquisition data for individual theaters from the theater history literature, a rough and ready ballpark estimate was made that the capital needed to build an average theater in 1900 was not lower than $35,000.Footnote 44 Using a ten-year average venue age and fifty-year lifespan, I calculate the average depreciated capital value of a theater, multiply by the number of venues, and inflate to 1938 dollars using Simon Kuznets’ capital goods deflator.Footnote 45 The actual capital stock likely was higher than this estimate, but a low 1900 estimate biases the findings against high TFP growth.
Capital in 1938 was estimated by extrapolating, “Net total assets after reserves for depreciation, depletion, amortization, and bad debts,” as reported by William Greenwald for “Motion Pictures” and “Amusement Except Motion Pictures” in 1944, based on Bureau of Internal Revenue data.Footnote 46 Given serious capacity underutilization in 1938,Footnote 47 three-quarters of the increased ticket sales between 1938 and 1944 is assumed to have been met by existing capital, reducing the capital growth rate and so increasing 1938 capital, biasing the findings against high TFP growth.
Labor in 1900 is estimated from the persons classified in the census under entertainment: “Actors,” “Musicians,” and the aggregate of “Owners, Managers, Officials of Theaters,” “Showmen,” and “Keepers of Pleasure Resorts, Race Tracks, etc.”Footnote 48
Only artists and managers/proprietors of entertainment venues were classified separately in 1900. Practical, more manual entertainment occupations were only listed separately later: “Operatives of amusement, recreation, rel. services” and “Ushers, amusement place or assembly” in 1910 and, additionally, “Laborers of amusement, recreation, rel. services,” “Attendants, recreation and amusement,” and “Helpers, motion picture production” in 1930. Assuming similar percentages of these categories in 1900 yields the number of persons in 1900 that would have been classified under an entertainment occupation in 1930.
In the more detailed 1910 Census, 15.9 percent of persons classified similarly as in 1900 under entertainment did not work in spectator entertainment; therefore, the 1900 figure is reduced by this percentage.Footnote 49
However, even in 1930 many persons working in spectator entertainment were not classified under an entertainment occupation. The number of persons working in spectator entertainment in 1930, as reported by NIPA, was 22.2 percent higher than those classified under census entertainment occupations.Footnote 50 Using the same ratio for 1900, and then assuming the 1938 part-time to full-time person's ratio calculated below, a total full-time employment equivalent (fte) is calculated for 1900. Lacking industry-specific data, we multiply by average annual working hours from Michael Huberman and Chris Minns.Footnote 51
For 1938 motion picture production, distribution and exhibition, “Full-time equivalent employees” are taken from NIPA.Footnote 52 An additional 7,000 self-employed persons were converted to fte using the ratio of fte to full-time and part-time employees for persons employed, and then assuming that that they worked for 5/8 in entertainment.
Live entertainment labor was estimated from “Amusements and Recreation” employment,Footnote 53 by applying the fraction of live expenditure in “Amusements and Recreation” expenditure to the employment figures, and then using the same methodology as for motion pictures, arriving at a number that is not out of line with the 1930 and 1940 census figures. I then sum live and motion picture figures and multiply by nationwide annual working hours.
Absent disaggregated data, labor quality is estimated from national figures. Using the OECD methodology from Georgios Psacharopoulos and Angus Maddison for “Years of education per person aged 15–64,” and geometrically interpolating between 1890, 1913, 1929, and 1938, leads to a national growth rate in labor quality of 1.2 percent per annum for 1900–1938.Footnote 54 Using Claudia Goldin and Lawrence Katz's, “Educational attainment of the workforce of those aged 16 or older and excluding those in the military or institutionalized” in 1915 and 1940, and the OECD weighting scheme, yields a slightly lower growth rate of 1.1 percent annually for 1915–1940.Footnote 55 The higher growth rate is chosen because it makes TFP growth more conservative.
The capital and labor income shares α and 1–α in equation 1 were estimated from NIPA for the 1930s. For motion pictures, the 1938 labor share was 0.81 and the 1929–1947 series shows an average labor share (“Compensation of Employees”/“National Income Without Capital Consumption Adjustment”) of 0.78, and the peak to prewar peak 1929–1941 series 0.86, but these values were affected considerably by the Depression.Footnote 56 The average share in 1929, 1930, and 1940–1947, of 0.67, warrants a somewhat lower long-run estimate. The labor income share in live entertainment was probably somewhat higher.Footnote 57 Because entertainment capital grew faster than labor between 1900 and 1938, a lower labor share leads to a more conservative TFP growth estimate. Given that the labor share in 1900, when almost all entertainment was live, was probably higher than in 1938, it appears safe to assume a 0.75 average labor share.
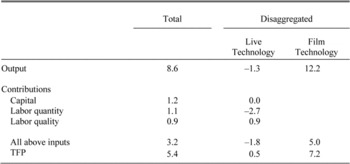
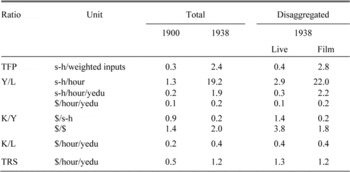
Putting the above estimates in equations 1 and 2 results in an annual growth rate in spectator-hours of 8.6 percent for almost 40 years, as seen in Table 3.Footnote 58 Over a third was explained by capital and labor increases, the rest by TFP growth. After growing over 5 percent annually between 1900 and 1938, TFP was almost eight times its 1900 value. Labor productivity grew 7 percent annually, from 1.3 spectator-hours per quality-adjusted labor hour in 1900 to 19.2 by 1938.
Total TFP growth is disaggregated into the contribution of live and film technology by weighting growth rates by the technologies’ output shares—the geometric average of the 1900 and 1938 shares.Footnote 59 Live entertainment output in Table 3 shrunk 1.3 percent annually. Inputs declined far faster than output, driven by an exodus of labor, resulting in non-negative TFP growth.Footnote 60 Motion picture output grew 12 percent annually, over half of it driven by TFP growth—by 1938 it was seven times more productive than live entertainment.
CONTRIBUTIONS TO OUTPUT GROWTH IN SPECTATOR ENTERTAINMENT, 1900–1938, PERCENT PER ANNUM

Notes:
Output is measured in spectator-hours, capital in real dollars deflated using Kuznets’ (Capital) capital goods price index, labor quantity in hours worked, labor quality in weighted years of education using Psacharopolous/OECD (Earnings). The capital and labor factor income shares used are 0.25 and 0.75, respectively.
Sources:
See the text for a detailed discussion of the underlying sources. The contribution of film technology is an estimate based on weighing the growth rates by the output shares (see the text).
The production structure changed significantly. The capital-labor ratio shown in Table 4 doubled and by 1938 was similar for both filmed and live entertainment. The capital-output ratio declined sharply, from $0.81 to $0.20 per spectator-hour.Footnote 61 The technical rate of substitution more than doubled. By 1938 about $20,000 of capital could replace one worker.Footnote 62
Much of the productivity gains were passed on to consumers through falling real prices, which declined over 4 percent annually for almost 40 years, before television had even arrived (Table 1). Live entertainment prices fell 1.3 percent annually, while film technology forced prices down even faster, decreasing them by about 6 percent per annum.
KEY PRODUCTION FUNCTION RATIOS FOR SPECTATOR ENTERTAINMENT

Notes:
TRS = The technical rate of substitution; s-h = spectator-hour, yedu = average weighted years of education of the labor force using Psacharopoulos/OECD (Earnings). Weighted inputs = [$∘0.25]*[(hr*yedu)∘0.75]. Output value has been deflated to 1938 dollars using the consumer price deflator in Officer (“Annual Consumer Price Index”). Capital is measured in real dollars, deflated using Kuznets’ (Capital) capital goods price index.
Sources:
See the text.
Besides the productivity effect, cinemas’ competitive impact probably also brought down overall entertainment prices. Cinemas’ ability to provide low-priced entertainment, both at the inframarginal and marginal times and places, put pressure on live entertainment prices. Thus, dynamic efficiency did not happen at the expense of allocative efficiency, consistent with Nordhaus’ findings for industries between 1948 and 2001.Footnote 63 Trusts controlling the supply of creative talent dominated both the theater and vaudeville business. Venues depended on them for top-quality talent and talent for playing the best theaters. Even though the motion picture industry itself became highly concentrated—each studio owning a cinema circuit dominating a particular part of the country—and was found guilty of violating antitrust laws, it probably had a beneficial competitive effect on the entire spectator entertainment industry.
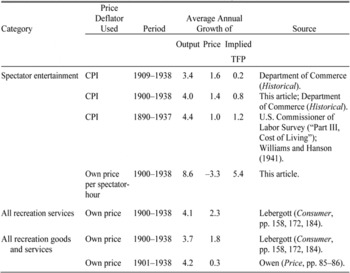
The output and TFP growth rates developed here sharply contrast with estimates that might come from existing measures of the entertainment industry. Existing pre-1929 GDP series are based on benchmark-year estimates, which do not include entertainment separately before 1909.Footnote 64 The Department of Commerce's expenditure series for 1909–1938, “Motion Picture Theaters” and “Legitimate theaters and opera and entertainment by nonprofit institutions,” CPI-deflated, show a 3.4 percent annual output growth (Table 5, 1st series).Footnote 65 If inputs are assumed to have grown at the rate measured in the current article, this implies only a 0.2 percent annual TFP growth.
OUTPUT GROWTH ESTIMATES FOR SPECTATOR ENTERTAINMENT AND ALL RECREATION GOODS AND SERVICES, 1890–1938

Notes:
“Implied TFP”: assumes that inputs for other series grew at the rate for spectator entertainment reported in Table 3, of 3.2 percent per annum. All rates in percent per annum. The two Lebergott price growth rates are estimates, using Lebergott's 1900–1929 price series, and assuming prices remained stable during 1929–1938; they are not necessarily consistent with Lebergott's output series. Spectator entertainment was on average 58 percent of recreation services between 1900 and 1929, when Lebergott's data is combined with this article's data; spectator entertainment shrank from 65 to 51 percent of all recreation services expenditure. Spectator entertainment was on average 19 percent of all recreation goods and services between 1900 and 1938, when Owen's data is combined with this article's data; its share grew from 15 to 23 percent of all recreation goods and services expenditure. The latter suggest that the expenditure share of recreation goods must have dropped sharply relative to services. The 1890–1937 estimate is derived from the respective household expenditure surveys, following the method discussed in the text on page 1047 in footnote 36; 1890 is the latter year of the 1889/90 survey and 1937 is the mid-year of the 1936–1938 survey. The author is grateful to Michael Haines for making available the electronic data set of the 1889/90 survey; on its representativeness see Haines, “Industrial Work.” The CPI-deflator is taken from Officer, “Annual Consumer Price Index.”
Linking our own 1900 estimate to this series, yields a 4 percent annual output growth, and an implied 0.8 percent annual TFP growth. The household expenditure surveys suggest a 4.4 percent annual growth in output between 1890 and 1937, implying a 1.2 percent annual TFP growth (Table 5). In all, the CPI-based preexisting series show at most half the output growth and just under a quarter of the TFP growth measured with the new calculations.
To put the above series in context, they are compared to more aggregated series in Table 5. Stanley Lebergott's “Personal consumption of recreation services” shows a 4.1 percent annual output growth. For all recreation services and goods, Lebergott's (“Personal consumption on recreation—Total”) and Owen's series (“Per capita demand for recreation” times the population, divided by his recreation price index) reveal a 3.7 and 4.2 percent annual output growth. This suggests that rapid output growth in spectator entertainment compensated for more limited growth elsewhere and that our current understanding of GDP growth underestimates the contribution of certain services.
Before 1940 no well-measured industry surpassed entertainment's TFP growth.Footnote 66 Only TFP growth in rubber products and electric utilities came close. Comparing growth rates for other industries’ over 30-year periods with entertainment's growth over a 38-year interval, the growth rates in only the rubber and residual transport industries exceeded entertainment's TFP growth by small fractions. Taking twenty- and ten-year intervals, 16 industries experienced faster growth than entertainment. Thus, TFP growth as high as in spectator entertainment could be found in other industries but not for nearly as long a time period.
Scale Economies
Qualitatively judging available empirical studies, Edward Denison conjectured that about one-tenth of U.S. output growth between 1909 and 1929 and one-eleventh between 1929 and 1957 was attributable to scale effects.Footnote 67 In the calculations in this article, the Cobb-Douglas function is assumed to have constant returns to scale; therefore, any increasing returns are captured in TFP growth.Footnote 68 The increasing returns were caused mainly by technological change—making them not fully separable—and by the effect of increasing population density on capacity choices. If the degree of urbanization is used to proxy the potential to obtain economics of scale from increasing population density, then three situations are conceivable. First, firms reap benefits of increasing urbanization using the same technology, for example through higher capacity utilization of existing live theaters, more live theaters allowing more efficient routing of actors, and larger live theaters. Second, firms respond to economies of scale, even while there is no change in urbanization, by introducing the cinema, a new technology. Third, a situation in which economies of scale are realized when simultaneously urbanization increases and new technologies are used.
Technological changes in spectator entertainment included the use of larger steel frames for venues that expanded audience capacity and the reproducible celluloid master performances that allowed the same performance to be shown in many venues simultaneously. Both decreased the long-run average costs of spectator entertainment. Innovation improved capital utilization massively. Before film, entertainment venues depended on visiting troupes, making operation unprofitable at marginal times of a day, week, year, and at marginal locations. Also, film scenery and equipment were used around-the-clock and thus more fully than theater scenery, stage equipment, and lighting, which were mainly used during evenings.Footnote 69 Hollywood studios maximized capacity utilization by shooting A-moves by day and B-movies by night. Although the B-movies yielded far less revenue, their marginal capital costs were literally marginal.
To gain insight into agglomeration benefits, the population in cities with over 25,000 inhabitants is used as urbanization indicator.Footnote 70 Because increasing population density enabled larger-scale venues, I use the common understanding of technical economies of scale from industrial organization, the “cube-square” rule, which holds that they are either two-dimensional or three-dimensional.Footnote 71 We assume inputs only increase with the average of the square and cubic roots of a city's population growth, analogous to horizontal and vertical city expansion.Footnote 72
Under these assumptions, over a quarter of TFP growth—1.5 percentage points—can be attributed to agglomeration effects, and live TFP growth would be substantially negative without urbanization. Thus, agglomeration effects may have been about twice Denison's conjecture of between one-tenth and one-eleventh of aggregate output. Since the latter included scale effects not attributable to agglomeration, total scale effects in entertainment were probably far larger than Denison's conjecture, putting the industry at the high end of the agglomeration-benefit spectrum.
THE CONTRIBUTION TO AGGREGATE GROWTH
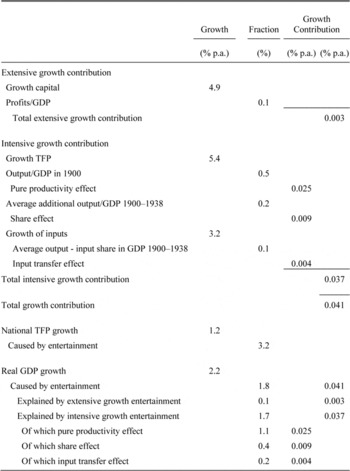
The motion pictures contribution to aggregate growth is calculated following traditional growth accounting.Footnote 73 The extensive contribution in the form of capital growth times profit share in Table 6 was small, just 0.1 percent of GDP growth. The intensive growth contribution, calculated as TFP growth times entertainment's average GDP share was, at 1.7 percent of GDP growth, much higher.
I decomposeFootnote 74 the intensive contribution into the pure productivity effect, which captures entertainment's contribution at constant GDP-share (the 1900 share times TFP growth);Footnote 75 the share effect, which captures increased relative spending on entertainment (TFP growth times average additional GDP share); and, finally, the input transfer or “shift” effect, which captures the more efficient input use in entertainment (input growth times the difference between entertainment's GDP and input share). In all, only 8 percent of entertainment's contribution was embodied in new capital, over 60 percent was due to pure productivity growth. Under a quarter was due to the share effect and as much as 10 percent can be attributed to the input transfer effect (Table 6).Footnote 76
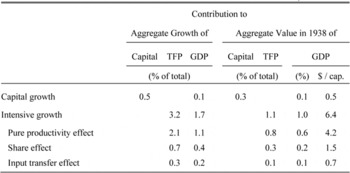
The above figures were compared to entertainment's contribution to 1938 national capital stock, TFP and GDP in Table 7. Obviously, these “level” impacts were smaller than the growth contributions, but not insubstantial. The accumulated impact of TFP growth on GDP amounted to $738 million—$24 per household—slightly above entertainment expenditure, and the accumulated impact on the 1938 national TFP level to 1.1 percent of all TFP.
CONTRIBUTION OF THE ENTERTAINMENT INDUSTRY TO GDP AND TFP GROWTH, 1900–1938

Notes:
Based on the estimates discussed in the text and the Data Appendix. The 1900 and 1938 nominal and real GDP are taken from Johnston and Williamson (“What Was U.S. GDP?”). For profits/GDP and output/GDP, the mid-year value is taken of a geometrical series based on the 1900 and 1938 ratios. The pure effect is the gross output/GDP share (the Domar weight) in 1900 times TFP growth 1900–1938, the share effect is the same times the average output share 1900–1938 minus the initial share. The input transfer effect is the average (value added/GDP) minus (entertainment input /all inputs) for 1900–1938 times the growth rate of inputs. Based on primal TFP growth. Columns 4 and 5 do not sum exactly due to rounding.
THE EFFECT OF MOTION PICTURES ON THE AGGREGATE ECONOMY, 1900–1938

Notes:
Reading example: The growth of entertainment capital accounted for 0.5 percent of aggregate capital growth, 0.1 percent of aggregate GDP growth, and the newly accumulated entertainment capital between 1900 and 1938 constituted 0.3 percent of the total national capital stock by 1938, and accounted for 0.1 percent of 1938 GDP.
Sources:
Motion pictures’ long-run TFP growth was well above the growth in many other industries at many times. It was only slower than the growth of TFP in information and communication technology (ICT) after the war. Motion pictures might be seen as the harbinger of times to come, as a “prehistoric” ICT carrying a new kind of TFP growth, driven onwards by subsequent information technologies.
Entertainment's non-insignificant share of aggregate TFP growth, of about 3 percent, made it part of the broad-based shift to accelerated productivity growth, and of the TFP surge outside manufacturing during the 1930s identified by Field.Footnote 77 Nevertheless, sharply falling prices, limited exports and a demand elasticity bounded by the 24-hour day kept entertainment's GDP share low. Motion pictures led the big league in TFP growth, but lagged in their impact on GDP.
CONCLUSION
Motion picture technology transformed entertainment performances from a rivalrous service into a non-rivalrous commodity. Using spectator-hours as output measure, entertainment output increased 27-fold between 1900 and 1938, constituting an 8.6 percent annual growth rate and a 7.2 percent annual per capita increase. The 5.4 percent annual TFP growth was higher than in any measured industry. Such rapid growth is inconsistent with the hypothesis that productivity growth in personal services is inherently lower than in manufacturing.
Entertainment's contribution to aggregate U.S. growth was substantial, accounting for almost 2 percent of GDP growth and over 3 percent of TFP growth. Only 8 percent of the growth contribution was driven by capital increases, the rest by intensive growth, with 61 percent due to the productivity effect, 22 percent to the share effect, and 10 percent to the input-shift effect. Expressing accumulated TFP growth as share of final year (1938) GDP, accumulated entertainment TFP growth accounted for about 1 percent of 1938 GDP, and 1.1 percent of the aggregate TFP level. These findings suggest personal services can also be relevant in the reinterpretation of the role of services in U.S. economic growth between 1900 and 1940.Footnote 78
Sharp productivity growth may have gone largely unnoticed in some of the most productive industries because sharp price declines combined with the natural 24-hour day limit to demand kept expenditure shares low, even as output skyrocketed. Future research might identify industries that also experienced previously unmeasured productivity jumps. We are still underestimating the wealth and pleasure that twentieth-century economic growth has brought us.