

INTRODUCTION
The concept of amnestic mild cognitive impairment MCI (aMCI) has gathered a considerable amount of research attention, particularly with regard to early identification and intervention for Alzheimer’s disease (AD), as those with aMCI are thought to be at risk for developing AD (e.g., Apostolova et al., Reference Apostolova, Dutton, Dinov, Hayashi, Toga, Cummings and Thompson2006; Ganguli, Dodge, Shen, & DeKosky, Reference Ganguli, Dodge, Shen and DeKosky2004). Longitudinal studies further support this risk factor with evidence that clinical samples of aMCI progress to AD at a rate of 10%–17% per year on average (Ferman et al., Reference Ferman, Smith, Kantarci, Boeve, Pankratz, Dickson and Petersen2013; Petersen et al., Reference Petersen, Smith, Waring, Ivnik, Tangalos and Kokmen1999; Petersen, Reference Petersen2000) with rates of conversion increasing to 38% at 2.5-year follow-up (Vos et al., Reference Vos, van Rossum, Verhey, Knol, Soininen, Wahlund and Visser2013), and 40%–56% at 4-year follow-up (Ferman et al., Reference Ferman, Smith, Kantarci, Boeve, Pankratz, Dickson and Petersen2013; Rountree et al., Reference Rountree, Waring, Chan, Lupo, Darby and Doody2007). These progression rates are opposed to an annual progression rate of 1%–2% in the general population converting from normal to dementia (Petersen & Morris, Reference Petersen, Morris and Petersen’s2003). Those with non-amnestic MCI (naMCI) represent a more heterogeneous group (Nordlund et al., Reference Nordlund, Rolstad, Hellström, Sjögren, Hansen and Wallin2005) and have a higher risk for converting to other forms of dementia such as Lewy body dementia (Csukly et al., Reference Csukly, Sirály, Fodor, Horváth, Salacz, Hidasi and Szabó2016; Ferman et al., Reference Ferman, Smith, Kantarci, Boeve, Pankratz, Dickson and Petersen2013).
Biomarker status (e.g., presence of amyloid and neurodegeneration) has been associated with differing rates of conversion to dementia thought to be driven by underlying neuropathology (see Jack et al., Reference Jack, Therneau, Wiste, Weigand, Knopman, Lowe and Petersen2016). Hippocampal atrophy is one well-established biomarker for AD (Arlt et al., Reference Arlt, Buchert, Spies, Eichenlaub, Lehmbeck and Jahn2013; Apostolova et al., Reference Apostolova, Green, Babakchanian, Hwang, Chou, Toga and Thompson2012; Eskildsen et al., Reference Eskildsen, Coupé, Fonov, Pruessner and Collins2015; Jack, Petersen, O’Brien, & Tangalos, Reference Jack, Petersen, O’Brien and Tangalos1992) and is associated with episodic memory impairment in AD samples (Peng et al., Reference Peng, Feng, He, Chen, Liu, Liu and Luo2015; Salmon, Reference Salmon and Cermak’s2000; Salmon & Bondi, Reference Salmon and Bondi2009). Those with MCI who progress to AD have MRI atrophy patterns similar to AD cohorts (Bell-McGinty et al., 2005; Risacher et al., Reference Risacher, Saykin, West, Shen, Firpi and McDonald2009; Tanpitukpongse, Mazurowski, Ikhena, & Petrella, Reference Tanpitukpongse, Mazurowski, Ikhena and Petrella2017). Specifically, hippocampal volume loss is common in aMCI (Bell-McGinty et al., 2005; Csukly et al., Reference Csukly, Sirály, Fodor, Horváth, Salacz, Hidasi and Szabó2016; Jak et al., Reference Jak, Urban, McCauley, Bangen, Delano-Wood, Corey-Bloom and Bondi2009b; Liu et al., Reference Liu, Paajanen, Zhang, Westman, Wahlund and Simmons2010; Whitwell et al., Reference Whitwell, Shiung, Przybelski, Weigand, Knopman, Boeve, Petersen and Jack2008; Zhang et al., Reference Zhang, Sachdev, Wen, Kochan, Crawford, Brodaty and Trollor2012) and is also associated with memory impairment in aMCI (Arlt et al., Reference Arlt, Buchert, Spies, Eichenlaub, Lehmbeck and Jahn2013; Bonner-Jackson, Mahmoud, Miller, & Banks, Reference Bonner-Jackson, Mahmoud, Miller and Banks2015; Peng, et al., Reference Peng, Feng, He, Chen, Liu, Liu and Luo2015). Individuals with aMCI also show significantly smaller hippocampal volumes when compared to naMCI (Csukly et al., Reference Csukly, Sirály, Fodor, Horváth, Salacz, Hidasi and Szabó2016; Kantarci et al., Reference Kantarci, Petersen, Przybelski, Weigand, Shiung, Whitwell and Jack2008).
Several studies supported the prognostic utility of hippocampal volumes in MCI using manual (Eckerström et al., Reference Eckerström, Olsson, Borga, Ekholm, Ribbelin, Rolstad and Malmgren2008), semi-automated (Riasher et al., 2009), and fully automated segmentation methods (Fritzsche et al., Reference Fritzsche, Stieltjes, Schlindwein, van Bruggen, Essig and Meinzer2010; Suppa et al., 2006; Tanpitukpongse, et al., Reference Tanpitukpongse, Mazurowski, Ikhena and Petrella2017; Yi et al., Reference Yi, Moller, Dieleman, Bouwman, Barkhof, Scheltens and Vrenken2016). Parcellation of MR-derived hippocampal volumes using manual or semi-manualized methods have been critiqued for being time-consuming and having high interrater variability (Liu et al., Reference Liu, Paajanen, Zhang, Westman, Wahlund and Simmons2010). The time-consuming nature of those methods makes it difficult to incorporate hippocampal volume assessment into busy, routine clinical practice (Suppa et al., Reference Suppa, Hampel, Keppb, Langea, Spies and Fiebach2016). Recent research suggests that fully automated segmentation algorithms through commercially available software programs address feasibility and reliability issues of manual or semi-manualized methods (Ross et al., Reference Ross, Ochs, Seabaugh and Shrader2013). Additionally, fully automated segmentation may be more sensitive in detecting subtle manifestations of pathology compared to visual assessment (Boutet et al., Reference Boutet, Chupin, Colliot, Sarazin, Mutlu and Drier2012; Ross et al., Reference Ross, Ochs, Seabaugh and Shrader2013). Despite these advantages, the clinical utility and validity of automated methods is still being established, as these methods have been more commonly used in research paradigms. For example, Neuroreader™ (Brainreader, Horsens, Denmark) is a commercially available software that quantifies brain volumes relative to healthy controls (Ahdidan et al., Reference Ahdidan, Raji, DeYoe, Mathis, Noe, Rimestad and Lopez2016). Neuroreader™ was validated as a useful tool to assess hippocampal volumes in a sample of individuals with MCI and AD from the Alzheimer Disease Neuroimaging Initiative (ADNI) database (Ahdidan et al., Reference Ahdidan, Raji, DeYoe, Mathis, Noe, Rimestad and Lopez2016). In another study, hippocampal volumes quantified via Neuroreader™ was the best predictor of conversion from MCI to AD (ADNI sample) at 3-year follow-up compared to multiple other regional volumes (Tanpitukpongse et al., Reference Tanpitukpongse, Mazurowski, Ikhena and Petrella2017). Despite its availability for use clinically, no studies have compared Neuroreader™-derived hippocampal volumes between clinical samples of MCI types (i.e., aMCI versus naMCI) or in relation to cognitive functioning. Examining the relationship between memory test performance and Neuroreader™-derived hippocampal volumes in a clinical sample of MCI patients may yield clinical utility.
Another potential limitation in the volumetric literature is that many prior volumetric studies in MCI had identified the sample using conventional Petersen/Winblad criteria, which uses a cutoff of >1.5 standard deviations (SDs) below the normative mean on one test in one cognitive domain to denote cognitive impairment (Petersen et al., Reference Petersen, Smith, Waring, Ivnik, Kokmen and Tangelos1997; Petersen et al., Reference Petersen, Smith, Waring, Ivnik, Tangalos and Kokmen1999; Winblad et al., 2004). A critique of this MCI definition is that several studies have demonstrated that it is common for cognitively healthy individuals to obtain one abnormal test score (Brooks, Iverson, Holdnack, & Feldman, Reference Brooks, Iverson, Holdnack and Feldman2008; Heaton, Miller, Taylor, & Grant, 2004; Palmer, Boone, Lesser, & Wohl, Reference Palmer, Boone, Lesser and Wohl1998). For example, using a cutoff of >1.0 SD below the mean, Heaton et al. (2004) showed that 87% of normal adults had one impaired score when administered a battery that included at least 25 tests. When using a cutoff of >1.5 SD below the mean, Brooks et al. (Reference Brooks, Iverson, Holdnack and Feldman2008) showed that 26% of healthy older adults had at least one impaired memory score when compared to age-adjusted means and 39% had at least one impaired memory score when compared to demographically adjusted means. Additionally, more than 20% of healthy older adults obtained one impaired score in two different domains, but far fewer (5% or less) demonstrated two or more impaired scores in the same domain (Palmer et al. Reference Palmer, Boone, Lesser and Wohl1998), suggesting that two impaired scores within the same cognitive domain is more clinically meaningful. Given known base rates of impaired test scores in the normal population, the Petersen/Winblad criteria has been criticized for being prone to false-positive diagnostic errors (Clark et al., Reference Clark, Delano-Wood, Libon, McDonald, Nation, Bangen and Bondi2013; Edmonds et al., Reference Edmonds, Delano-Wood, Clark, Jak, Nation and McDonald2015; Jak et al., Reference Jak, Preis, Beiser, Seshadri, Wolf, Bondi and Au2016).
Others have used a more liberal definition of the Petersen criteria and allowed a >1.0 SD below the mean on one test to define MCI (Busse, Hensel, Guhne, Angermeyer, Riedel-Heller, Reference Busse, Hensel, Guhne, Angermeyer and Riedel-Heller2006) or more conservative criteria (>2.0 SD below the mean) to demarcate impairment (Bickel, Mösch, Seigerschmidt, Siemen, Förstl, Reference Bickel, Mösch, Seigerschmidt, Siemen and Förstl2006). To improve diagnostic precision, Jak, Bondi, and colleagues proposed using a cutoff of >1.0 SD below the normative mean on two tests within the same domain to reflect cognitive impairment (Jak et al., Reference Jak, Bondi, Delano-Wood, Wierenga, Corey-Bloom, Salmon and Delis2009a). When comparing the Petersen/Winblad and Jak/Bondi criteria, prevalence rates of MCI varied greatly within and across studies depending on which criteria was used (Jak et al., Reference Jak, Bondi, Delano-Wood, Wierenga, Corey-Bloom, Salmon and Delis2009a; Jak et al., Reference Jak, Preis, Beiser, Seshadri, Wolf, Bondi and Au2016; Schinka et al., Reference Schinka, Loewenstein, Raj, Schoenberg, Banko, Potter and Duara2010; Tritschuh et al., Reference Trittschuh, Crane, Larson, Cholerton, McCormick, McCurry and Craft2011). Risk of development of dementia has also varied depending on MCI criteria used (Ganguli et al., Reference Ganguli, Snitz, Saxton, Chang, Lee, Vander Bilt and Petersen2011; Jak et al., Reference Jak, Preis, Beiser, Seshadri, Wolf, Bondi and Au2016). For example, those with aMCI multiple domain were at 8.5 times greater risk for developing dementia when classified with the Jak/Bondi criteria, compared to 4.7 times greater risk when classified with the Petersen/Winblad criteria (Jak et al., Reference Jak, Preis, Beiser, Seshadri, Wolf, Bondi and Au2016).
In addition to differences in rates of MCI prevalence and conversion to dementia that vary based on which diagnostic criteria were used, differences in hippocampal volumes have been also observed. For example, hippocampal volumes were significantly smaller in aMCI compared to cognitively normal community-dwelling older adults when the Jak/Bondi criteria were applied to the sample, but there were no hippocampal volume differences between aMCI and cognitively normal individuals when the Petersen/Winblad criteria were applied to the same sample (Jak et al., Reference Jak, Urban, McCauley, Bangen, Delano-Wood, Corey-Bloom and Bondi2009b), suggesting that use of the Petersen/Winblad MCI criteria may have yielded some false positives. The lack of a gold standard diagnostic criteria for MCI poses challenges for interpreting findings showing differences between MCI types, as it may be difficult to determine whether differences between MCI types are due to different diagnostic strategies or intrinsic neuropathological or etiological differences (Jak et al., Reference Jak, Urban, McCauley, Bangen, Delano-Wood, Corey-Bloom and Bondi2009b).
The aims of the present study are (1) to compare Neuroreader™ hippocampal z-scores between aMCI and naMCI in a clinical sample and (2) to examine the association between Neuroreader™ hippocampal z-scores and performance on measures of memory that are commonly used in clinical neuropsychological evaluations. It was hypothesized that hippocampal z-scores would be significantly lower in aMCI compared to both naMCI and the Neuroreader™ mean, and that hippocampal z-scores would be significantly correlated with delayed memory measures in aMCI. A third aim was to explore whether hippocampal z-score differences between MCI groups and association with memory tests remained consistent when the sample was classified using two different MCI diagnostic classification criteria (Petersen/Winblad and Jak/Bondi).
METHOD
Participants
Patient information was extracted from an archival database of patients with MCI who were evaluated clinically in an outpatient clinic between 2016 and 2019. Diagnosis of MCI was made based on the Diagnostic and Statistical Manual-5th edition criteria (American Psychiatric Association, 2013). Inclusion criteria for this study included clinical diagnosis of MCI, at least two standardized neuropsychological tests administered in each cognitive domain (i.e., memory, attention/processing speed, executive functioning, language, and visuospatial abilities), a minimum word reading standard score of 70 based on performance on the Wide Range Achievement Test-4th edition (WRAT4; Wilkinson & Robertson, Reference Wilkinson and Robertson2006), and brain MRI postprocessing with Neuroreader™ within approximately 1 year of patients’ neuropsychological evaluation (M = 92.96 days, SD = 88.61 days, range 0–373 days). Exclusion criteria were focal neurological illness, such as stroke or traumatic brain injury, and severe or persistent psychiatric comorbidities. The initial sample included 121 patients; 33 patients were excluded due to brief neuropsychological testing with less than two tests in each domain, three were excluded because their brain MRI did not include postprocessing with Neuroreader™, and three were excluded because they did not have any test scores that met criteria for cognitive impairment. The final sample included 82 participants.
Procedures
Participants were then classified into MCI subtypes using both Petersen/Winblad criteria (Petersen et al., Reference Petersen, Smith, Waring, Ivnik, Kokmen and Tangelos1997; Petersen et al., Reference Petersen, Smith, Waring, Ivnik, Tangalos and Kokmen1999; Winblad et al., 2004) and Jak/Bondi criteria (Jak et al., Reference Jak, Bondi, Delano-Wood, Wierenga, Corey-Bloom, Salmon and Delis2009a). For a cognitive domain to be considered impaired by Petersen/Winblad criteria, at least one test within one cognitive domain was at least 1.5 SD below the mean (Petersen et al., Reference Petersen, Smith, Waring, Ivnik, Kokmen and Tangelos1997). Per Jak/Bondi criteria, a cognitive domain is considered impaired if two or more measures within the same cognitive domain were at least 1.0 SD below the mean (Jak et al., Reference Jak, Bondi, Delano-Wood, Wierenga, Corey-Bloom, Salmon and Delis2009a). Specific MCI subtypes included aMCI single domain (memory impairment only), aMCI multidomain (impairment in memory and at least one other cognitive domain), naMCI single domain (impairment in one non-memory cognitive domain), or naMCI multidomain (impairment in two or more non-memory cognitive domains).
Measures
Neuropsychological tests
Neuropsychological testing batteries varied to some degree, as this study was conducted with a clinical sample. Memory measures for most participants included the Logical Memory and Visual Reproduction subtests from the Wechsler Memory Scale-IV (WMS-4; Wechsler, Reference Wechsler2009) and the Hopkins Verbal Learning Test-Revised (HVLT-R; Brandt & Benedict, Reference Brandt and Benedict2001). In place of the HVLT-R, 10 participants (12% of the sample) were administered the California Verbal Learning Test-II (CVLT-II; Delis, Kramer, Kaplan, & Ober, Reference Delis, Kramer, Kaplan and Ober2000) and 1 participant was administered the Rey Auditory Verbal Learning Test (AVLT; Geffen, Hoar, O’Hanlon, Clark, & Geffen, Reference Geffen, Hoar, O’Hanlon, Clark and Geffen1990; Lezak, 1983). In place of WMS-IV Visual Reproduction, five participants (6% of the sample) had the Brief Visuospatial Memory Test-Revised (Benedict, Reference Benedict1997). All tests were administered and scored according to standardized procedures by trained psychometricians, predoctoral graduate students, clinical neuropsychology fellows, and/or clinical neuropsychologists. Normative scores were derived from test manuals.
Imaging acquisition and postprocessing
All participants underwent a brain MRI (T1) for clinical purposes on a 3.0T scanner (Sequence name: Thin slice Sag 3D Neuroreader; Slice thickness: 1.2 mm; Spacing: 1.2 mm; Mag field strength: 3T; Pulse sequence: GRE; TE: 3.2; TR: 8.2; TI: 600; Flip angle: 8; Matrix: 256 × 256). Images were processed with Neuroreader™, which is a software that is FDA-cleared for the purpose of automatic labeling, visualization, and volumetric quantification of segmentable brain structures from a set of MR images. Color-coded segmentation maps were over-lain on thin slice MRI images in axial, sagittal, and coronal planes to check for segmentation accuracy. The program outputs a standardized z-score to quantify a specific subject’s volume relative to an age- and gender-matched normative sample. Over 30 cortical and subcortical brain volumes are transformed into z-scores. For a more detailed description of this program, including the Neuroreader™ algorithm and its strategy for dealing with population variability, see Ahdidan et al. (Reference Ahdidan, Raji, DeYoe, Mathis, Noe, Rimestad and Lopez2016). Hippocampal z-scores were used in all analyses that included hippocampal metrics.
The Neuroreader™ normative sample is presumably normal healthy individuals per information reported in the Neuroreader™ manual, which states that all individuals present in the ADNI database that were classified as “normal” and underwent a T1-weighted MRI in accordance to the ADNI scanning protocol were selected as the normative reference sample (Neuroreader™, 2020). This sample consisted of 218 individuals (100 women aged 62–90 years and 118 men aged 60–88 years). Per ADNI, the inclusion criteria for normal controls requires no memory complaints aside from those common to other normal subjects of that age range; normal memory function documented by scoring at specific cutoffs on the Logical Memory II subscale from the Wechsler Memory Scale-Revised; MMSE score between 24 and 30; Clinical Dementia Rating score of 0 as well as a score of 0 on the Memory Box; and cognitively normal based on absence of significant impairment in cognitive functions or activities of daily living (ADNI, n.d.). For interested readers, more information about cognitively normal individuals in the ADNI study can be found at http://adni.loni.usc.edu/. Additional information about the Neuroreader™ normative sample beyond what is reported in the manual is not available in the public domain as that information has been deemed proprietary.
Data Analyses
All statistical analyses were performed with SPSS version 24.0. Given discrepant n’s across the four MCI subtypes (Petersen/Winblad: 17 aMCI-single domain, 44 aMCI-multiple domain, 10 naMCI-single domain, and 11 naMCI-multiple-domain; Jak/Bondi: 21 aMCI-single-domain, 29 aMCI-multiple domain, 12 naMCI-single domain, and 8 naMCI-multiple-domain), MCI subtypes were collapsed into aMCI and naMCI for analyses. Cohen’s kappa was used to examine the rate of agreement between MCI classification methods (i.e., Petersen/Winblad vs. Jak/Bondi method) for aMCI and naMCI. Independent samples t tests were used to examine group differences (aMCI vs. naMCI) on demographic variables, mean hippocampal volume z-scores, and mean memory test performances. Cohen’s d was calculated as a measure of effect size. One-sample t tests were used to compare mean hippocampal z-scores to the NeuroReader™ age- and gender-matched mean (mean z-score of 0) within aMCI and naMCI groups. Pearson product-moment correlation coefficients were calculated to examine associations between mean hippocampal volume z-scores and memory test performance in aMCI and naMCI. We did not include the CVLT-II, AVLT, or Brief Visuospatial Memory Test-Revised (BVMT-R) in correlational analyses due to the small number of participants that were administered those tests. Fischer’s r-to-z transformations were conducted to compare the magnitude of correlations between MCI classification methods. Scatterplots were generated to further illustrate the relationship between significant correlations. The main analyses were conducted twice (once with groups classified by the Petersen/Winblad criteria and once with groups classified by the Jak/Bondi method) to examine if results remained consistent by method of MCI classification. Nonparametric alternatives to independent samples t tests (e.g., chi-square and Mann–Whitney tests) and Pearson’s correlations (e.g., Spearman’s rho) were used where appropriate. For example, recognition memory tests were treated as ordinal data because percentile ranks for both adult and older adult versions of the same task were combined into one variable.
RESULTS
Sample Characteristics and MCI Classifications
The entire sample (N = 82) ranged in age from 44 to 89 years (M = 71.90, SD = 8.38), with 47 (57.3%) males and 35 (42.7%) females. The majority of the sample was Caucasian (92.7%) and the remaining identified as Black (7.3%). Education levels for the sample ranged from 12 to 20 years (M = 15.56, SD = 2.66). Using standard interpretative guidelines from the literature (Landis & Koch, Reference Landis and Koch1977), there was a substantial level of agreement between methods of MCI classification (κ = .735, p < .001). All 82 patients met criteria for MCI based on Petersen/Windblad criteria. When classified into MCI types using the Petersen/Winblad criteria, 61 (74.4 %) were classified as aMCI and 21 (25.6 %) as naMCI. When classified using the Jak/Bondi criteria, 12 (14.6%) patients no longer met criteria for MCI. Of the remaining 70 patients, 50 (71.4 %) were classified as aMCI and 20 (28.5 %) were classified as naMCI using the Jak/Bondi criteria.
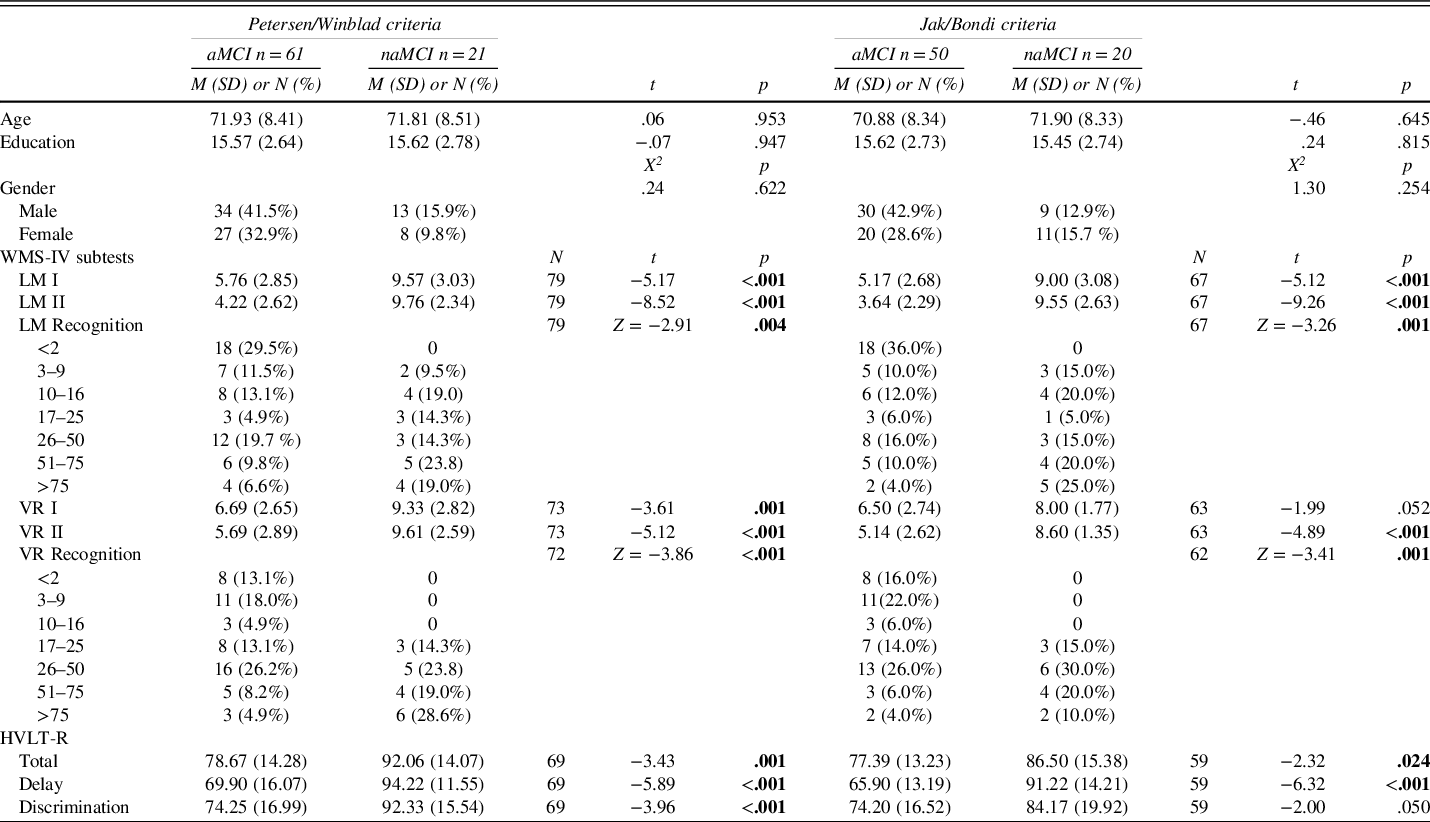
Demographic information for the sample by MCI type and by MCI classification criteria are presented in Table 1. Results of independent samples t tests showed no significant differences between the aMCI and naMCI on age [t(80) = .06, p = .95] or education [t(80) = −.07, p = .95] when categorized with the Petersen/Winblad criteria. Similarly, aMCI and naMCI groups did not differ on demographic variables when categorized with the Jak/Bondi criteria: age, t(68) = −.46, p = .65, and education: t(68) = .24, p = .82. Mean scores on memory measures by MCI type and classification criteria are also provided in Table 1. Results of t tests showed significant group differences across the majority of memory tests (p’s < .05) with lower memory scores in the aMCI group compared to naMCI.
Descriptive statistics by MCI group and MCI classification method

Bolded p values represent statistically significant differences.
Note. WMS-IV LM I and LM II, Wechsler Memory Scale, 4th Edition, Logical Memory Immediate Recall and Delayed Recall; VR I and VR II, Visual Reproduction Immediate and Delayed Recall; HVLT-R, Hopkins Verbal Learning Test-Revised; all neuropsychological test scores are reported as scaled scores except standard scores were used for the HVLT, and percentile ranges were used for the WMS-IV LM and VR Recognition scores.
Hippocampal z-Scores by MCI Type
Displayed in Figure 1 are mean hippocampal z-scores in aMCI and naMCI and within each MCI classification criteria. Results of an independent samples t test revealed hippocampal z-scores were significantly lower in the aMCI (M = −.25, SD = .62) compared to naMCI (M = .05, SD = .45) when groups were classified by the Petersen/Winblad criteria, t(80) = −2.04, p = .045, d = .55. Similarly, when groups were classified by the Jak/Bondi criteria, hippocampal z-scores were significantly lower in the aMCI (M = −.36, SD = .58) compared to naMCI (M = .04, SD = .44) group, t(68) = −2.76, p = .008, d = .77. Results of one-sample t tests showed that hippocampal z-scores were significantly different from 0 in aMCI when Jak/Bondi criteria were applied: t(49) = −4.33, p < .001. Hippocampal z-scores were not significantly different from 0 in naMCI: t(19) = .42, p = .68. Similarly, when Petersen/Winblad criteria were used to classify MCI groups, hippocampal z-scores were significantly different from 0 in aMCI, t(60) = −3.10, p = .003, but not naMCI, t(20) = .55, p = .59.
Mean hippocampal z-scores by MCI subtype and criteria are displayed. Error bars represent standard deviations. *Mean difference is significant at the p < . 05 level (two-tailed).

Association Between Hippocampal z-Scores and Memory Performance
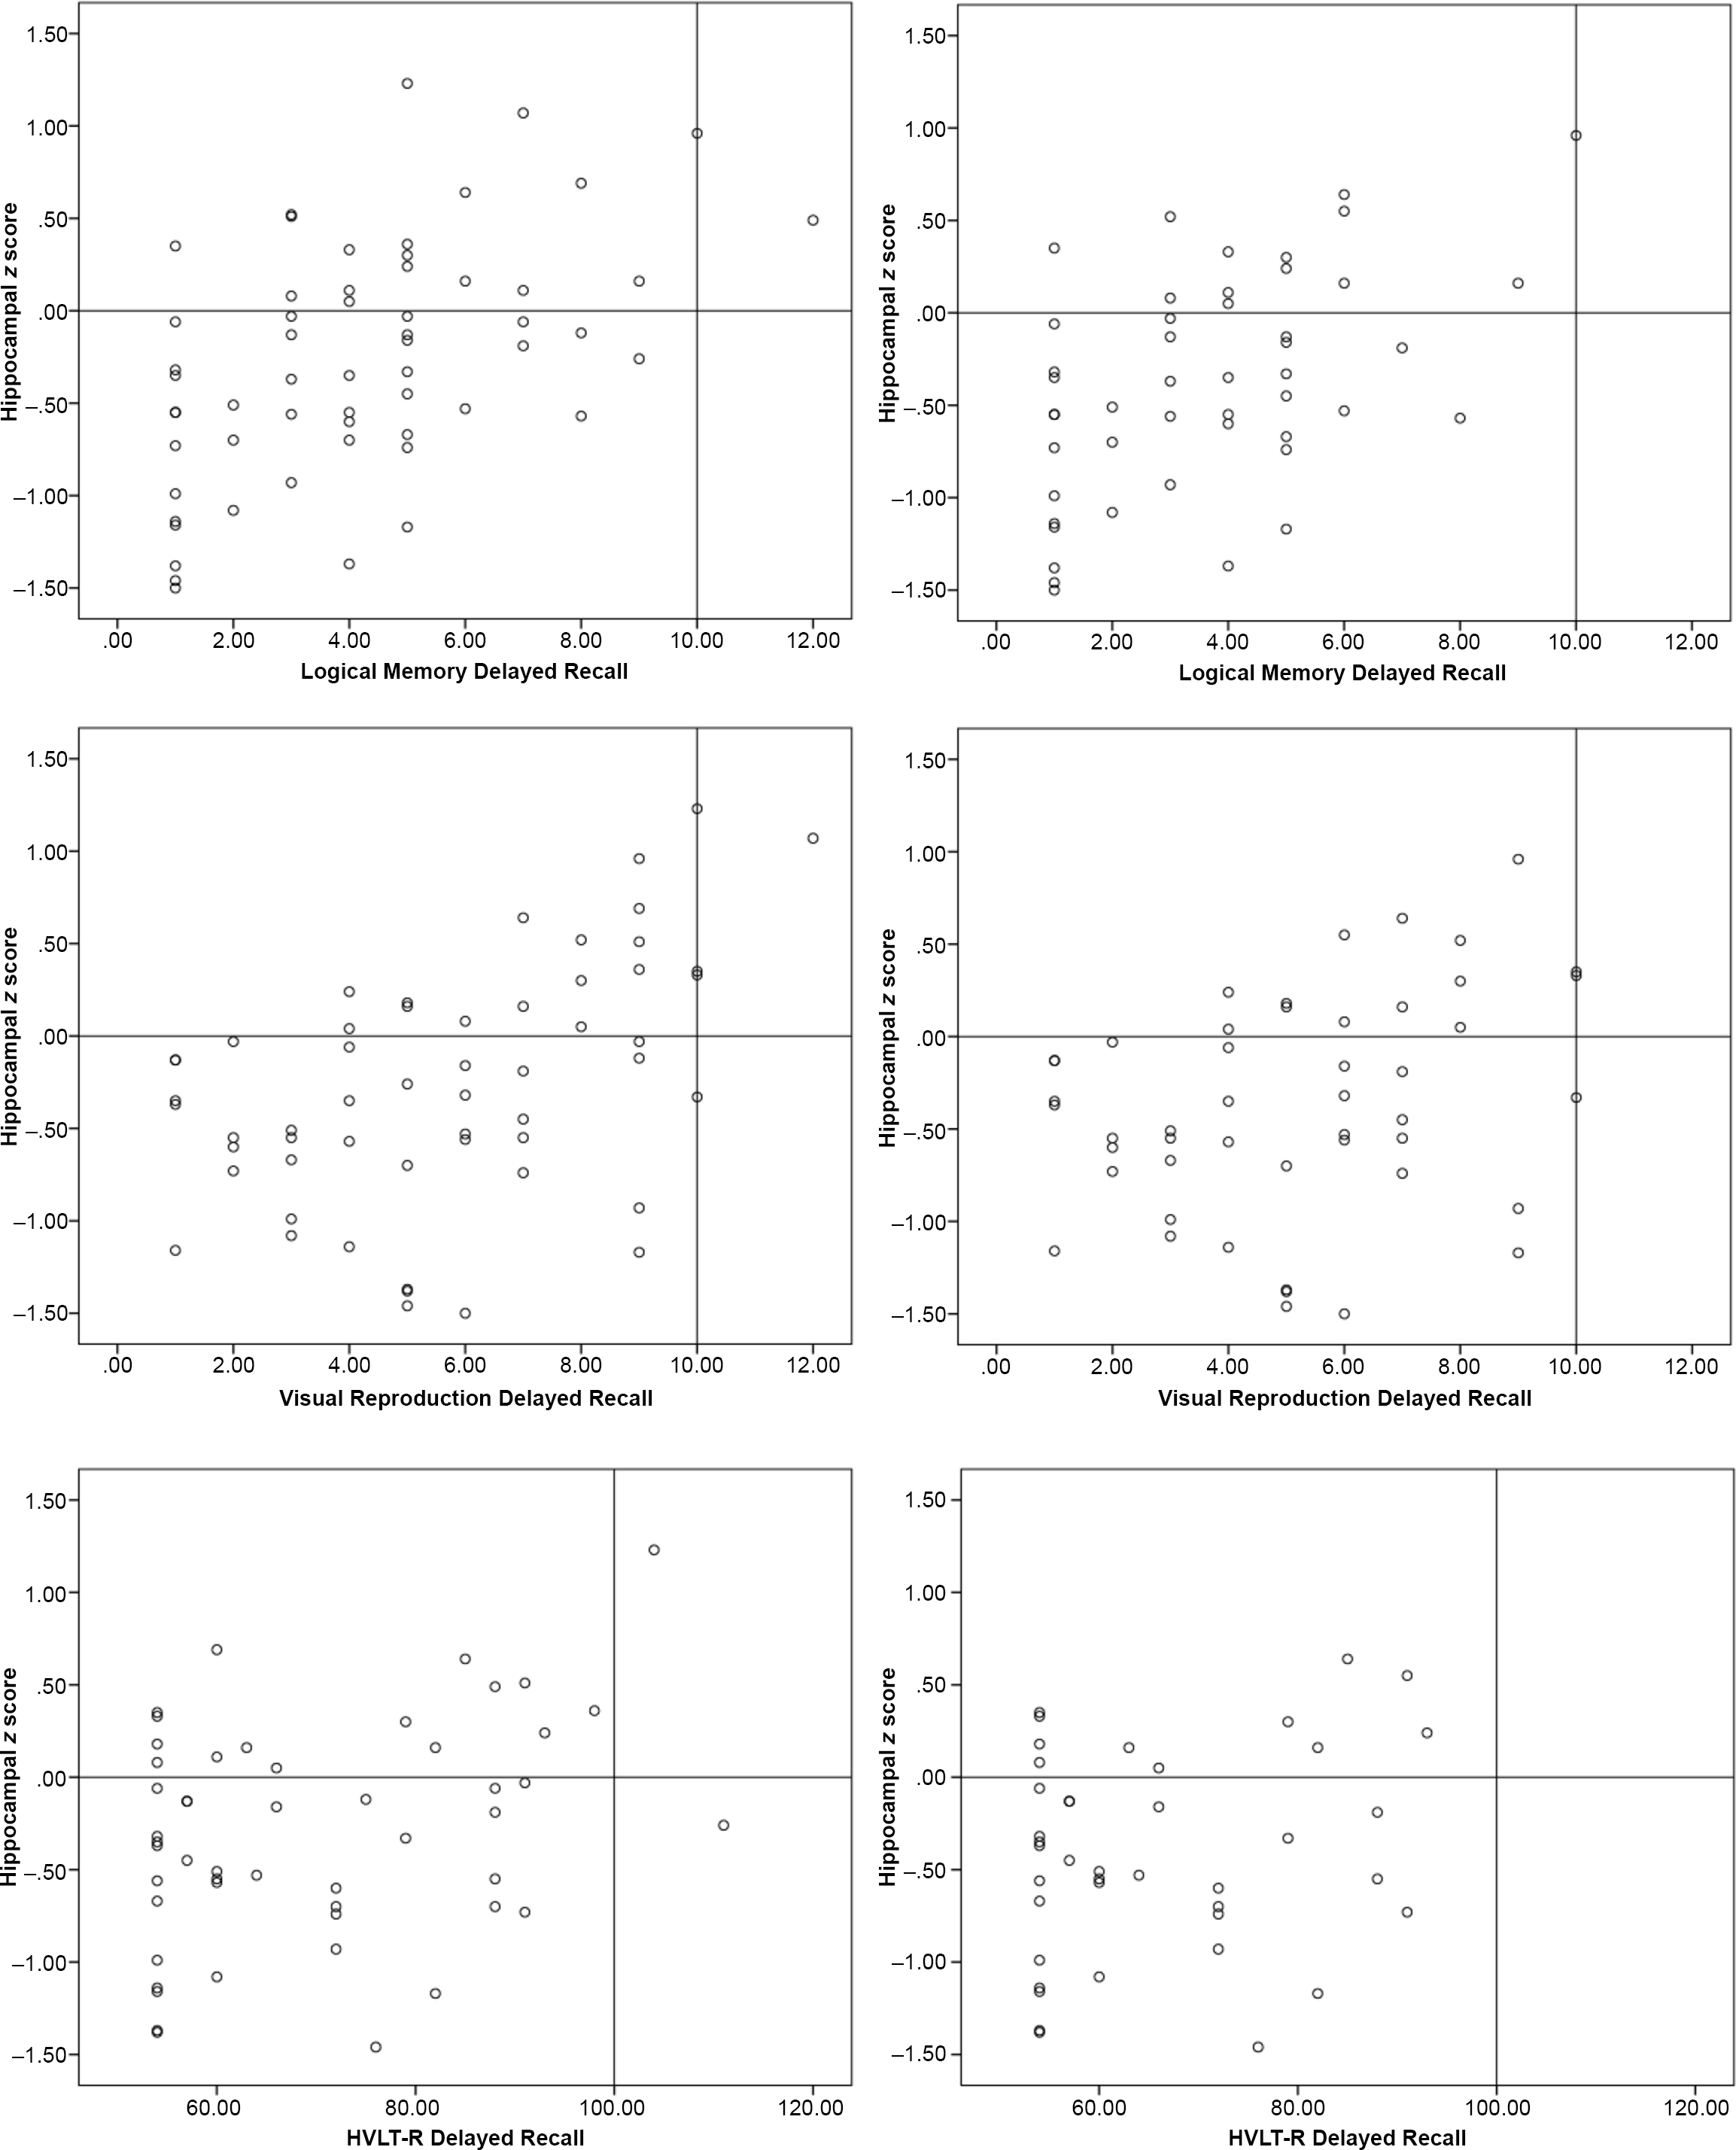
Table 2 provides results from correlational analyses in aMCI. Mean hippocampal z-scores were significantly and positively correlated with most tests of verbal and visuospatial delayed recall in aMCI using either classification criteria (p’s < .05). Fischer’s r-to-z transformations showed that the strength in correlations did not differ by MCI classification (p’s > .05). Scatterplots displaying the relationship between hippocampal z-scores and delayed recall measures in aMCI groups are shown in Figure 2. There were no significant correlations between hippocampal z-scores and memory measures in naMCI using either classification criteria (p’s > .05).
Correlations between hippocampal z-scores and memory scores in aMCI by diagnostic method

Note: LM I and LM II, WMS-IV Logical Memory Immediate Recall and Delayed Recall (scaled scores); LM Rec, WMS-IV Logical Memory Recognition (percentile range); VR I and VR II, WMS-IV Visual Reproduction Immediate and Delayed Recall (scaled scores); VR Rec, WMS-IV Visual Reproduction Recognition (percentile range); and HVLT-R Disc, Hopkins Verbal Learning Test-Revised Discrimination Index (Total Recall, Delayed Recall, and Discrimination Index are standard scores). Petersen/Winblad criteria memory test N’s ranged from 52 to 61 and Jak/Bondi criteria memory test N’s ranged from 41 to 50.
* Correlation is significant at the .05 level (2-tailed).
** Correlation is significant at the .01 level (2-tailed).
Scatterplots illustrating relationships between hippocampal z-scores and delayed recall measures in aMCI. The left column is the aMCI group defined by Petersen/Winblad criteria and the right column is the aMCI group defined by Jak/Bondi criteria. Each plot displays lines delineating the 50th percentile for both axes (y-axis z = 0.0, x-axis ss = 10 for Logical Memory and Visual Reproduction delayed recall and SS = 100 for HVLT-R delayed recall).

DISCUSSION
In a clinical sample of patients with MCI, we used a novel, FDA-cleared method of quantifying hippocampal volumes (Neuroreader™) and examined associations between hippocampal volume z-scores and commonly used measures of learning and memory. Our main findings include 1) lower hippocampal z-scores in aMCI compared to naMCI and compared to the Neuroreader™ healthy reference sample; 2) moderate, positive correlations between hippocampal z-scores and verbal and visual delayed recall; and 3) main findings 1 and 2 remained similar irrespective of the MCI classification criteria used (conventional Petersen/Winblad vs. Jak/Bondi).
Our findings suggest more hippocampal atrophy was present in the aMCI group compared to the naMCI group and compared to the mean of the normative sample, which is consistent with the vast literature showing hippocampal atrophy in aMCI (e.g., Csukly et al., Reference Csukly, Sirály, Fodor, Horváth, Salacz, Hidasi and Szabó2016; Jak et al., 2009; Liu et al., Reference Liu, Paajanen, Zhang, Westman, Wahlund and Simmons2010; Whitwell et al., Reference Whitwell, Shiung, Przybelski, Weigand, Knopman, Boeve, Petersen and Jack2008). Our findings also suggest that reduced hippocampal volumes are related to the degree of episodic memory impairment in a clinical sample of aMCI, consistent with prior literature (e.g., Arlt et al., Reference Arlt, Buchert, Spies, Eichenlaub, Lehmbeck and Jahn2013; Bonner-Jackson, et al., Reference Bonner-Jackson, Mahmoud, Miller and Banks2015; Peng, et al., Reference Peng, Feng, He, Chen, Liu, Liu and Luo2015). Given volumetric findings were not due to varying operational definitions of MCI, this suggests there is an inherent neuroanatomical distinction (i.e., hippocampal volume differences) between aMCI and naMCI that was identified using Neuroreader™. While Jak et al. (Reference Jak, Urban, McCauley, Bangen, Delano-Wood, Corey-Bloom and Bondi2009b) found that hippocampal volume differences across groups varied as a function of specific MCI criteria, our findings may be discrepant partly due to sample differences (our study used a clinical sample and had a larger sample size). The higher rate of agreement between the Petersen/Winblad and Jak/Bondi MCI classification criteria in the current study was also inconsistent with prior research (Jak et al., Reference Jak, Bondi, Delano-Wood, Wierenga, Corey-Bloom, Salmon and Delis2009a), which may also reflect differences in sample composition (i.e., a clinical sample comparing aMCI and naMCI vs. a community sample that compared normals to MCI). Perhaps there is greater agreement between Petersen/Winblad and Jak/Bondi classification schemes when dichotomizing between clinical MCI types (i.e., amnestic vs. non-amnestic) than when dichotomizing between MCI and normal. Overall, our findings contribute to the literature surrounding operational definitions of MCI by showing evidence of correlated neuroanatomical changes (i.e., hippocampal volumes) via Neuroreader™ associated with memory performance for two commonly used neuropsychological MCI criteria.
The development and clinical application of quantitative measures or indicators of early brain disease has been a major goal of preventative neuroradiology, particularly in the area of aging and cognitive decline (Raji et al., Reference Raji, Eyre, Wei, Bredesen, Moylan, Law and Vernooij2015). Our study contributes to this growing body of literature by showing expected relationships between well-established measures of memory and hippocampal volumes quantified via an FDA-cleared automated imaging analysis program. However, examination of these relationships raises additional questions regarding the clinical meaningfulness and interpretability of Neuroreader™ hippocampal z-scores. Specifically, while the mean delayed recall scores in aMCI groups were abnormal (means < 5th percentile) as expected, the mean hippocampal z-scores for aMCI groups were within the average range (z = −.36 and −.25). Yet, just because two measures are correlated, does not necessarily mean they have high agreement; the scatterplots show there are some individuals with “normal” hippocampal z-scores but impaired memory scores. If one were to interpret volumetric z-scores in the same lens as normed neuropsychological z-scores, an “average” hippocampal z-score interpreted in isolation may not be meaningful if some individuals with normal z-scores still perform poorly on memory testing. Moreover, while research supports that hippocampal volume is a predictor of progression to AD, it is unclear what an average hippocampal z-score suggests about progression to dementia (this cannot be evaluated in a cross-sectional study). The normative score that one attains relies partly on the characteristics of the normative sample. If we apply that same concept to volumetric z-scores, it is possible that the mean hippocampal z-scores in the average range in our sample is partly related to characteristics of the Neuroreader™ normative group. Unfortunately, we are unable to explore this as additional information about the Neuroreader™ sample beyond what is reported in the manual is not available, which is a limitation for this study. Given the use of Neuroreader™ in clinics, a closer examination of the psychometric properties of the data produced from this tool, in conjunction with neuropsychological data, is necessary. Longitudinal data will help elucidate the significance of discordant versus concordant Neuroreader™ and neuropsychological data. Results from Neuroreader™ should not be used to make diagnostic decisions in isolation, rather, data need to be considered in the context of the larger clinical workup.
Additional limitations include the small sample size and discrepant sample sizes between aMCI and naMCI. However, despite our small sample size, we found significant hippocampal z-score differences between groups with a medium effect size, indicating a meaningful difference. Additionally, our sample size is comparable or slightly larger to similarly published studies (e.g., Bonner-Jackson et al., Reference Bonner-Jackson, Mahmoud, Miller and Banks2015; Jak et al., Reference Jak, Urban, McCauley, Bangen, Delano-Wood, Corey-Bloom and Bondi2009b). Since a clinical sample was used and the decision of which cognitive tests to administer was made at the time of the patient’s clinical evaluation, a small percentage of participants were administered different memory tests (e.g., CVLT-II, AVLT, and BVMT-R) and therefore excluded from the correlational analyses. We also used a cross-sectional design, which is limiting in that we cannot confirm if those with aMCI and hippocampal volume loss in our sample will progress to AD. However, recent research has suggested good prognostic utility of Neuroreader™-derived hippocampal volumes (Tanpitukpongse et al., Reference Tanpitukpongse, Mazurowski, Ikhena and Petrella2017), and we plan to follow these clinical groups over time. Lastly, Neuroreader™ itself has limitations including that it does not allow for examination of hippocampal subfields, some of which may be more sensitive to memory impairment at the aMCI stage (Broadhouse et al., Reference Broadhouse, Mowszowski, Duffy, Leung, Cross, Valenzuela and Naismith2019).
Despite limitations, several strengths should be highlighted, including the use of a neurologic memory disorders clinic population that had comprehensive neuropsychological evaluations and neuroimaging within approximately 1 year of evaluation, use of a novel, FDA-cleared method for segmenting hippocampal volumes that provide objective data, and application of two different MCI classification methods commonly used in the literature. We also examined Neuroreader™-derived hippocampal volumes in both aMCI and naMCI and in association with memory test performance, which, to the best of our knowledge, has not been examined in prior research.
At present, there is minimal research showing the clinical utility of Neuroreader™. Large-scale, longitudinal research using Neuroreader™ is needed to determine its diagnostic and prognostic utility, particularly as NeuroReader™ becomes increasingly utilized clinically in aging populations. Future research should investigate the clinical utility of NeuroReader™ volumetrics by examining relationships between quantified brain volumes, including possible patterns of laterality as it relates to neuropsychological performance, and other measures of neuropsychological functioning beyond memory.
FINANCIAL SUPPORT
The authors report no financial support.
CONFLICTS OF INTEREST
The authors have nothing to disclose.
ETHICAL STANDARDS
This retrospective study was approved by the Institutional Review Board at the Medical College of Wisconsin and conducted in compliance with the Helsinki Declaration.