

The theory of retrospective voting states that voters decide which party to vote for based on retrospective assessments of government performance (Key Reference Key1966; Lewis-Beck and Stegmaier Reference Lewis-Beck and Stegmaier2000). Traditionally, this mechanism has been mostly investigated on the level of the incumbent party or parties: voters evaluate incumbent performance and vote accordingly (Fiorina Reference Fiorina1981; Lewis-Beck and Stegmaier Reference Lewis-Beck and Stegmaier2000). More recently, however, a new, broader, view on retrospective voting has gained traction. Arguing that the mechanism works on the level of political parties – for incumbent parties and parties in opposition alike – recent studies have found evidence that the retrospective voting mechanism works for parties in opposition as well (Plescia and Kritzinger Reference Plescia and Kritzinger2017; Stiers Reference Stiers2019b).
From a democratic point of view, it is important that voters evaluate opposition parties. Voters can only hold incumbents accountable for their performance at election times. Opposition parties have a crucial role in the checks and balances of government, as they need to monitor the incumbent's performance and continually hold the government accountable for their actions (Holzhacker Reference Holzhacker2002); as Ludger Helms (Reference Helms2008: 9. 7) bluntly puts it, ‘There can be no real democracy without opposition.’ However, by itself, there are no strong incentives for opposition parties to take on this important role. If retrospective voters only take into account their judgements of incumbent performance, opposition parties' efforts would go unnoticed, and there is no reason why they would invest effort and time in monitoring the government. Rather, in a strict interpretation of this model, as has been argued by V.O. Key (Reference Key1966), the opposition can only gain support when incumbents perform poorly. It has been widely recognized, though, that the opposition plays a crucial role in the political process as well (Andeweg Reference Andeweg, Müller and Narud2013; Dahl Reference Dahl1966; Garritzmann Reference Garritzmann2017). Furthermore, research has indicated that, at least in some countries, opposition has intensified, increasing the need for scholarly study of the opposition (Loxbo and Sjölin Reference Loxbo and Sjölin2017).
In this article, I build on the argument that voters assess the efforts of opposition parties as ‘running in opposition’, and that these evaluations are also taken into account when they decide which party to support (Plescia and Kritzinger Reference Plescia and Kritzinger2017; Stiers Reference Stiers2019a). Being aware that they are subject to voter scrutiny as well, opposition parties are incentivized to take on their important role. For this mechanism, clear arguments need to be made about what it is exactly that voters consider when they evaluate the performance of any given party (Butt Reference Butt2006). Incumbent parties can rather straightforwardly be evaluated for the outcomes of their policies – especially on valence issues (Stokes Reference Stokes1963). However, when it comes to running in opposition, it is less clear what constitutes ‘good’ or ‘bad’ opposition.
Given the importance of this mechanism, this study uses an exploratory design to examine what exactly voters think about when they evaluate the performance of opposition parties. Analysing answers to an open-ended question, the results show that voters appreciate opposition parties that closely monitor the government's actions and decisions, work constructively with the incumbent parties and present a clear alternative. Voters dislike overly negative and unconstructive opposition. Additional results reveal that those who evaluate opposition parties in a ‘positive’ way are mainly voters who are in general satisfied with the democratic process and partisans of opposition parties. Furthermore, opposition parties are also held responsible for the state of affairs in the country – especially the parties that are disliked by the voters.
Evaluation of opposition parties
While research on retrospective voting mostly concentrated on support for incumbent parties, it also pointed to a broader mechanism including support for the opposition and non-voting (Mughan and Lacy Reference Mughan and Lacy2002; Tillman Reference Tillman2008). More recently, it was argued that retrospective voting can work on the level of political parties as well – including parties in opposition. In their study, Carolina Plescia and Sylvia Kritzinger (Reference Plescia and Kritzinger2017: 157, emphasis in original) argue in favour of this wider notion of accountability, in which ‘the public holds their representatives – and not only the government – accountable for the country's current state of affairs’. Investigating the German case, they find that evaluations of all parties matter in explaining the vote – a finding later replicated in the Icelandic case (Stiers Reference Stiers2019b). Building on this research, Dieter Stiers (Reference Stiers2019a) reached the same conclusion using cross-national data. Focusing on evaluations of the party voters voted for in the last election, he finds that satisfied voters are more likely to vote for the same party again, while dissatisfied voters are more likely to switch party choice – and this is true for incumbent and opposition voters alike (see also Söderlund, Reference Söderlund2008).
Looking at people's evaluations of opposition performance, it is important to note that opposition parties can improve their reputation and electoral results in several ways (Strøm Reference Strøm1990). Opposition parties can try to influence voter perceptions of incumbent performance; Henrik Seeberg (Reference Seeberg2018), for instance, found evidence that social problems only influence voter approval in the UK when opposition parties criticize the government. Sergi Pardos-Prado and Iñaki Sagarzazu (Reference Pardos-Prado and Sagarzazu2016), in their turn, find that the discourse of the owner of an economic issue can influence voter perceptions of the economy, if it is in opposition. Opposition parties can counter biased or manipulated information spread by the government (Carlin et al. Reference Carlin, Hellwig, Love, Martínez-Gallardo and Singer2021) and during electoral campaigns try to shape the issue agenda in their favour (Hart Reference Hart2016; Vavreck Reference Vavreck2009). Finally, besides strategic party behaviour, opposition parties can also attract voters by presenting an ideological profile that appeals to voters – and both a ‘pushing force’ (i.e. an unpopular incumbent) and a ‘pulling force’ (i.e. an appealing alternative in the opposition) have been argued to be crucial for large-scale electoral change to occur (Maeda Reference Maeda2010: 422). Here, however, the focus is on individual voters' evaluations informing the vote in a way similar to the reward–punishment mechanism for incumbent parties. The studies discussed above have not been able to reveal which criteria voters use when evaluating performance in opposition. Until now, the proof seems to be in the pudding: opposition evaluations seem to matter but it is not clear what they are made of. Yet, it has been argued that voters take several factors into account.
The first factor under scrutiny is the actual influence of parties in opposition on enacted policies. Plescia and Kritzinger (Reference Plescia and Kritzinger2017) refer to federal systems and minority governments, where opposition parties might play an important role in policymaking. Stiers (Reference Stiers2019b) also makes this argument, referring to the fact that, in some situations, opposition parties' approval might be necessary to pass legislation. It has even been argued that a policy influence of opposition parties may blur the distinction between incumbency and opposition (Andeweg Reference Andeweg, Müller and Narud2013). These arguments have empirical bearing, as previous research found evidence for such policy influence by opposition parties. Notably, investigating the Danish case, Seeberg (Reference Seeberg2013) finds strong evidence that the left-wing government adopted restrictions to penal policy as a result of persistent right-wing opposition – results supported in a follow-up study (Seeberg Reference Seeberg2016). Hence, voter evaluations of the performance of opposition parties might be based on their actual influence on adopted policies – be it through supporting a minority government, or by politicizing certain issues, forcing the incumbent to act on them.
A second, somewhat more elusive, element that could be taken into account is the political role of ‘running in opposition’. It has been suggested that there are some key functions for running in opposition: ‘Most authors consider the functional profile of the parliamentary opposition in parliamentary democracies to include the three tasks of criticising the government, scrutinising and checking governmental actions and policies, and representing a credible “alternative government”’ (Helms Reference Helms2008: 9). Hence, when voters judge the performance of opposition parties, they could take into account the way in which these parties criticize the government or monitor incumbent parties' behaviour, without necessarily impacting their policies. Previous studies have indeed argued that voters ‘might simply take into consideration the obligations that parties are expected to fulfil in their role of opposition or government party’ (Plescia and Kritzinger Reference Plescia and Kritzinger2017: 158). Apart from the actual policy influence of the opposition, voters can hence also create their own idea of opposition parties' ‘own specific role of running in opposition’ (Stiers Reference Stiers2019a: 807).
Responsibility attribution for the opposition
One of the important additions to the literature on retrospective voting is that attribution of responsibility is an important moderator of the reward–punishment mechanism (Hobolt et al. Reference Hobolt, Tilley and Banducci2013). In their seminal study, G. Bingham Powell and Guy Whitten (Reference Powell and Whitten1993) argue that institutional rules blur political responsibility, making it more difficult to assign credit and blame to the appropriate actors. Studies indeed show that voters are more likely to vote in line with their retrospective performance evaluations when they attribute the responsibility for that performance to the actor they are evaluating (Peffley Reference Peffley1984; Shabad and Slomczynski Reference Shabad and Slomczynski2011).
This raises the question whether voters consider only incumbent parties to be responsible for the state of affairs in their country, or whether they think the opposition has a hand in it as well. Most straightforwardly, evidently, only incumbent parties control policymaking. However, as discussed above, opposition parties can influence the policy agenda as well (Seeberg Reference Seeberg2013, Reference Seeberg2016). If voters perceive this agenda-setting power of the opposition, it is possible that they hold those parties responsible for exercising it as well. Furthermore, if there is such a thing as ‘running in opposition’, opposition parties could also be evaluated for the extent to which they successfully take on their role as opposition party to shape the current state of affairs in the country. Therefore, I will also test to what extent voters hold opposition parties responsible for the state of affairs in their country.
Data and methods
To study opposition evaluations empirically, I use the data of the Comparative Study of Electoral Systems (CSES) Belgium survey, gathered after the elections of 26 May 2019 in Belgium, based on a random sample – drawn from the National Register. In total, 8,000 paper surveys were sent out; 4,000 to respondents living in the Dutch-speaking region of Flanders, and 4,000 to the French-speaking region of Wallonia.Footnote 1 Respondents were offered the option of returning the completed paper questionnaire in a prepaid envelope, or to answer the questionnaire online. One month after the first invitation, respondents received a second invitation to complete the questionnaire – again including a hard copy. In total, 1,087 Flemish and 733 Walloon respondents completed the questionnaire. The response rates are rather low, and it is therefore important to examine to what extent the data are representative for the population as a whole. Online Appendix G presents a comparison between known population statistics and the distributions in the data. Male and older respondents are somewhat over-represented, and sample respondents are, on average, higher educated than the population. Overall, however, the sample statistics closely mirror the population statistics.
The case under investigation is the Belgian election of 2019. Belgium is characterized by a strongly fragmented party system, with most parties split over the language border (Deschouwer Reference Deschouwer2012). This makes the Belgian setting a difficult test of retrospective voting as voters have a large number of parties to evaluate, but it also means that there is sufficient variation in (opposition) parties' approaches to be evaluated. With the federal structure of the country, there are often different coalitions at the different levels of government, making for a low clarity of responsibility in Belgium – although previous research has found evidence for retrospective voting occurring (Dassonneville et al. Reference Dassonneville, Claes and Lewis-Beck2016). Belgium can be characterized as a consociational democracy, with a fragmented system that leaves room for different kinds of cooperations (Lijphart Reference Lijphart1968). In terms of the relationship between coalition parties and opposition, this means that the ideological opposition does not necessarily lead to strong competition, but rather that there is cooperation among the elites (Andeweg et al. Reference Andeweg, De Winter and Müller2008). Still, opposition parties have ample opportunities to fulfil their role as opposition – at least when it comes to controlling the government. For instance, Belgium is characterized by strong and independent parliamentary committees, and individual Members of Parliament have the right to take the initiative to introduce bills and set the agenda of parliamentary debates (Andeweg et al. Reference Andeweg, De Winter and Müller2008). However, given the consociational system and its focus on consensual decision-making, opposition parties' opportunities to present a strong alternative to the incumbent government remain rather limited (Garritzmann Reference Garritzmann2017). This combination of a high level of control with a limited level of power to present a clear alternative results in an overall rather average power for Belgian opposition parties (Garritzmann Reference Garritzmann2017).
The 2019 election under investigation offers an especially good opportunity to investigate opposition evaluations, as it saw substantial vote swings along the lines of government and opposition, with all incumbent parties losing and all opposition parties gaining votes. Furthermore, the five-year term of the government was characterized by substantial tensions between government and opposition, as well as among the governing parties (see Pilet, Reference Pilet2020, for more details and background information about this election). In the empirical part of the study, the focus is on the national level. One noteworthy element is that the largest Flemish incumbent party, the nationalist New Flemish Alliance (N-VA), quit the government about six months before the election, over a dispute about the UN Marrakech Pact (see Pilet, Reference Pilet2020). Strictly speaking, this party was in opposition on election day. However, as it had been one of the major (numerically the largest) Flemish coalition partners during more than four years of government, and as it was clearly held responsible for the state of affairs in Belgium on election day (see below), it will be considered an incumbent party.
Measuring opposition evaluations
In measuring how voters evaluate the performance of opposition parties, I follow the approach of Matthew Singer (Reference Singer2011) by relying on open-ended questions. As there has been no research on the contents of voter evaluations of opposition performance, there is no predefined set of possible answers that can be used, and hence an exploratory design based on an open-ended question seems appropriate in order to gain first insights into the minds of voters. Even though questions have been raised about the extent to which respondents can understand and report their own cognitive processes accurately (Nisbett and Wilson Reference Nisbett and Wilson1977), Singer (Reference Singer2011) argues that answers to open-ended questions are a reliable measure of what voters think about. Furthermore, research on issue importance has shown that there is only a small difference between the answers to open-ended and closed questions (Fournier et al. Reference Fournier, Blais, Nadeau, Gidengil and Nevitte2003). Therefore, the main focus is on an open-ended question directly asking voters what they think about when evaluating the performance of opposition parties. In the questionnaire, in a question immediately preceding the open-ended question, respondents were first asked to evaluate the performance of every party that was represented in parliament during the last electoral cycle: ‘In general, how satisfied or dissatisfied are you with the performance of the following parties as governing parties or opposition parties in the Federal House of Representatives during the last term?’Footnote 2
Respondents could answer using a scale ranging from 0 (‘very dissatisfied’) through 2 (‘not dissatisfied, not satisfied) to 4 (‘very satisfied’). Importantly, as they were asked about the performance of every party in the House of Representatives, respondents from both language groups were asked to rate the performance of parties from the other language region as well. As the parties were listed following their official party list number for that election, incumbent and opposition parties were mixed. After judging the performance of each party, respondents were presented with the open-ended question which asked what they thought about specifically when they judged the parties that were in opposition. There were two lines available for them to write their response to the question, ‘When judging the political parties that were in opposition during the last term, which specific factors do you think about?’
Besides these questions evaluating parties, respondents were also asked about their attributions of responsibility. Opposition parties can arguably not be held accountable for their performance in ruling the country. Therefore, a more generic measure of the extent to which opposition parties are responsible for the country's performance was needed. Respondents were first asked how satisfied they were with ‘the current state of affairs in Belgium’ on a five-point scale ranging from very dissatisfied to very satisfied. Then they were asked how responsible they thought each party was for that current state of affairs: ‘How responsible are the following parties, according to you, for the current state of affairs in Belgium?’
Again, respondents were asked to rate every party that held seats in the House of Representatives, on a scale ranging from 0 (‘not at all responsible’), over 1 (‘rather not responsible’), 2 (‘a little responsible’) 3 (‘to a large extent responsible’), to 4 (‘fully responsible’).
Methods
The data analysis consists of the following steps. First, I report the answers to the open-ended question asking respondents which factors they take into account when evaluating the performance of the opposition. I hand-coded all responses in different categories which were established inductively, defining the categories while coding the different answers until all new answers found a good fit in one of the existing categories.Footnote 3 The unit of observation for this analysis is the factors mentioned by respondents.Footnote 4 Therefore, the figures below display the frequency with which factors are mentioned, and not proportions. Furthermore, respondents mentioned clear ‘positive’ and ‘negative’ factors.Footnote 5 Therefore, the discussion below is divided into positive and negative responses.
I then change the focus to explaining which respondents are positive about the opposition. I estimate logistic regression models with a dependent variable of whether the respondent was positive about the opposition (code 1) or negative (code 0). As explanatory variables, I include the standard sociodemographic characteristics – sex, age and educational level – and political interest as political variable. Online Appendix A lists all variables and how they are coded. As main variables of interest, I include satisfaction with democracy and the evaluation of government performance. Respondents who are more satisfied with the way in which democracy works might be more appreciative of political opposition. Conversely, the more satisfied one is with the government's performance, the more likely one is dissatisfied with the performance of the opposition, and vice versa. Finally, as respondents identifying with a party could be looking at the political world through a ‘perceptual screen’ (Campbell et al. Reference Campbell, Converse, Miller and Stokes1960), they can be expected to be more positive about the performance of their preferred party. Therefore, in a second model, I include an indicator of identification with an incumbent party as well.
In a second step, I test to what extent voters hold opposition parties responsible for the state of affairs in the country by looking at the average response for each party, distinguishing incumbent parties from opposition parties. Then, in line with the first step, I estimate models explaining responsibility attributions. To do so, I create a stacked data set in which all different parties the respondent evaluates are nested within voters, and the focus is on the party–voter dyad. As explanatory variables, I include whether or not the party was in government, the ideological distance to the party, the respondent's rating of the party leader, the respondent's satisfaction with the party's performance, and whether or not the voter identifies with the party (see Online Appendix A). As party–voter dyads are nested within unique voters, I estimate multilevel models with the dyads clustered in voters on the second level. Furthermore, to focus on differences between parties within voters, I eliminate between-voter variation by group-mean centring all continuous variables on the voter–party dyad level.
Results
Opposition evaluation
First, I investigate what voters consider when they evaluate the performance of parties in opposition. A first and important observation is that there was a very high number of missing answers to this question: 53.47% respondents did not answer the question. Adding the respondents who responded that they did not know, that they take into account ‘none’ factors, or give a nonsense response, 58.10% did not give a usable answer to the question. What could cause this high number of missing answers? First, the challenging question demands a sophisticated involvement in politics. There might also be a survey effect at play, as the question was included at the bottom of the page, and it is thus feasible that some respondents failed to see it. It is therefore possible that respondents did not see the question, did not know the answer, or did not bother responding. However, it is telling that the usual respondent characteristics correlate with non-response; the results in Online Appendix B suggest that voters who find it hard to explain their evaluations of opposition performance are also respondents who are more likely not to respond to more challenging questions in general. With this observation as a caveat, I turn to the answers respondents gave below. Each time the main factors are discussed here; a discussion of the smaller categories of responses is included in Online Appendix J.
Figure 1 provides an overview of how many times different positive factors were mentioned. The results show that voters mostly take the general competence of a party into account when they evaluate its performance in opposition. This refers to its competence in opposition: actions and decisions, such as keeping to promises, revealing scandals or issues with the current or planned policies of the government. Voters also appreciate the opposition's role of opposing the government: parliamentary questions, interpellations (and their quality), criticisms of the government, and pointing the government to their responsibilities. However, it is important that the opposition is constructive in their criticism. ‘Not opposing out of principle’ was mentioned several times, just like cooperation and making constructive and realistic proposals to improve the situation of the citizenry as a whole.
Positive Factors Used to Evaluate Performance in Opposition
Note: Figure shows the number of times the respective factors were mentioned by the respondents.

Besides positive factors, many voters also expressed negative criteria that were taken into account to evaluate performance in opposition (Figure 2). Mentioned often by respondents was a distaste for an overly critical opposition without presenting an alternative solution. Together with the fact that constructive opposition was one of the most important positive factors (Figure 1), these results show that a constructive approach to running in opposition is very important for people's evaluations of opposition performance. In line with this, voters dislike opposition parties that are only negative, mentioning parties that seem to be ‘always fighting’ or ‘criticizing just to criticize’. Furthermore, just as respondents attached much importance to overall competence, incompetence is mentioned often as a negative evaluation – including not being able to set the agenda, not doing what was promised and not putting sufficient pressure on the government.
Negative Factors Used to Evaluate Performance in Opposition
Note: Figure shows the number of times the respective factors were mentioned by the respondents.

Finally, there is a last category of ‘other’ responses that do not have an explicit positive or negative connotation (Figure 3), including factors that did not fit the previous categories and did not have a clear positive or negative tone – such as ‘information in the media’, ‘money’ or ‘how they seem left or right’. Furthermore, several respondents mentioned specific parties – often without any other comment – and social democratic parties were very much present in this regard.Footnote 6 However, the single most mentioned category by all respondents is that of specific issues. Indeed, many respondents answered with specific political issues (e.g. ‘climate’, ‘migration’, ‘economy’, etc.) – most often without any other kind of comment. The question ‘which factors do you [the respondent] think about?’ hence mostly elicits responses of which political issues these respondents thought about. What exactly they considered when making their evaluation of the different parties on those specific issues remains unclear for now.Footnote 7 These results can be taken to reflect two different kinds of evaluations. Whereas the question was intended to probe valence evaluations, these answers show that some voters interpreted it in terms of specific issue domains.
Other Factors Used to Evaluate Performance in Opposition
Note: Figure shows the number of times the respective factors were mentioned by the respondents.

Taken together, the results suggest that respondents find it hard to explain the reasons behind their evaluations. Those respondents who did articulate specific reasons, however, made clear and coherent arguments. People see opposing the government as one of the main roles of opposition parties and appreciate it when they take on this role appropriately. Appropriately in this case seems to mean mostly: (1) that they critically assess incumbent parties' decisions and behaviour to make sure it is in the interest of the general public, and (2) that they are not unnecessarily negative (‘opposition out of principle’), but that they think through, defend their own points of view and work constructively with the government to serve the common good. Combining these two roles – monitoring the incumbent and offering constructive criticism – gives opposition parties the highest reputation for competence, which is what voters care about most. Conversely, failing to influence the agenda, keep promises or put pressure on the incumbent leads to an evaluation of incompetence, which deters voters from supporting the opposition.
As a last test of opposition evaluations, I examine to what extent the evaluation factors depend on the preferences of the respondents by splitting the sample into voters who voted for an incumbent party, and voters supporting the opposition.Footnote 8 The results for these two groups respectively are shown in Figure 4.Footnote 9
Factors Used to Evaluate Performance in Opposition by Different Groups of Voters
Note: Figure shows the number of times the respective factors were mentioned by the respondents.

The results in Figure 4 show that opposition voters are more likely to mention positive factors than incumbent voters, and vice versa for negative factors. Both groups of voters care most about the general competence of the opposition. However, while opposition voters attach more importance to opposing the government and defending an alternative, these two factors are mentioned less by incumbent voters – even though both groups find a constructive opposition important. In terms of negative factors, incumbent voters are most annoyed when the opposition is not constructive, while this is only the fourth most prominent factor for opposition voters. However, they agree that opposition should not only focus on negativity.
After looking at the content of voter evaluations of the opposition, I move on to explaining positive and negative responses by estimating logistic regression models, using as dependent variable the distinction between the positive (coded 1) and negative (coded 0) factors made above. As no clear positive or negative connotation can be assigned to respondents mentioning specific issues without any context (i.e. ‘neutral’ comments), this group is excluded from the analysis. The results are summarized in Table 1.
Logistic Regression Models Explaining Positive Comments about the Opposition

Note: Entries are log-odds coefficients, standard errors in parentheses. Significance levels: * p < 0.05; ** p < 0.01; *** p < 0.001.
The results in Model 1 of Table 1 show that older respondents are less likely to give positive comments about the opposition. Furthermore, as expected, those who are more satisfied with the way in which democracy works in Belgium are more likely to be positive about the opposition. Finally, those who are more satisfied with the general performance of the incumbent government are more likely to be negative. In Model 2, party identification with an incumbent party is included, and this correlates strongly with giving negative comments about the opposition. While the association with government performance disappears, age and satisfaction with democracy remain significant predictors, and political interest is also associated with being more appreciative of the opposition.Footnote 10
Responsibility of the opposition
Second, I examine to what extent respondents hold opposition parties responsible for the current state of affairs in the country. As explained above, respondents were first asked how satisfied they were with the current state of affairs in Belgium, and then to what extent they thought each party was responsible for it. The mean responses by party are displayed in Figure 5.Footnote 11
Responsibility of the Different Parties for the ‘Current State of Affairs’
Note: Figure shows the mean score and 95% confidence intervals of responsibility for the current state of affairs assigned to every party, respectively. Parties Flanders (FL): Lib. [liberals] = Open VLD (Open Flemish-Liberal Democrats); Chri.-Dem. [Christian democrats] = CD&V (Christian-Democratic & Flemish); Nationalists = N-VA (New Flemish Alliance); Soc.-dem. [social democrats] = Vooruit (Forward); Greens = Groen (Green); Rad. Right [radical right] = Vlaams Belang (Flemish Interest). Parties Wallonia (WAL): Lib. [liberals] = MR (Reformist Movement); Soc. [socialists] = PS (Socialist Party); Chri.-Dem. [Christian democrats] = CDH (Humanist Democratic Centre); Greens = ECOLO (Confederate Ecologists for the Organization of Original Struggles). Parties Flanders + Wallonia (FLA + WAL): Rad. Left [radical left] = PVDA (Workers' Party of Belgium).

Incumbent parties are considered to be most responsible for the state of affairs in the country, with an average score of 2.538. Compared to the average score of 1.779 for opposition parties, this difference is statistically significant (t = −3.548; p = 0.005) and substantially large. The liberal party from the French-speaking part of the country – the party with the most cabinet positions – scores somewhat higher than the two Flemish parties that held fewer cabinet positions. The Flemish nationalist party is deemed most responsible. This was the largest Flemish party in government in terms of positions. However, as explained above, the party left the government six months before the elections over a dispute over the UN migration pact. Hence, while officially in opposition in the last months before election day, voters seem to either still hold them responsible for the years before as the largest Flemish coalition member, or hold them especially responsible for the political actions that led them to leave the coalition.
The opposition parties are sorted in descending order by number of seats in the national House of Representatives. Looking at the opposition parties, one observation stands out: the francophone socialist party is held responsible to the same extent as the two smaller Flemish incumbent parties. This can be due to the fact that this party led the coalition on the level of the francophone community – even though this was in coalition with the francophone Christian democratic party, which scores lower. Apart from this party, all opposition parties score significantly lower than the incumbent parties. The correlation between party size and responsibility attributions is 0.374. However, even though there is a significant difference, the difference with the incumbent parties is not very big. Hence, voters also hold opposition parties responsible for the state of affairs in the country at election time, at least to some extent.Footnote 12
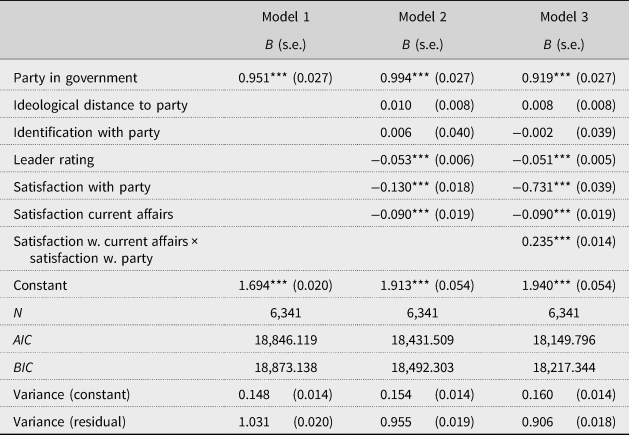
Second, I examine which respondent characteristics correlate with their responsibility attributions. The results are summarized in Table 2. In Model 1, I only include a dummy for party in government. In line with the results in Figure 5, the coefficient is significantly positive, indicating that incumbent parties receive an average score of almost one point higher on the 0–4 responsibility scale. The results of Model 2 show that the more respondents like the leader of a party, the less responsible they hold this party. Furthermore, people hold parties that they think performed well less responsible for the current states of affairs in the country. It is likely that this association depends on whether or not the respondent believes things are going well or badly in the country. Therefore, in Model 3, satisfaction with the party is interacted with the respondent's satisfaction with the current state of affairs in the country. The significantly positive interaction effect implies that the more positive one is about the current state of affairs in the country, the stronger and more positive the correlation between party satisfaction and responsibility attribution. To get a better view on the effects, the average marginal effects of satisfaction with a party at different levels of satisfaction with the current state of affairs are displayed in Figure 6.
Average Marginal Effect of Satisfaction with Party at Different Levels of Satisfaction with Current Affairs
Note: Figure shows average marginal effects and 95% confidence intervals of satisfaction with party at different levels of satisfaction with the current state of affairs. Based on Model 3 in Table 2.

Multilevel Models Explaining Responsibility Attributions

Note: Entries are OLS coefficients, standard errors in parentheses. Significance levels: * p < 0.05; ** p < 0.01; *** p < 0.001.
The results in Figure 6 show that when a respondent is dissatisfied with the way in which things are going in the country, the more satisfied they are with the performance of a party, the less they hold this party responsible for the current state of affairs. When someone is satisfied with how things are, the more satisfied they are with a party, the more they hold it responsible for the current state of affairs.
Discussion
Given the exploratory design of the study, there were no strong a priori expectations about the factors that are associated with positive stances and responsibility attribution for the opposition. The results presented above lead us to several conclusions. When it comes to the factors voters think about when evaluating performance in opposition, the theoretically important roles of opposition parties were argued to be scrutinizing and criticizing the government, and representing an alternative (Helms Reference Helms2008). The results show that voters' self-reported criteria match this list closely. The analyses explaining positive comments about opposition parties show that generally respondents who are satisfied with the way democracy works in the country and those who do not identify with an incumbent party are positive about the opposition. Satisfaction with democracy measures support for how the democratic regime works in practice (Linde and Ekman Reference Linde and Ekman2003: 405). People who are more satisfied with the democratic functioning of the country are more positive about the general working of the political processes, and this might make them more appreciative of the important role of a political opposition – a vital aspect of democracies (Dahl Reference Dahl1966). This finding is important in light of research showing that electoral winners show higher levels of satisfaction with democracy after elections than electoral losers (Anderson et al. Reference Anderson, Blais, Bowler, Donovan and Listhaug2005), as it can influence public sentiment during coalition talks between former incumbent and former opposition parties. The analyses also show that respondents identifying with an incumbent party are less likely to give positive comments about the opposition. This provides further evidence for partisanship working as a ‘perceptual screen’, influencing broader political attitudes and opinions (Campbell et al. Reference Campbell, Converse, Miller and Stokes1960). Note, however, that party evaluations might also be the source rather than consequence of party identification (Fiorina Reference Fiorina1981), which cannot be tested with the current data.
A second important finding is that the opposition is also held responsible for the state of affairs in the country, as the results presented here imply that in voters' minds the opposition also bears responsibility. Explaining responsibility attributions, people's general feelings towards a party seem to matter most. Some might take the strong association between these variables as a sign of endogeneity, as these measures are closely related and respondents might wish to seem consistent in their answers. On the other hand, the strong associations might also point to a very sophisticated electorate, with a clear knowledge of how they feel and who they think is responsible for what. Brad Gomez and J. Matthew Wilson (Reference Gomez and Wilson2001), for instance, argue that the target of voter evaluations depends on their levels of sophistication. With the current observational data it is not possible to delve deeper into the mechanisms behind the results. It is telling, however, that these results are obtained from a model controlling for party identification, and that there is no evidence for a significant direct association between party identification and responsibility attributions. Further research could take the initial results of this exploratory design as a starting point and expand the analysis and theoretical reach, using the results of these analyses as a priori expectations.
Conclusion
Recent studies have shown that retrospective voting works not only on the level of the government versus the opposition, but also on the level of political parties. However, while there has been ample attention given to the bases for incumbent evaluations, until now the argument on opposition evaluations remained speculative. This study set out to investigate what it is voters consider when they evaluate the performance of parties in opposition. The results show that voters want a competent opposition that works constructively for the common good, and is not solely negative. When it comes to explaining who is positive and who is negative about the opposition, unsurprisingly it seems to be mostly incumbent identifiers who are more likely to talk negatively about the opposition, and vice versa. Furthermore, the results show that even though opposition parties are held less responsible for the state of affairs in the country, overall the differences are not that great, and opposition parties also bear some responsibility in people's minds. On the individual level, these responsibility attributions depend mostly on the respondents' satisfaction with the current state of affairs, and their satisfaction with each party.
In interpreting the results, some caveats are in order. First, more than half of the respondents did not answer the question of what they thought about when evaluating the opposition. While this can have several reasons, it seems as if retrospective voting on the party level is a challenging mechanism.Footnote 13 Second, of those answering the question, many answered by giving a specific issue domain without context. While this might be an indication that these voters are focusing strongly on certain issues that are important to them, future research is necessary to examine how exactly these voters evaluate parties based on those issues.
Third, and importantly, replication of this research is necessary in other countries with other party systems. With the focus on Belgium, the results apply to a strongly fragmented multiparty system in a consociational democracy. However, previous studies have shown how the opposition has different opportunities and powers in different systems (Garritzmann Reference Garritzmann2017). It is hence likely that, in other systems, voters consider other characteristics of opposition parties to be important. For instance, in a two-party system, criticizing and monitoring the incumbent might be more important than being constructive – as the opposition offers a clear and direct alternative. Data availability limits the current study to the Belgian context, and future studies could examine whether the patterns hold in other political systems as well. Another fruitful avenue for future research would be to link the results of the two sets of analyses presented here. For instance, research might examine to what extent positive and negative factors are incorporated in the vote choice, depending on the responsibility attributed to the opposition – and whether this is more the case for positive responses than for negative, or vice versa. Furthermore, future studies could examine the moderating impact of responsibility attributions on voting behaviour for different types of voters, as well as the effects of positive versus negative evaluations on the vote.Footnote 14 This study provided an explanatory starting point for this type of research that future studies could explore more in depth.
Supplementary material
The supplementary material for this article can be found at https://doi.org/10.1017/gov.2021.63
Acknowledgements
I thank Matthew M. Singer for his help with the coding rules, Greet Louw for double coding and for proofreading, and all participants of the ‘Tuesday Seminar’ at the Université de Montréal for their constructive comments and suggestions. This research was funded by the Research Foundation Flanders (FWO).