Introduction
The McMurdo Dry Valleys (MDV), the largest extent of ice-free land on the Antarctic continent, are a landscape on the threshold of change (Levy Reference Levy2013). Model predictions show significant warming across the Antarctic continent by the end of the century, probably resulting in increased glacier melt and permafrost thaw (Steig et al. Reference Steig, Schneider, Rutherford, Mann, Comiso and Shindell2009). This increase in water availability has the potential to dramatically alter the soil ecosystem by changing spatial heterogeneity in soil geochemistry and habitat suitability for soil biota and by increasing rates of nutrient cycling and transport (Gooseff et al. Reference Gooseff, Barrett and Levy2013, Reference Gooseff, Wlostowski, McKnight and Jaros2017). Ephemeral meltwater streams and water tracks are important conduits of nutrients such as phosphorus (P), connecting the dry upland soils to lakes and the Southern Ocean (Levy et al. Reference Levy, Fountain, Gooseff, Welch and Lyons2011, Gooseff et al. Reference Gooseff, Barrett and Levy2013). With increasing landscape connectivity and higher weathering rates, soils may deliver increasing amounts of inorganic and organic P to the often P-limited aquatic environments (Priscu Reference Priscu1995, Gooseff et al. Reference Gooseff, Wlostowski, McKnight and Jaros2017). Nutrient transport from the rock and soil landscape into aquatic systems, however, depends on how increased water availability interacts with soil P cycling, a topic that remains poorly understood.
Competing hypotheses exist to explain the significant spatial variability in total soil P content and availability found throughout the MDV (Gudding Reference Gudding2003, Blecker 2006, Barrett et al. Reference Barrett, Virginia, Lyons, McKnight, Priscu, Doran, Fountain, Wall and Moorhead2007, Bate et al. Reference Bate, Barrett, Poage and Virginia2008). Gudding (Reference Gudding2003) proposed that soil P cycling in the MDV follows the Walker & Syers model of pedogenesis. In this model, landscape age is a critical control on P content and availability, with total P content decreasing as mineral P is transformed into occluded and organic P over time (Walker & Syers Reference Walker and Syers1976). As predicted by the model, Gudding (Reference Gudding2003) found that the younger soils of Taylor Valley’s Fryxell Basin had higher total P than the older soils of the nearby Bonney Basin.
However, the majority of evidence supporting the Walker & Syers model comes from temperate, humid and densely vegetated landscapes (Selmants & Hart Reference Selmants and Hart2010). Although similar patterns of soil P content and availability have been found in warm semiarid systems, limited water, energy and acidity can keep arid soils in the early stages of the Walker & Syers model even after three million years (Selmants & Hart Reference Selmants and Hart2010). In the extremely arid and cold climate of the MDV, Bate et al. (Reference Bate, Barrett, Poage and Virginia2008) found that unweathered calcium phosphate still dominated soils as old as eight million years, and concluded that parent material was more important than landscape age in controlling total P content. Parent material varies considerably throughout the MDV region; the Ross Sea drift in the Fryxell Basin contains P-rich basalts and kenytes, while the Bonney drift in the Bonney Basin is composed of local gneisses, granites and marbles, rocks with low concentrations of the P-bearing mineral apatite (Hall et al. Reference Hall, Denton and Hendy2000). Similarly, in other parts of the world, parent material has been shown to be persistent in determining soil P cycling, even in places with high rates of leaching (e.g. Mage & Porder Reference Mage and Porder2013).
In addition to the questions on what controls total P content in MDV soils, the relationship between total P content and what is available to organisms is also poorly understood. Part of this problem stems from the difficulty of measuring bioavailable P; chemically defined fractions extracted with current techniques do not necessarily correspond to biologically relevant soil P pools. In addition, the chemically defined labile pools of P (our best estimates of bioavailable P) are often poorly correlated with total P (e.g. Porder & Ramachandran Reference Porder and Ramachandran2013). Thus, even if parent material is important in determining total P content, other factors and their interactions may be more important for organisms and ecosystem functioning.
In the MDV, where the biological component of the soil P cycle is very small due to low productivity, labile forms of P may be more tightly correlated to total P than elsewhere (Bate et al. Reference Bate, Barrett, Poage and Virginia2008). On the other hand, factors other than parent material have been found to be important in determining P availability in MDV soils. Bate et al. (Reference Bate, Barrett, Poage and Virginia2008) proposed that the larger proportion of weathered P fractions in Fryxell Basin soils as compared to Bonney Basin soils may be due to greater water availability and clay content, which result in higher rates of weathering and increased sorption capacity. Similarly, Blecker et al. (Reference Blecker, Ippolito, Barrett, Wall, Virginia and Norvell2006) suggested that greater biological activity in the Fryxell Basin may contribute to the larger pools of weathered P found there. Finally, high spatial heterogeneity in soil chemistry, organic matter and moisture content at the metre, landform and landscape scales adds local complexity to understanding P availability (Burkins et al. Reference Burkins, Virginia and Wall2001, Barrett et al. Reference Barrett, Virginia, Wall, Parsons, Powers and Burkins2004).
Here surface soil samples collected throughout the MDV region were used to determine the controls on two major pools of soil P: i) HCl-extractable P (the majority of soil P, dominated by rock-derived calcium phosphates, available to organisms through mineral weathering) and ii) NaHCO3-extractable P (inorganic orthophosphate readily accessible to organisms). To test the hypothesis that parent material is the primary determinant of P content and availability in MDV soils, we extend the work of Bate et al. (Reference Bate, Barrett, Poage and Virginia2008) to include parent materials with higher abundances of P-rich volcanic rocks such as basalts and kenytes. Under this hypothesis we predict that soils where glacial drifts are almost entirely composed of these rocks will be richer in both pools of soil P compared to soils of the same approximate age with parent materials containing fewer P-rich volcanic rocks. To test the alternative hypothesis that landscape age is a more significant predictor of soil P content, soils of different ages but with the same parent material were compared. According to the Walker & Syers model, we predict that the younger soils will have higher concentrations of HCl-extractable P compared to the older soils. We also assess whether concentrations of NaHCO3-extractable P correlate with concentrations of HCl-extractable P and consider other factors, such as soil chemistry and texture, that may also control P availability. Finally, we test whether glacial landforms and topography are important factors in the spatial variability of soil P content and availability, a relatively unexplored topic.
Regional setting
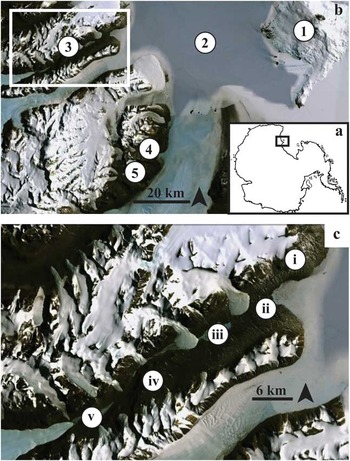
The MDV comprise the largest extent of ice-free land on the Antarctic continent (Levy Reference Levy2013; Fig. 1). While the glaciers, ephemeral streams, water tracks and perennially ice-covered lakes are critical parts of the MDV ecosystem, the landscape is dominated by dry soils underlain by dry-frozen and ice-cemented permafrost (Bockheim et al. Reference Bockheim, Campbell and McLeod2007). With a mean annual air temperature of c. -19°C and a mean annual water-equivalent precipitation of 3–50 mm yr-1, liquid water is highly limiting in the MDV ecosystem (Doran et al. Reference Doran, McKay, Clow, Dana, Fountain, Nylen and Lyons2002, Fountain et al. Reference Fountain, Nylen, Monaghan, Basagic and Bromwich2010). Soils in the MDV are high in salinity, high in pH and have some of the lowest carbon concentrations of soils in the world (Claridge & Campbell Reference Claridge and Campbell1977, Burkins et al. Reference Burkins, Virginia and Wall2001). Even with these extreme conditions, MDV soils support a simple ecosystem of nematodes, tardigrades, rotifers and microorganisms (Freckman & Virginia Reference Freckman and Virginia1997, Cary et al. Reference Cary, McDonald, Barrett and Cowan2010).
Map of study locations. a. Location of study area on the Antarctic continent. b. Location of places mentioned in text: Ross Island (1), McMurdo Sound (2), Taylor Valley (3; box shows location of c.), Garwood Valley (4) and Miers Valley (5). c. Inset of Taylor Valley showing sampling locations: Hjorth Hill (i), New Harbor (ii), Fryxell Basin (iii), upland ponds (iv), Bonney Basin (v).

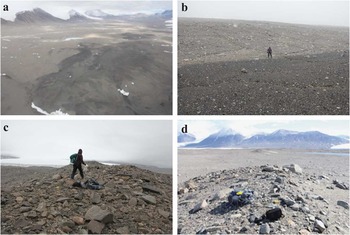
The glacial history of the region is critical to understanding the distribution of parent material throughout the MDV. During the Last Glacial Maximum (LGM; 26.5–19 kya), a grounded Ross Sea Ice Sheet (RSIS) flowing from the Ross Sea into the McMurdo Sound extended into the mouths of many dry valleys, including Taylor, Miers and Garwood valleys (Hall et al. Reference Hall, Denton and Hendy2000, Levy et al. Reference Levy, Fountain, O’Connor, Welch and Lyons2013). The influence of the grounded RSIS on soil development in these valleys is twofold. First, ice sheet flowlines that intersected with Ross Island brought basalt and kenyte erratics into the dry valleys. These volcanic rocks are very high in apatite, with kenyte containing more than three times as much P than any rock outcropping in Taylor Valley (Gudding Reference Gudding2003). In many places, a visibly distinct contact between the dark Ross Sea drift and the lighter local lithologies is evident (Fig. 2). Although the Cenozoic McMurdo Volcanic Group does outcrop in western Taylor Valley, the basaltic cones are infrequently scattered among basement rocks and glacial drift (Wilch et al. Reference Wilch, Lux, Denton and McIntosh1993). Second, the grounded RSIS dammed pro-glacial lakes in Miers, Garwood and Taylor valleys, leading to the deposition of glaciofluvial sediments and landforms. The depositional histories of these lakes, especially glacial Lake Washburn in Taylor Valley, played important roles in the distribution of organic carbon and other nutrients throughout the valleys (Burkins et al. Reference Burkins, Virginia and Wall2001). Determining the exact extent of glacial Lake Washburn remains an active area of research, with studies proposing palaeolake levels from 120 m a.s.l. (Toner et al. Reference Toner, Sletten and Prentice2013) to 336 m a.s.l. (Hall et al. Reference Hall, Denton and Hendy2000).
Photographs of lake-conveyor deposits in Taylor Valley. a. Longitudinal ridge, as seen from the air. b. Distinct boundary of parent materials between the longitudinal ridge (dark) and the underlying drift (light). c. Cross-valley ridge. d. Mound.

Regardless of the exact extent of glacial Lake Washburn, many landforms on the floor of eastern Taylor Valley have been associated with the glacial lake. These mounds, moat lines, cross ridges and longitudinal ridges, all roughly 1–3 m in relief, are referred to as lake-conveyor deposits, and were deposited through open-water moats and on top of lake ice (Hall et al. Reference Hall, Denton and Hendy2000, Hendy et al. Reference Hendy, Sadler, Denton and Hall2000). The perennial ice covering the pro-glacial lakes provided a transport system that brought Ross Sea drift westward into Taylor Valley (Hall et al. Reference Hall, Denton and Hendy2000, Hendy et al. Reference Hendy, Sadler, Denton and Hall2000). Although deposited by similar mechanisms and mapped consistently as Ross Sea drift, the lake-conveyor deposits in Taylor Valley display a range of drift compositions. The mounds, moat lines and cross ridges contain an assemblage of lithologies similar to the underlying drift, with infrequent kenyte erratics. The longitudinal ridges, however, contain a high abundance of basalt and kenyte, and are visually distinct from the underlying drift due to their dark colour (Fig. 2). The glacial mechanisms responsible for this lithological distinction are not mentioned in published descriptions of lake-conveyor deposits (Hall et al. Reference Hall, Denton and Hendy2000, Hendy et al. Reference Hendy, Sadler, Denton and Hall2000).
While the history of the grounded RSIS during the LGM is important for most of our sampling locations, Taylor Valley’s Bonney Basin and the soils around the Marr and Parera pond systems are exceptions. In the Bonney Basin, soils are developing on Bonney drift, deposited by an advance of the Taylor Glacier 70 000–130 000 years ago (Higgins et al. Reference Higgins, Hendy and Denton2000). Soils around the upland Marr and Parera pond systems (here referred to as the ‘upland ponds’) have been estimated to be 1.5–2.55 million years in age, based on radiometric dating of in situ cinder-cone deposits, and are the oldest surfaces in Taylor Valley (Wilch et al. Reference Wilch, Lux, Denton and McIntosh1993, Marchant & Denton Reference Marchant and Denton1996). The glacial drift around the higher elevation Marr pond system (750 m) is from an advance of the Marr Glacier, while the drift around the lower elevation Parera pond system (350 m) has been mapped as pre-LGM Ross Sea drift (Wilch et al. Reference Wilch, Lux, Denton and McIntosh1993, Marchant & Denton Reference Marchant and Denton1996). Both glacial drifts found around the upland ponds have a low abundance of P-rich volcanic rocks and are located above the influence of palaeolakes.
Methods
Field methods
During the 2013–16 summers, a total of 146 dry surface soil samples were collected from Hjorth Hill (n=15), and Taylor (n=97), Miers (n=18) and Garwood (n=16) valleys. Within Taylor Valley, soil samples were collected from New Harbor (n=13), the Fryxell Basin (n=72), the Bonney Basin (n=8) and from dry soils adjacent to the upland ponds (n=4) (Fig. 1). Within the Fryxell Basin, samples were collected along a transect extending from the valley floor up the southern valley wall to an elevation of 400 m a.s.l. In addition, samples were collected from the top of and adjacent to multiple lake-conveyor deposits: mounds, cross ridges and a longitudinal ridge. At each sampling location, the top 10 cm of soil was collected into a sterile Whirl-pak and the sample was kept cool until frozen at -20°C at the Crary Laboratory in McMurdo. Samples were shipped frozen to Dartmouth College, Hanover, NH, USA, for laboratory analysis. Freezing has been shown to have a minimal impact on soil P fractions, especially in soils with low organic matter (Xu et al. Reference Xu, Sun, Xu, Lv, Shao, Yan, Zhang and Blackwell2011).
Parent material was assessed using three methods. In the field, on a regional scale, the percentage of dark volcanic rocks covering the ground surface was assessed visually. The Ross Sea drift deposited in Miers and Garwood valleys has a nearly 100% surface coverage of basalts and kenytes, much higher than the Ross Sea drift in Taylor Valley and on Hjorth Hill. During the 2015 field season, local soil colour was recorded using a Munsell soil-colour chart prior to collecting each sample (n=96). Because many soil surfaces were covered in a coarse lag deposit, the colour of the fine-grained soil directly beneath the surface was recorded. Finally, WorldView-II imagery, acquired through the Polar Geospatial Center, was used to map sampling locations. From the satellite imagery, the volcanic-rich drift in Miers Valley, Garwood Valley and regions of Taylor Valley is easily distinguished from the underlying drift and bedrock.
Laboratory methods
To measure inorganic orthophosphate, a sodium bicarbonate (NaHCO3) extraction was used at pH 8.5 (Olsen Reference Olsen1954, Pansu & Gautheyrou Reference Pansu and Gautheyrou2006). This method targets labile P, typically in the form of inorganic orthophosphates (Coventry et al. Reference Coventry, Halliwell and Nash2001), and can be used for alkaline soils. Following extraction of 8 g of dried and sieved (<2 mm) soil in 40 ml of 0.5 M NaHCO3 for 1 h, samples were centrifuged and the supernatant fraction was collected. After acidifying the supernatant with 6 N HCl to pH 2–4, the extractable labile P was measured colorimetrically on a Lachat QuikChem 8500 flow-injection auto analyser (Lachat Instruments, Hach Company, Loveland, CO). This fraction is referred to as NaHCO3-extractable P and considered to contain P that is available to organisms on daily to seasonal timescales.
To measure P available to organisms over the longer timescales of mineral weathering, a hydrochloric (HCl) acid extraction was used followed by a persulfate digestion (Liao & Marten Reference Liao and Marten1999). This method targets all forms of organic and inorganic labile P as well as calcium-bound P, usually in the form of apatite. Following extraction of 0.3 g of dried, sieved (<2 mm) and ground soil in 30 ml of 1 N HCl for 18 h, the samples were centrifuged and the supernatant fraction collected. To convert all polyphosphates and organic phosphorus into orthophosphate, the supernatant was digested using ammonium persulfate at 121°C and 15–20 psi for 30 min. After adjusting each digest to a pH of 2–4 using 5.75 M NaOH, the digested samples were measured colorimetrically on a Lachat QuikChem 8500 flow-injection auto analyser. This fraction is referred to as HCl-extractable P.
The pH and electrical conductivity (EC) of sieved (<2 mm) soil samples were measured in 1:2 and 1:5 soil:deionized water slurries, respectively. For a subset of 32 samples from Taylor Valley, grain size was measured using the hydrometer method (Gee & Bauder Reference Gee and Bauder1979).
Data analysis
To test the parent material hypothesis, both P pools were compared with our assessments of volcanic rock abundance. At the regional scale, differences in P pools were tested by location using a one-way analysis of variance (ANOVA). In this case, location was a proxy for parent material, because the glacial drift in Miers and Garwood valleys have much higher abundances of volcanic rocks than the glacial drift in Taylor Valley and Hjorth Hill. To eliminate the variable of landscape age, only soils mapped as Ross Sea drift deposited by the RSIS during the LGM were included (Hall et al. Reference Hall, Denton and Hendy2000). At the local scale, differences in P pools by soil colour were tested using field estimates and WorldView-II satellite imagery.
To test the landscape age hypothesis, two soils of the same parent material but different landscape ages were compared using a t-test. In this analysis, two ages of Ross Sea drift deposited at Hjorth Hill were compared: a region of pre-LGM Ross Sea drift and the adjacent LGM Ross Sea drift (Hall et al. Reference Hall, Denton and Hendy2000). In addition, LGM-aged Fryxell Basin soils were compared with soils from two older surfaces in Taylor Valley, the Bonney Basin and the upland ponds. For this ANOVA analysis, parent material as well as landscape age differs among sites.
All 146 samples from across the MDV were used to consider the relationships between extractable and NaHCO3-extractable P, and between soil chemistry, texture and NaHCO3-extractable P. An analysis of covariance (ANCOVA) was run with NaHCO3-extractable P as the response variable and HCl-extractable P, location, pH and EC (log10-tranformed) as explanatory variables. If NaHCO3-extractable P was correlated to HCl-extractable P, HCl-extractable P would be expected to explain a significant proportion of the variability in NaHCO3-extractable P. For a subset of samples, a similar ANCOVA was run that included grain size as an explanatory variable.
Finally, the influence of glacial landforms and topography on P availability was considered. First, one-way ANOVAs were run comparing NaHCO3-extractable P and HCl-extractable P in soils from the top of and adjacent to three different lake-conveyor deposits (mounds, cross ridges and a longitudinal ridge) in the Fryxell Basin. Second, the relationships between both pools of soil P and topography, specifically elevation and slope, were explored. Slope was calculated using an ASTER digital elevation model (DEM) acquired through the USGS Earth Explorer. The ASTER DEM was chosen for this analysis because it covers the entire study region, as opposed to more recent data (the 2001 USGS LiDAR dataset) that covers only portions of our study region.
Results
Soil chemistry
HCl-extractable P results varied fourfold, ranging from 0.40±0.09 g kg-1 dry soil (mean ± standard deviation) in the Bonney Basin to 1.70±0.19 g kg-1 dry soil in Miers Valley (Table I, Table SI found at http://dx.doi.org/10.1017/S0954102016000742). NaHCO3-extractable P concentrations were highly variable, with the lowest value in the Bonney Basin (0.19 mg kg-1 dry soil) and the highest concentration in the Fryxell Basin (31.85 mg kg-1 dry soil). Soils were uniformly basic, with soils from the Bonney Basin and the upland ponds closest to a neutral pH (Table I). Electrical conductivity was also extremely variable at all locations, with individual values ranging from 13 μS cm-1 to 7310 μS cm-1 (Table I). Within Taylor Valley, EC increased in both mean value and variability with increasing landscape age and distance from the coast, with the highest mean values in the Bonney Basin and adjacent to the upland ponds (Table I). Percent clay was similar for the two basins in Taylor Valley, although the Fryxell Basin had a slightly higher average clay content compared to soils in the Bonney Basin (Table I).
Soil chemistry and texture results for all study locations, with Taylor Valley divided into four regions. Results are reported as mean±standard deviation.

Parent material
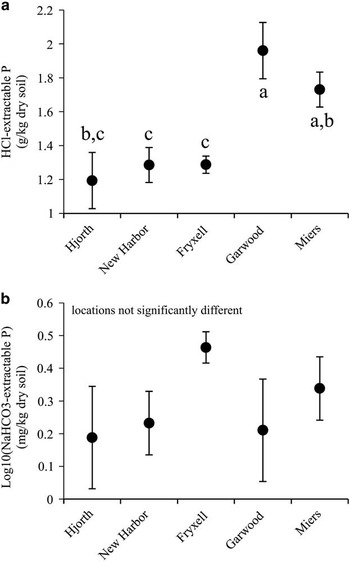
At the regional scale, parent material is an important factor in predicting HCl-extractable P. The ANOVA comparing HCl-extractable P in LGM-aged Ross Sea drift from Miers and Garwood valleys, New Harbor, the Fryxell Basin and Hjorth Hill was significant (P<0.0001), with the highest levels in Garwood and Miers valleys. In contrast, the ANOVA comparing NaHCO3-extractable P for the same samples was not significant (Fig. 3).
Results of ANOVA testing for differences in Ross Sea drift by location, ordered north to south. a. HCl-extractable P was significantly different by location, with Miers and Garwood valleys having the highest values. Lowercase letters denote significance using a Tukey HSD test. b. Log-transformed NaHCO3-extractable P was not significantly different by location.

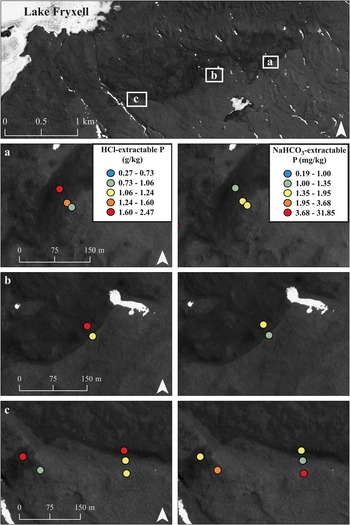
Locally, soil colour, both qualitatively from WorldView-II satellite imagery and from field assessment using the Munsell soil-colour chart, is a strong predictor of HCl-extractable P across the MDV region. This finding was especially evident on the floor of the Fryxell Basin, where there are distinct boundaries between dark volcanic-rich drift and underlying lighter drift, even though the entire valley floor has been mapped as LGM Ross Sea drift (Fig. 4). NaHCO3-extractable P showed no relationship with soil colour (Fig. 4).
Examples from the Fryxell Basin showing how soil colour relates to HCl-extractable P and NaHCO3-extractable P. Top panel shows locations of a., b. and c., three examples of the distinct boundary between dark volcanic-rich drift and the underlying lighter drift. Sample colour shows the concentration of HCl-extractable and NaHCO3-extractable P. To best illustrate the variation in P concentrations, the breaks in the colour scale were determined by binning samples into five equal groups (quartile method).

For all 96 samples collected in 2015, soil colour fell into three hues: 2.5Y, 5Y and GLEY1. Soils developing on glacial drifts with limited volcanic rocks fell almost entirely into the 2.5Y hue (93% of samples), with colours ranging from very dark greyish brown (2.5Y 3/2) to pale brown (2.5Y 7/3). Soils developing on glacial drifts with a high abundance of basalts and kenytes mostly fell into the 5Y and GLEY1 hues (73% of samples), with colours ranging from dark grey (5Y 4/1 and GLEY1 5 N) to light grey (5Y 7/2 and GLEY 7 N). HCl-extractable P varied significantly by soil colour, with GLEY1 and 5Y soils having significantly higher HCl-extractable P (GLEY1: 1.97±0.58 g kg-1 dry soil, 5Y: 1.65±0.35 g kg-1 dry soil) than 2.5Y soils (2.5Y: 1.11±0.42 g kg-1 dry soil; P<0.02). NaHCO3-extractable P did not vary by soil colour.
Landscape age
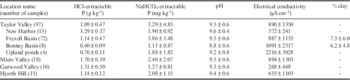
Concentrations of both HCl-extractable P and NaHCO3-extractable P were very similar in the pre-LGM Ross Sea drift and the LGM Ross Sea drift found in close proximity on Hjorth Hill (Table II). Neither t-test (HCl-extractable P and NaHCO3-extractable P) comparing soils of different ages but with the same parent material was significant (HCl-extractable: P=0.29, NaHCO3-extractable: P=0.82).
Soil phosphorus results for the two ages of Hjorth Hill Ross Sea drift, as well as four locations in Taylor Valley with a wide range of landscape ages. For the Taylor Valley locations, superscript letters denote significance using a Tukey HSD test. Results are reported as mean ± standard deviation.

The upland ponds and the Bonney Basin had the lowest HCl-extractable P in Taylor Valley, with the Bonney Basin significantly lower than New Harbor and the Fryxell Basin (Table II). The same pattern was true for NaHCO3-extractable P, but in this case the Bonney Basin was significantly lower than only the Fryxell Basin (Table II). For both P pools, the Bonney Basin and the upland ponds were not significantly different from each other, even though they are markedly different in age.
HCl- and NaHCO3-extractable phosphorus
Results from all 146 soil samples suggest that NaHCO3-extractable P is not related to HCl-extractable P. Although the overall ANCOVA (with HCl-extractable P, location, pH and EC as explanatory variables) was significant (P<0.0001) with an R 2 of 0.50, HCl-extractable P did not explain any significant variability in NaHCO3-extractable P. Instead, EC was the most significant effect (P<0.0001), explaining 39% of the total variance, with a positive relationship between EC and NaHCO3-extractable P. Location was also a significant effect (P=0.01), explaining 10% of the total variance. However, mean values of NaHCO3-extractable P were not significantly different between locations using a Tukey HSD test.
To further explore the effect of EC on NaHCO3-extractable P, additional analyses were run with the subset of 32 samples analysed for grain size. Although MDV soils typically have a low clay content, even a small amount of clay can alter the EC of soils. Initially, an ANCOVA was run with percent clay, EC, location and all two-way interactions as model effects. Since none of the interactions were significant, the model was rerun with only the main effects. Overall, the ANCOVA was significant (P<0.0001) with an R 2 of 0.72. Percent clay was the most significant effect (P<0.0001), explaining 45% of the total variance, with a positive relationship between percent clay and NaHCO3-extractable P. Location was also significant (P<0.0005) and explained 27% of the total variance. From this subsequent analysis, EC was found not to be a significant predictor of NaHCO3-extractable P. Including grain size in the analysis revealed that percent clay is a much stronger predictor of NaHCO3-extractable P than EC.
Glacial landforms and topography
The one-way ANOVA comparing HCl-extractable P in samples taken from the tops of mounds, cross-valley ridges, a longitudinal ridge and from the valley floor in the Fryxell Basin was significant (P=0.003). A Tukey HSD test showed that this result was driven by higher levels of HCl-extractable P on the longitudinal ridge (1.91±0.41 g kg-1 dry soil), which was significantly different from soils on the mounds (1.31±0.40 g kg-1 dry soil) and the valley floor (1.21±0.26 g kg-1 dry soil). The longitudinal ridge is readily apparent on the landscape due to its dark colour, indicating a high abundance of volcanics, while the mounds and cross-valley ridges are the same colour as the underlying drift. Indeed, for the same set of samples, nearly the same amount of variance explained by landform type can be explained by soil colour, with darker soils (5Y) having higher HCl-extractable P than lighter soils (2.5Y). In contrast, the one-way ANOVA comparing NaHCO3-extractable P for the same samples was not significant.
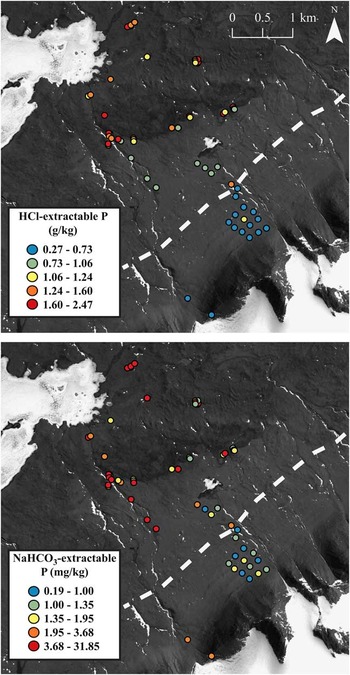
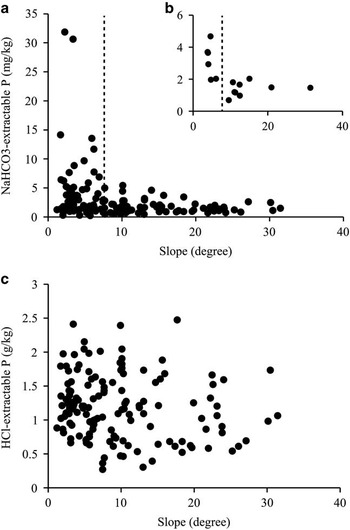
Our results suggest that elevation and slope are also important factors in predicting NaHCO3-extractable P. On the southern valley wall of the Fryxell Basin, samples collected above ~120 m a.s.l. were uniformly low in both HCl-extractable and NaHCO3-extractable P (Fig. 5). This elevation corresponds to where the valley wall begins to slope more steeply. When all 146 samples were plotted against slope, a distinct threshold was found at ~8° for NaHCO3-extractable P, with P levels uniformly low on steeper slopes (Fig. 6). While this pattern was most distinct in the Fryxell Basin, the same pattern was clear in Miers Valley and on Hjorth Hill. No similar threshold existed for HCl-extractable P when all samples were included (Fig. 6).
HCl-extractable P and NaHCO3-extractable P results for the Fryxell Basin in Taylor Valley. Sample colour shows the concentration of HCl-extractable and NaHCO3-extractable P. To best illustrate the variation in P concentrations, the breaks in the colour scale were determined by binning samples into five equal groups (quartile method). Dashed white line shows the approximate location of the 120 m a.s.l. contour.

P results across hillslopes. a. NaHCO3-extractable P across the range of hillslopes for all 146 samples, with a dashed line showing the ~8° threshold. b. NaHCO3-extractable P for Hjorth Hill samples, showing a similar threshold. c. HCl-extractable P across the range of hillslopes for all 146 samples, showing no threshold.

Discussion
Parent material and landscape age
In the MDV, parent material is the strongest predictor of HCl-extractable P. At the regional scale, the valleys with the highest surface coverage of basalts and kenytes (Miers and Garwood valleys) had the highest HCl-extractable P. Within valleys, areas of dark soil (high surface coverage of volcanic rocks) had significantly higher levels of HCl-extractable P than lighter soils (low surface coverage of volcanic rocks) just a few metres away. In some cases, such as Garwood Valley, soil colour boundaries also correspond to boundaries in landscape age (Levy et al. In press). However, the importance of soil colour in predicting HCl-extractable P is robust even when restricted to soils within the Fryxell Basin forming on LGM Ross Sea drift. Although parent material is often equated to till type, our results suggest that this is an insufficient representation of the parent material variability within the MDV. Significant lithological differences exist within Ross Sea drift both regionally (among valleys) and locally (among landforms). These lithological differences have direct consequences for the cycling of soil P and potentially for the cycling of other elements as well. Future study should consider the glacial and depositional mechanisms that resulted in the lithological differentiation within the Ross Sea drift, as well as the consequences for soil nutrient cycling and soil biodiversity.
In contrast, our results provided no support for the hypothesis that landscape age is a strong predictor of soil P content and availability in the MDV. Our analysis of the Ross Sea drift at Hjorth Hill is the first MDV study, to our knowledge, that compares P concentrations in soils of different landscape ages with the same parent material. Previous studies have compared soils that differ in both landscape age and parent material, making it difficult to separate the two variables (Blecker et al. Reference Blecker, Ippolito, Barrett, Wall, Virginia and Norvell2006, Bate et al. Reference Bate, Barrett, Poage and Virginia2008). In our study, no difference in P concentrations were found between adjacent soils of differing ages on Hjorth Hill, suggesting that the role of landscape age in P cycling in the MDV is minor. Further, from our analyses of soils differing in both age and parent material, no decrease in HCl-extractable P in soils from the older surfaces of the Bonney Basin and the upland ponds was found, although we acknowledge that our sample sizes were small. This finding was especially apparent for the upland pond samples, which had similar concentrations of HCl-extractable P as the Bonney Basin even though the soils are much older.
This evidence, in addition to previous work by Bate et al. (Reference Bate, Barrett, Poage and Virginia2008), suggests that MDV soils are confined to the earliest stage of the Walker & Syers model, where soil P is still dominated by unweathered apatite. Bate et al. (Reference Bate, Barrett, Poage and Virginia2008) found that even after eight million years of soil development in Beacon Valley, there was little evidence of any appreciable loss in total soil P, since apatite P values there were equivalent to those in the much younger Bonney Basin. In the earliest stages of the Walker & Syers model, parent material drives total P content, since parent material is the primary source of unweathered soil apatite. In other arid environments, reduced inputs of water, energy and acidity have been shown to slow the rate of soil P transformation (Selmants & Hart Reference Selmants and Hart2010). As the coldest and most arid ecosystem on Earth, the MDV is at the extreme end of this climate gradient, with negligible rates of apatite weathering, at least in the dry upland soils.
We must note, however, that a straightforward approach to defining soil age may not be sufficient in the MDV. Sediments in Beacon Valley, for example, may have been deposited eight million years ago, but the actual duration of pedogenesis is restricted to times when soils are thawed and in contact with liquid water. In the younger Fryxell Basin, where higher proportions of weathered P fractions have been found (Bate et al. Reference Bate, Barrett, Poage and Virginia2008), the greater availability of liquid water combined with warmer temperatures may be enough to push soils farther along the Walker & Syers trajectory than the older Beacon Valley soils.
In addition to parent material, aeolian deposition is a source of unweathered apatite and is unaccounted for in the Walker & Syers model. Both Gudding (Reference Gudding2003) and Bate et al. (Reference Bate, Barrett, Poage and Virginia2008) minimize the importance of aeolian inputs, arguing that there is less aeolian sediment transport in the MDV than in other arid regions (Lancaster Reference Lancaster2002). More recent work has found much higher rates of aeolian flux, but at lower transport heights and confined to brief episodes of intense down valley föhn winds (Sabacká et al. Reference Sabacká, Priscu, Basagic, Fountain, Wall, Virginia and Greenwood2012). Sabacká et al. (Reference Sabacká, Priscu, Basagic, Fountain, Wall, Virginia and Greenwood2012) only report very low levels of particulate organic P from aeolian sediment traps, but do not report total P. Winds probably transport unweathered apatite within the MDV system, but this is a mechanism for local redistribution rather than an outside source of soil P. Due to the directionality of aeolian transport down valley from the Bonney Basin to the Fryxell Basin (Sabacká et al. Reference Sabacká, Priscu, Basagic, Fountain, Wall, Virginia and Greenwood2012), aeolian deposition is not sufficient to explain the higher total P content of Fryxell Basin soils. Still, the redistribution of unweathered apatite within the MDV system may be an important component of the high spatial variation in soil P cycling and warrants future study.
NaHCO3-extractable phosphorus
Although Bate et al. (Reference Bate, Barrett, Poage and Virginia2008) suggested that there might be a strong correlation between total and labile P in the MDV due to limited biological P cycling, our findings do not support this hypothesis. While parent material is a strong predictor of HCl-extractable P, there was no relationship between parent material and NaHCO3-extractable P. Instead, our results point to soil chemistry, soil texture and topography as important predictors of NaHCO3-extractable P.
Although our initial analysis identified EC as the strongest predictor of NaHCO3-extractable P, clay content was found to better explain this correlation. Samples with high EC values also had high clay content. Clay-sized particles, with their high surface area and sorption capacity, can retain NaHCO3-extractable P and other soluble salts. In the MDV, the distribution of clay-sized particles may be the result of multiple processes. First, parent material may be important in determining soil grain size, since the volcanic erratics common in Miers and Garwood valleys and the Fryxell Basin have a smaller grain size than the granites, gneisses and metasedimentary rocks that outcrop locally throughout the MDV. Second, glacial and glaciolacustrine processes are probably important. Warm-based glaciers, such as the RSIS, would probably have deposited much finer sediments than cold-based alpine glaciers, and glaciolacustrine sediments are probably finer and more sorted than glacially deposited sediments. Finally, aeolian and hydrologic transport of sediments could preferentially redistribute fine grains, leaving behind a coarse lag deposit in some locations and accumulating fine grains elsewhere. The relative importance of these processes in determining soil grain size as well as the spatial distribution of soil texture throughout the MDV remain areas for future study.
Topography also plays a role in the availability of P in MDV soils. On slopes above ~8°, regardless of drift type or landscape age, NaHCO3-extractable P is consistently low. All samples with elevated levels of NaHCO3-extractable P were located along the valley floors where the ground surface is relatively flat or rolling. Slope may impact NaHCO3-extractable P for several reasons. First, grain size may be coarser on the steep valley walls than along the valley floors due to the lack of glaciolacustrine sediments and the down-slope movement of fine particles. Coarse soils are less able to retain NaHCO3-extractable P. In this study, the subset of samples with grain size results were restricted to the valley floor; consequently, it was not possible to address this hypothesis. Second, water movement, while limited, may be greater on steeper slopes, limiting soil residence time and transporting any NaHCO3-extractable P toward the valley floor.
In the Fryxell Basin, the legacy of glacial Lake Washburn may interact with hillslope to explain the spatial variability of NaHCO3-extractable P. The elevation of 120 m a.s.l., above which NaHCO3-extractable P concentrations are consistently low, corresponds not only to an increase in hillslope, but also to one of the proposed palaeolake levels (Toner et al. Reference Toner, Sletten and Prentice2013). Below this threshold, soils have higher soluble salt concentrations (Toner et al. Reference Toner, Sletten and Prentice2013) and are forming on relatively flat lacustrine sediments. Above this threshold, soils are forming on steep slopes, potentially above the influence of glacial Lake Washburn. A similar threshold was not found for NaHCO3-extractable P concentrations at the higher proposed palaeolake level of 336 m a.s.l. (Hall et al. Reference Hall, Denton and Hendy2000).
A landscape on the threshold of change
Although the apatite P that dominates MDV soils is not currently available to organisms, this pool could become biologically available through mineral weathering as liquid water availability increases. Mineral weathering is largely confined to moist habitats such as the hyporheic zone, along water tracks, and at the wetted margins of lakes and ponds (Gooseff et al. Reference Gooseff, McKnight, Lyons and Blum2002). In the hyporheic zone, rates of silicate mineral weathering are comparable to temperate watersheds due to the continual saturation of weathering minerals and the rapid exchange of dilute water (Gooseff et al. Reference Gooseff, McKnight, Lyons and Blum2002). As the spatial extent of liquid water increases from glacier melt and permafrost thaw, more apatite P could become mobilized. Increased apatite dissolution would not only increase the availability of P in soils, but could also increase nutrient loads entering aquatic ecosystems. This increased P flux may be greatest in areas such as Miers and Garwood valleys with volcanic-rich glacial drifts. Climate change may thus increase the rate at which MDV soils progress along the Walker & Syers trajectory.
The distribution of NaHCO3-extractable P in the MDV may also change as a result of global warming due to the hydrological redistribution of fine particles with permafrost thaw. While these clay-rich areas may retain labile P, they are not always suitable habitats for soil organisms; soils with high clay content often have higher EC and lower nematode abundances and living-to-dead ratios (Smith et al. Reference Smith, Wall, Hogg, Adams, Nielsen and Virginia2012). Increased water availability may alter soil texture and thus P retention and transport, but the impact on soil ecology is not straightforward.
Conclusions
In the dry soils of the MDV, P cycling remains in the very early stages of the Walker & Syers model, with limited loss of total soil P and very low rates of apatite weathering. HCl-extractable P was strongly predicted by parent material, but was not related to landscape age for our limited number of sites. In the MDV, the distribution of parent material has been determined by glacial history and geology, with a grounded RSIS depositing P-rich basalt and kenyte erratics unevenly during the LGM. Although till type is often used as a proxy for parent material, we found that this is an insufficient description of parent material variability in the MDV. Although parent material is a strong predictor of HCl-extractable P, there was no relationship between parent material and NaHCO3-extractable P. Instead, NaHCO3-extractable P was correlated with hillslope and soil texture, with clay-rich soils along the valley floor having higher concentrations of NaHCO3-extractable P. On longer timescales, as liquid water availability increases from projected warming, parent material weathering may increase the release of HCl-extractable P to the ecosystem. On shorter timescales, increased water movement across the MDV landscape may change the distribution of NaHCO3-extractable P through the redistribution of fine particles. In the future, we expect an increase in P loading to aquatic ecosystems in areas dominated by volcanic parent materials, although clay-rich soils may retain labile P and reduce nutrient transport.
Acknowledgements
We thank the entire MDV LTER soils teams from 2013–16 for field assistance and support. Thanks to Kevin Geyer, Eric Sokol and Jessica Trout-Haney for assistance collecting samples. Many thanks to the pilots of PHI and the Antarctic Support Contract for all field and lab logistics. Thanks to Paul Zietz at Dartmouth for running the Lachat QuikChem 8500. We thank Joseph Levy and one anonymous reviewer for providing constructive comments on an earlier version of this manuscript. This project was funded by NSF grant #1115245 to RAV.
Author contributions
RCH designed the project, collected samples, analysed samples and wrote the manuscript. AMS developed lab methods, analysed samples and contributed to the manuscript. RAV designed the project, collected samples and contributed to the manuscript.
Supplemental material
A supplemental table will be found at http://dx.doi.org/10.1017/S0954102016000742.