In early lactation, cows adapt to negative energy balance by mobilizing body fat and protein reserves to fulfil energy and protein demands. It is consequently normal up to a certain point that plasma concentration of ketone bodies increases during this period. Indeed, β-hydroxybutyrate (BHB), one of the three ketone bodies, is mainly formed when non-esterified fatty acid oxidation by the liver is impaired (Goff and Horst, Reference Goff and Horst1997). Hyperketonaemia is a metabolic disorder that can decrease milk production and reproduction performance, and increase health issues (Raboisson et al., Reference Raboisson, Mounié and Maigné2014).
Denis-Robichaud et al. (Reference Denis-Robichaud, Dubuc, Lefebvre and DesCôteaux2014) concluded that milk BHB concentration analysed by flow-injection is highly correlated with blood BHB concentration. Using flow-injection analysis as a gold standard, de Roos et al. (Reference de Roos, van den Bijgaart, Hørlyk and de Jong2007) showed that Fourier-transform infrared (FTIR) spectrometry could be used as a predictor of milk BHB concentration and as a screening tool for cows having elevated milk BHB concentration. Since 2011, Valacta, the Dairy Production Centre of Expertise of Québec and Atlantic Provinces in Canada, has analysed milk BHB concentration by FTIR in regular dairy herd improvement (DHI) milk samples (Santschi et al., Reference Santschi, Lacroix, Durocher, Duplessis, Moore and Lefebvre2016).
McArt et al. (Reference McArt, Nydam and Oetzel2012) evaluated that a case of hyperketonaemia lasts on average 5 d in early lactation. As blood BHB and milk BHB concentrations are highly correlated (Denis-Robichaud et al., Reference Denis-Robichaud, Dubuc, Lefebvre and DesCôteaux2014), it could be hypothesized that elevated milk BHB concentration could also last about 5 d. Compared with regular monthly testing, analysing milk samples of early lactation cows for milk BHB concentration by FTIR more frequently between two milking tests could be a good way to enhance the accuracy of the estimation of the actual prevalence of elevated milk BHB concentration in a herd and to help dairy producers in decision making. In order to adopt more frequent sampling between regular tests, it would be more practical and rapid to collect milk directly from the teat (‘hand-stripping’) either at or between milking times, thereby avoiding the need to install and clean the milk samplers. However, FTIR predictions have been established for DHI milk samples taken with in-line milk samplers, i.e. samples representative of the whole milking. It is unknown if hand-stripped samples taken outside the regular monthly testing could be collected at any time during the day and analysed based on DHI-sample predictions. Thus, this experiment was undertaken to evaluate milk BHB concentration and prevalence of elevated milk BHB concentration measured by FTIR compared with flow-injection analysis from milk samples taken by hand at different times relative to the morning milking. Moreover, milk BHB concentration among different sampling times relative to the milking could be assessed.
Materials and methods
All procedures of this experiment were approved by the Animal Care committee from McGill University, Québec, Canada following the guidelines of the Canadian Council on Animal Care (2009).
Data collection and analysis
Forty-four commercial dairy herds located in the province of Québec, Canada were enrolled in this experiment. Details are provided in the online Supplementary File. A total of 229 Holstein (51 first, 73 s, and 105 third and greater lactations) and 64 Ayrshire (22 first, 19 s, and 23 third and greater lactations) cows were involved as previously described by Duplessis et al. (Reference Duplessis, Cue, Santschi, Lefebvre and Girard2018). Herds were visited once during the morning milking between May and August 2016. Milk samples were taken between 3 and 40 d in milk (DIM) according to the following schedule: (1) A hand-stripped sample just before connecting the milking machine (BEFORE); (2) A DHI sample using in-line milk samplers (DHI); (3) A hand-stripped sample immediately after removing the milking machine and before putting teat dip (AFTER); (4) A hand-stripped sample 3 h after milking (+3 h) and (5) a hand-stripped sample 6 h after milking (+6 h). Teats were cleaned, dipped, and dried prior to milk sampling whilst teats were dipped using on-farm solution after sampling. For hand-stripped samples, milk was taken from one or several quarters. Milk yield from morning milking was recorded.
Milk samples preserved with bronopol were sent immediately to the Valacta laboratory for analysis. Milk BHB concentration was determined by FTIR using MilkoScan FT 6000 (Foss, Hillerød, Denmark) and also with a continuous flow analyser (San++, Skalar, Breda, the Netherlands) as described by de Roos et al. (Reference de Roos, van den Bijgaart, Hørlyk and de Jong2007), with the latter being considered as the reference.
Statistical analyses
Days in milk were divided into four categories: (1) Below 10 DIM; (2) Between 11 and 20 DIM; (3) Between 21 and 30 DIM and; (4) Between 31 and 40 DIM. Proc MIXED of SAS (version 9.4, SAS Institute, 2012) with repeated measures was used to assess differences between milk concentration of BHB obtained by FTIR and flow-injection analyses among times relative to the milking. Proc GLIMMIX of SAS with repeated measures was used to evaluate prevalence of elevated milk BHB concentration ≥0.15 and 0.20 mmol/l (Foss, 2009; Denis-Robichaud et al., Reference Denis-Robichaud, Dubuc, Lefebvre and DesCôteaux2014; Santschi et al., Reference Santschi, Lacroix, Durocher, Duplessis, Moore and Lefebvre2016) between analysis methods according to times relative to the milking. Results were considered significant when P ≤ 0.05. Further details are provided in the online Supplementary File.
Results and discussion
Morning milk yield averaged 19.1 ± 5.3 and 17.0 ± 4.9 kg for Holstein and Ayrshire cows, respectively.
Milk BHB concentration
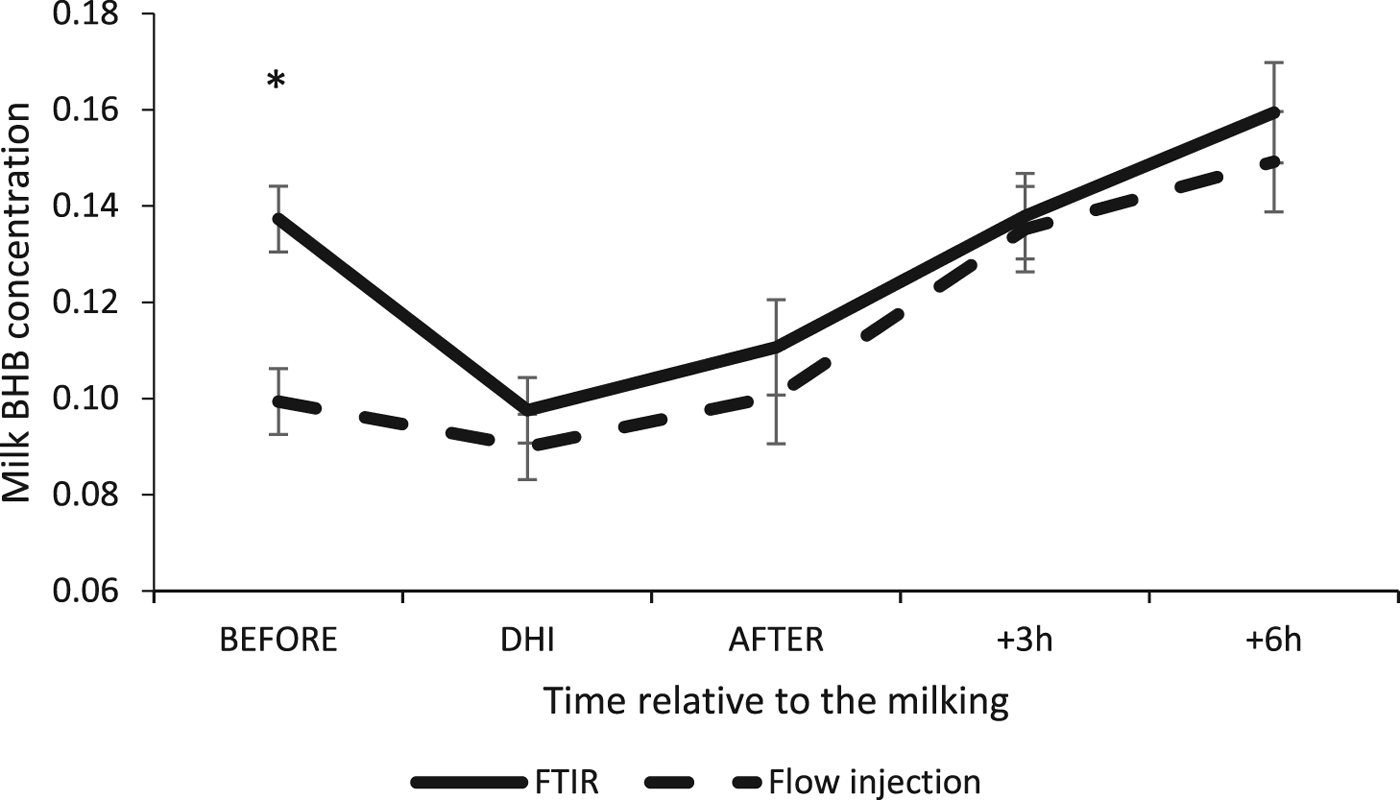
Milk BHB concentration was different between flow-injection and FTIR analyses among times relative to the milking (analysis method × sampling time interaction, P < 0.001; Fig. 1). Indeed, milk BHB concentration averaged 0.10 and 0.14 ± 0.01 mmol/l for flow-injection and FTIR analyses, respectively, at time BEFORE (P < 0.001) but was not statistically different thereafter (P > 0.05). Milk concentration of BHB measured by flow injection increased from 0.10 to 0.15 ± 0.01 mmol/l throughout sampling times (sampling time effect, P < 0.001; Fig. 1). Those results suggest that, besides the time BEFORE, dairy producers could collect hand-stripped milk samples for BHB concentration determination by FTIR at any time from AFTER to +6 h relative to the milking. However, the BHB concentration value rose as time after milking increased. Milk BHB concentration was higher for third and more parity than first and second parity cows (P < 0.001) and milk BHB concentration was higher between 11 and 30 DIM than <10 and between 31 and 40 DIM (P < 0.001). Milk BHB concentration measured by flow-injection analysis in the current study was low compared with some data previously reported in the literature (Denis-Robichaud et al., Reference Denis-Robichaud, Dubuc, Lefebvre and DesCôteaux2014), but similar to the experiment of de Roos et al. (Reference de Roos, van den Bijgaart, Hørlyk and de Jong2007). No difference was noted between Holstein and Ayrshire cows (analysis method × breed interaction, P > 0.05).
Milk β-hydroxybutyrate (BHB) concentration (mmol/l) measured by Fourier-transform infrared (FTIR) spectrometry and flow-injection analysis from samples taken at different times relative to the milking (analysis method × sampling time interaction, P < 0.001). All samples are taken by hand-stripping unless stated otherwise. BEFORE = just before connecting the milking machine; Dairy herd improvement (DHI) = Sample using in-line milk samplers; AFTER = immediately after milking and before putting teat dip; +3 h = 3 h after milking and +6 h = 6 h after milking. *Represents significant sampling times (P < 0.05) according to the SLICE option in the LSMEANS statement of SAS.

Prevalence of elevated milk BHB
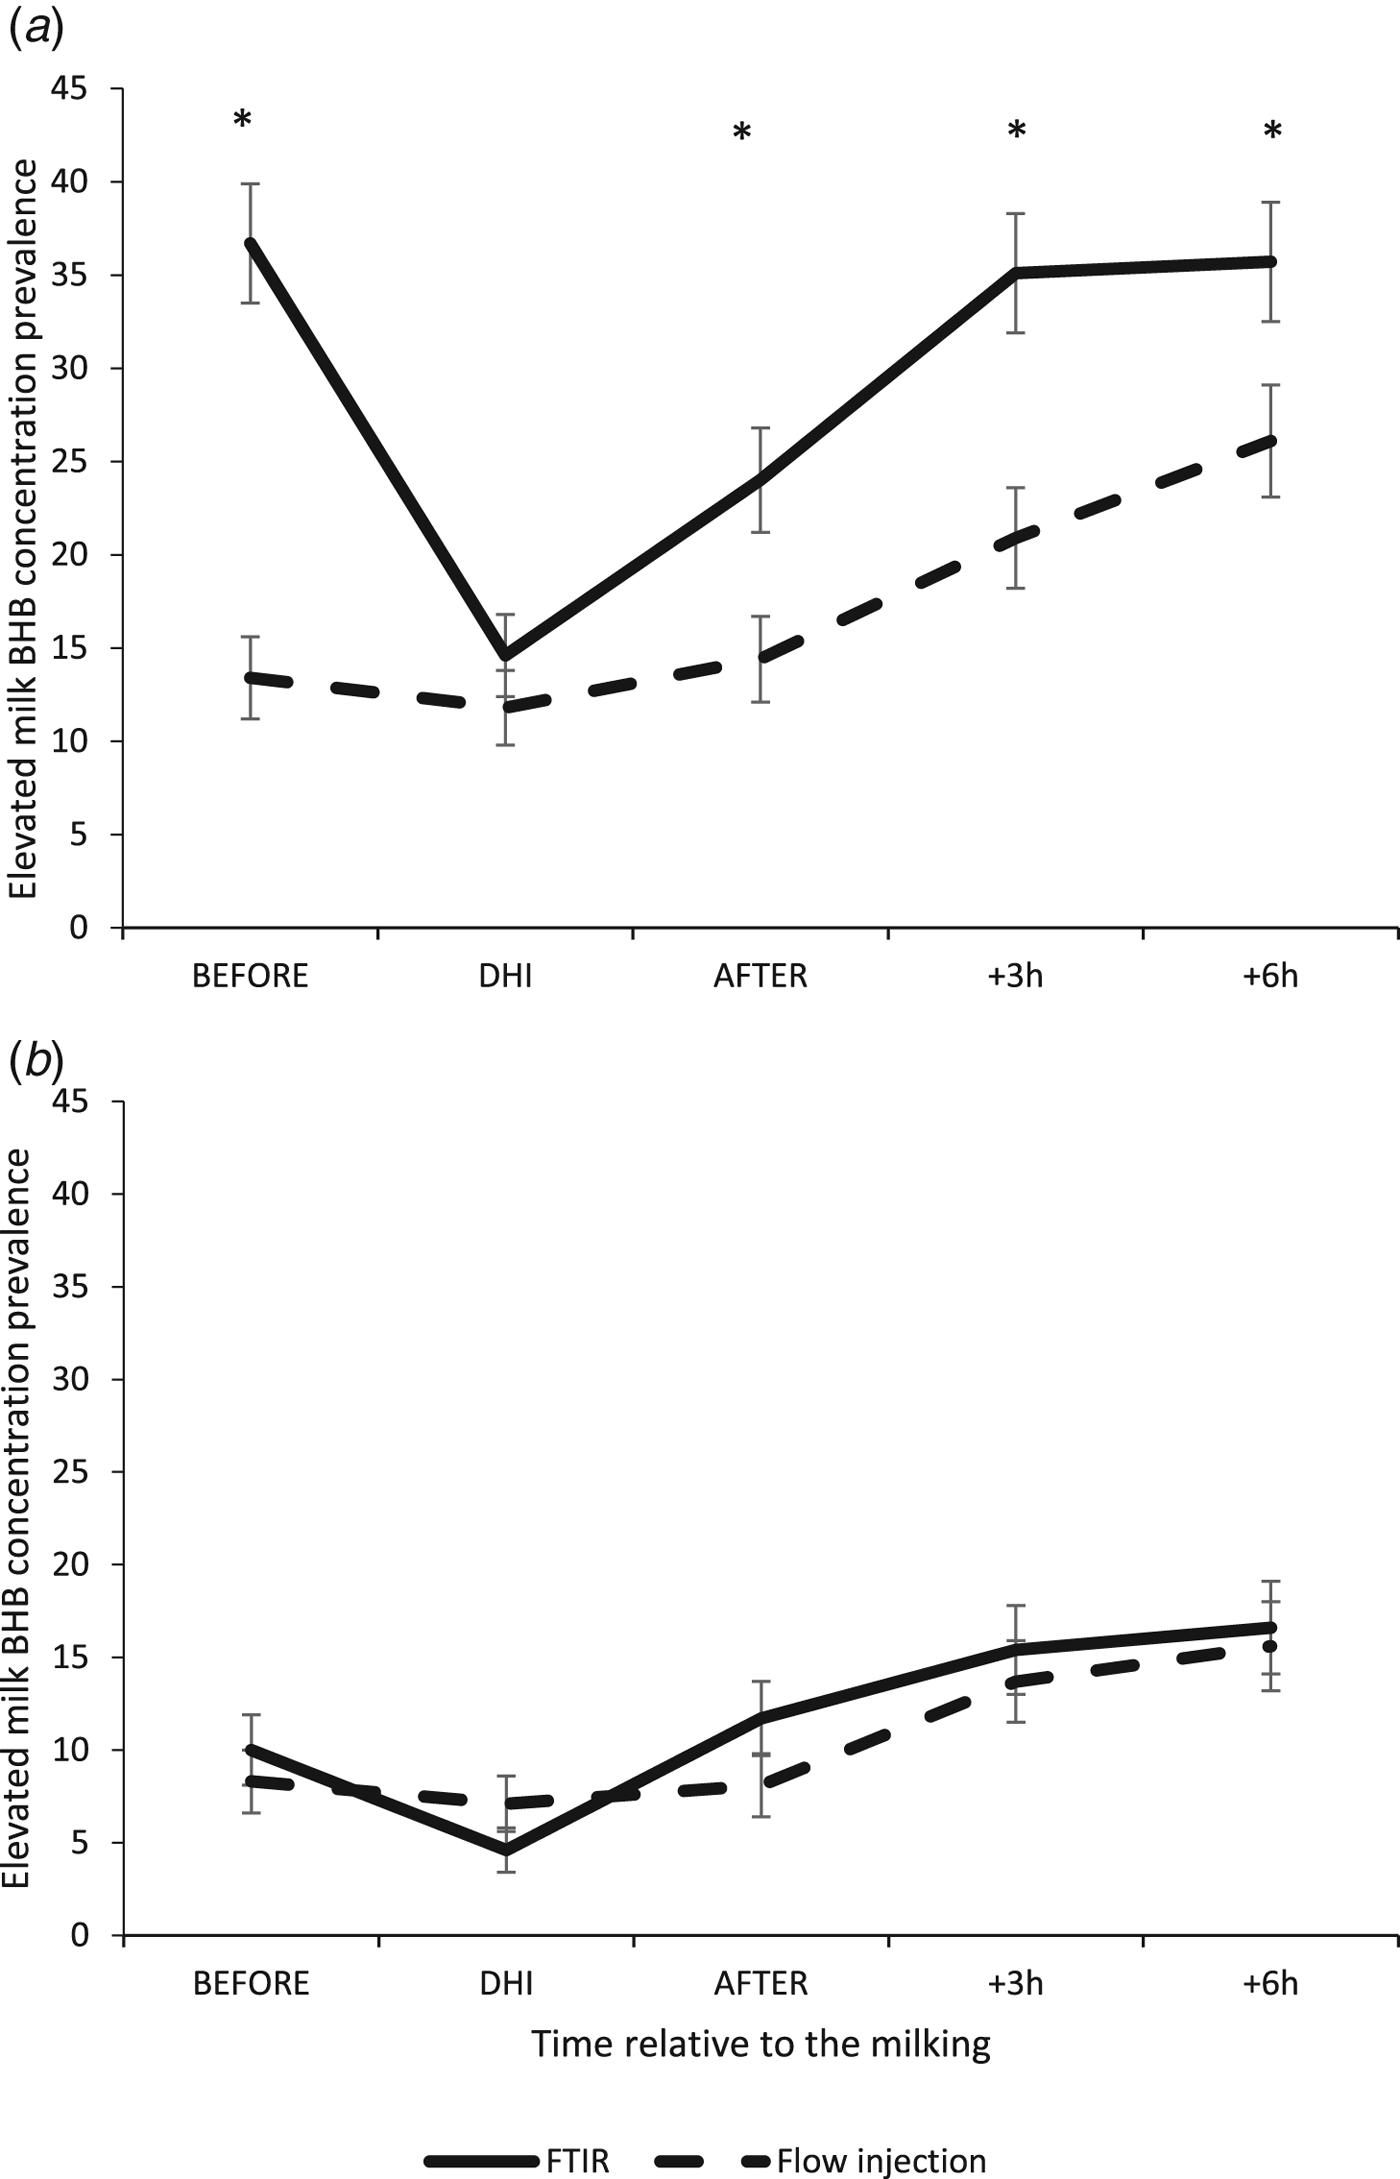
Except for DHI samples, prevalence of milk BHB concentration ≥0.15 mmol/l was greater for FTIR analysis (Fig. 2a; analysis method × sampling time interaction, P < 0.001). A significant analysis method × sampling time interaction (P < 0.001; Fig. 2b) was obtained with 0.20 mmol/l as a cut-off point, but results from the SLICE option of SAS indicated no significant effect of sampling times within analysis (P > 0.05). These results indicate that FTIR analysis overestimated milk BHB concentration ≥0.15 mmol/l for hand-stripped samples and hence it could not be recommended to use this cut-off point. However, a threshold of 0.20 mmol/l could be used to estimate prevalence of elevated milk BHB concentration for hand-stripped samples. No difference was noted in prevalence of elevated BHB between Holstein and Ayrshire cows (analysis method × breed interaction, P > 0.05). Prevalence of milk BHB concentration ≥0.15 and 0.20 mmol/l was greater for third and more lactations than for second or less lactations (parity effect, P < 0.001) as similarly reported by Santschi et al. (Reference Santschi, Lacroix, Durocher, Duplessis, Moore and Lefebvre2016). Regarding DIM, prevalence of milk BHB concentration ≥0.15 and 0.20 mmol/l was lower between 31 and 40 DIM than below 30 DIM (DIM effect, P < 0.001).
Prevalence of elevated milk β-hydroxybutyrate (BHB) concentration (%) above two thresholds (a = threshold of 0.15 mmol/l; analysis method × sampling time interaction, P < 0.001 and b = threshold of 0.20 mmol/l; analysis method × sampling time interaction, P < 0.01) according to two analytical methods (Fourier-transform infrared (FTIR) spectrometry and flow-injection) from samples taken at different times relative to the milking. Other details as for Fig. 1.

Prevalence of milk BHB concentration ≥0.15 mmol/l increased from 13.3% at time BEFORE to 26.0% at +6 h relative to the milking for the reference method (P < 0.001; Fig. 2a). Regarding the 0.20 mmol/l cut-off point, regardless of analytical method, prevalence of elevated milk BHB concentration was 9.0% at time BEFORE, 5.6% for DHI samples and increased up to 15.9% at +6 h (P < 0.001; Fig. 2b). These results are in line with those presented above regarding milk BHB concentration values.
In conclusion, milk collection for BHB concentration by FTIR at time BEFORE should be avoided whereas hand-stripping to obtain milk samples from immediately after milking to (at least) six hours later could be recommended, although the BHB value slightly rose as time after milking increased. Fourier-transform infrared analysis overestimated the prevalence of milk BHB concentration ≥0.15 mmol/l for samples taken between DHI milk samples compared with flow-injection analysis. However, results were consistent when a threshold of 0.20 mmol/l was used whereas prevalence of elevated milk BHB concentration ≥0.20 mmol/l increased with time after milking. From these results, the further recommendation is to use a threshold ≥0.20 mmol/l.
Supplementary material
The supplementary material for this article can be found at https://doi.org/10.1017/S0022029919000220
Acknowledgements
The authors thank the dairy producers for their kind participation. We acknowledge the help of Christa Deacon, Rachid Kouaouci, and the Valacta laboratory staff (Valacta, Sainte-Anne-de-Bellevue, QC, Canada) for milk flow-injection and FTIR analyses. We also appreciate the help of Dr Robert Moore (Valacta, Sainte-Anne-de-Bellevue, QC, Canada) with herd recruiting. This project has been made possible through the support from Programme Innov'Action agroalimentaire from Cultivons l'avenir 2 concluded between Ministère de l'Agriculture, des Pêcheries et de l'Alimentation du Québec and Agriculture et Agroalimentaire Canada, project number IA115301.