

Introduction
In the extensive literature that has been dedicated to the comparative analysis of welfare states over the last 20 years, a significant number of studies have focused on the identification of the ideal regimes, in addition to their empirical validation. The celebrated work, Three Worlds of Welfare Capitalism, by Esping-Andersen (Reference Esping-Andersen1990) – hereafter EA – constituted the point of departure for a vigorous and still ongoing academic debate. In spite of the work's acknowledged merits, various criticisms have been raised, especially regarding the classification of certain countries, as was the case of Italy. Differences in relation to the number of regimes gave rise to several typologies (Leibfried, Reference Leibfried, Ferge and Kolberg1992; Castles and Mitchell, Reference Castles, Mitchell and Castles1993; Siaroff Reference Siaroff and Sainsbury1994; Ferrera, Reference Ferrera1996; Bonoli, Reference Bonoli1997; Korpi and Palme, Reference Korpi and Palme1998), which themselves display significant differences in their classifications of countries (for a survey see Arts and Gelissen, Reference Arts and Gelissen2002; Arcanjo, Reference Arcanjo2006; Bambra, Reference Bambra2007).
Besides the theoretical debate, many empirical studies have aimed to test ‘the three worlds’ (e.g. Alber, Reference Alber1995; Anttonen and Sipilä, Reference Anttonen and Sipilä1996; Gough, Reference Gough2001; Wildboer Schut et al., Reference Wildeboer Schut, Vrooman and de Beer2001; Kautto, Reference Kautto2002; Powell and Barrientos, Reference Powell and Barrientos2004; MacMenamim, Reference MacMenamim2003; Saint Arnaud and Bernard, Reference Saint-Arnaud and Bernard2003; Bettio and Plantenga, Reference Bettio and Plantenga2004; Gal, Reference Gal2004; Soede et al., Reference Soede, Vrooman, Ferraresi and Segre2004; Bambra, Reference Bambra2005a, Reference Bambra2005b; Ferreira and Figueiredo, Reference Ferreira and Figueiredo2005; Guo and Gilbert, Reference Guo and Gilbert2007; Jensen, Reference Jensen2008). Again, we encounter great diversity as regards the number of clusters (from three to seven) and their composition. Indeed, the results position a large number of countries (including those of southern Europe) in different types of regimes.
The classification of some countries in different regimes may be explained by different conceptual and methodological options. However, a third explanatory factor also needs consideration: the different timeframes adopted in the empirical analysis. Indeed, as Esping-Andersen (Reference Esping-Andersen1999: 86) also recognised, there is scope for the reclassification of welfare states due to the social changes implemented over the course of time.
As from the beginning of the 1990s, almost all European countries have introduced wide reaching social changes, among others in eligibility, entitlement, benefits structures and the sources of financing.
Our argument is that these changes may have brought about a repositioning of some countries in the empirically identified welfare clusters. To test out this hypothesis, we adopt the two bi-dimensional approaches of Bonoli (Reference Bonoli1997) and Kautto (Reference Kautto2002) in a longitudinal perspective. The first classification is based on social effort and contribution-dominance, while the second is based on transfer effort and service effort. The four indicators are calculated for 1990 and 2006, for ten European countries, as representative of different regimes: the United Kingdom (UK) and Ireland (liberal), Denmark and Sweden (social-democratic), France and Germany (conservative), Portugal, Spain, Italy and Greece (southern). The data on social protection expenditures and revenue streams are sourced from Eurostat. All the concepts used here are in accordance with the European System of Integrated Social Protection Statistics (Eurostat, 2008b). This analysis should be understood as merely illustrative, given that it retains all of the limitations related to the nature of the indicators (only quantitative) and its non-adoption of more sophisticated statistical techniques.
The structure of the article is as follows. The next section comprises critical analysis of the three ideal typologies – EA's ‘three worlds’ and the proposals of Ferrera and Bonoli, with their identification of a fourth regime encompassing Southern European countries. The second section begins with a description of the main welfare reforms carried out by the ten selected countries across the four functions of social protection (old age, health care, unemployment and family) as well as financing structures. Next, the potential repositioning of some countries is evaluated by applying the two bi-dimensional classifications of Bonoli (Reference Bonoli1997) and Kautto (Reference Kautto2002) to data from 1990 to 2006. The main movements of the countries – intra and inside quadrants – are then interpreted in the light of the previously listed reforms. Finally, the third section provides the conclusions.
Ideal and real types of welfare state
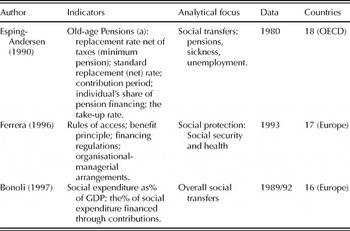
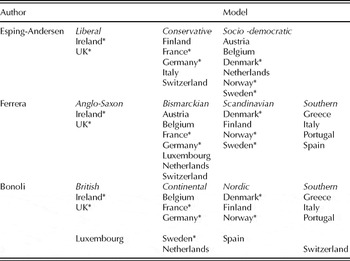
Introducing the concept of welfare regime, EA identifies the three well-known regimes – liberal, conservative and social-democratic – each differing with respect to the historical and political development in various societies. Evaluating the extent of decommodification (see the methodological options detailed in Table 1) revealed that the welfare states cluster into three distinct groups, each containing the countries expected according to his theory of regimes (Table 2).
Three typologies of the welfare state: the methodological options

Note: The variables for sickness and unemployment benefits follow a similar logic (Esping-Andersen, Reference Esping-Andersen1990: 54).
Sources: Based on Esping-Andersen (Reference Esping-Andersen1990), Ferrera (Reference Ferrera1996) and Bonoli (Reference Bonoli1997).
Classification of European countries according to three typologies

Notes: *Countries with a common classification: subgroup of 12 countries.
Sources: Based on Esping-Andersen (Reference Esping-Andersen1990), Ferrera (Reference Ferrera1996) and Bonoli (19997).
EA's typology has generated intense debate within the scope of which several areas of criticism have emerged (e.g. Cnaan, Reference Cnaan1992; O'Connor, Reference O'Connor1996; Gough, Reference Gough2000; Wildboer Schut et al., Reference Wildeboer Schut, Vrooman and de Beer2001; Kasza, Reference Kasza2002; Lewis, Reference Lewis2002; Bannink and Hoogenboom, Reference Bannink and Hoogenboom2007). The divergence over the classification of certain countries (Italy, for example) and the assertion of a fourth or even a fifth regime resulted in the presentation of new typologies (Leibfried, Reference Leibfried, Ferge and Kolberg1992; Castles and Mitchell, Reference Castles, Mitchell and Castles1993; Siaroff Reference Siaroff and Sainsbury1994; Ferrera, Reference Ferrera1996; Bonoli, Reference Bonoli1997; Korpi and Palme, Reference Korpi and Palme1998). According to Bambra (Reference Bambra2007), the proposals of Ferrera (Reference Ferrera1996) and Bonoli (Reference Bonoli1997) are currently of greatest utility in terms of welfare state regime theory.
Based on four indicators and data from 1993 (Table 1), Ferrera proposed the grouping of European systems into four ‘families’ (Table 2), with the fourth ‘family’ comprising the four Mediterranean countries, the social protection systems of which presented ‘peaks of generosity accompanied by vast gaps in protection’ (Reference Ferrera1996: 29). Based on additional characteristics – for example, the formation of fairly elaborate ‘patronage systems’ for the selective distribution of cash benefits – Ferrera stated that the Southern European welfare state is characterised by a peculiar mode of political functioning (ibid.: 29).
These conclusions give rise to two different questions. Firstly, the polarisation of material coverage can only be explained by the lower level of system development, as acknowledged by the EC (1993), Katrougalos (Reference Katrougalos1996), Ferrera et al. (Reference Ferrera, Hemerijck and Rhodes2000), and Vogel, Reference Vogel2003). Secondly, Ferrera's reflection on political clientelism appears to be a forced generalisation on the social security domain, at least with regard to Portugal. Hence, it seems reasonable to argue that these features are not structural in nature but only behavioural patterns (Sotiropoulos, Reference Sotiropoulos2004: 406).
Bonoli (Reference Bonoli1997) developed a bi-dimensional classification (Table 1), based on the Bismarckian and Beveridgean models, and differentiated by five dimensions (objectives, benefits, eligibility, coverage and financing). The classification of the European countries proved similar to that of Ferrera (Table 2), despite the number of exceptions and mixed cases (for example, Portugal).
Regarding cluster composition, and taking into consideration only the 12 countries selected in common by the three authors, we find only seven countries are given the same classification (Ireland, the UK, France, Germany, Denmark, Norway and Sweden). Of the countries for which a divergent classification is observed, the case of Italy may be taken to represent the crucial question as to whether or not a specific regime for Latin European countries exists. Indeed, this question remains open in empirical studies: some of them supported the existence of a specific regime (e.g. Kautto, Reference Kautto2002; Saint Arnaud and Bernard, Reference Saint-Arnaud and Bernard2003; Soede et al., Reference Soede, Vrooman, Ferraresi and Segre2004; Ferreira and Figueiredo, Reference Ferreira and Figueiredo2005), while others classify such countries in different clusters (e.g. Gough, Reference Gough2001; MacMenamim, Reference MacMenamim2003; Powell and Barrientos, Reference Powell and Barrientos2004).
Welfare regimes over time
The main welfare reforms in the ten countries
Since the mid-1990s, a large body of literature has been devoted to the analysis of welfare state reform, particularly in Western Europe, by virtue of the important challenges shared, to different extents, by all countries. The external pressures (globalisation) and/or internal pressures (ageing populations, slower economic growth, high and persistent unemployment, transformation of the household structure and the Economic and Monetary Union (EMU)-related constraints on public spending) have been identified as the major drivers of social change (e.g. Buti et al., Reference Buti, Franco and Pench2000; Iversen, Reference Iversen and Pierson2001; Pierson, Reference Pierson and Pierson2001; Powell and Hewitt, Reference Powell and Hewitt2002; Korpi, Reference Korpi2003; Castles, Reference Castles2004).
During the period 1990–2006, a large number of reforms were carried out by the ten selected countries. Despite great diversity among the measures adopted, certain major concerns have emerged, such as the need to adapt national systems to demographic, economic and financial restraints. Descriptions of the more significant trends in four functions of social protection (old age, health care, unemployment and family) as well as in the financing structure are presented below (for a detailed analysis, see, Eurostat, 2000, 2001b, 2002, 2004, 2005, 2006; Oliver et al., Reference Oliver, Mossialos and Maynard2005; Schubert et al., Reference Shubert, Hegelich and Bazant2009).
Pension reforms have been a common theme to all ten countries and were designed to curb expenditure. Some reforms have focused on the age of retirement, pension calculations (lengthening the period that determines the reference for income and/or lowering the accrual rate), while others were related to complementary and/or supplementary schemes. Most countries enacted measures across almost all these areas over the period in question. The increase in the normal retirement age was observed in Germany, Italy, Greece and Portugal (for woman), while Denmark, Sweden and Italy limited the possibility of early retirement prior to the normal age (Portugal experienced the opposite trend). The calculation of pensions has been changed in Germany, France, Italy, Portugal and Spain, as well as Denmark and Sweden in their earnings related pensions. Many countries decided to shift part of the burden from statutory insurance systems onto complementary/supplementary schemes (the UK, Ireland, Germany, Denmark Sweden, Italy and Spain), so increasing social security revenues. It is important to note that some countries adopted ad hoc measures that have led to increases in state pensions expenditure: extended eligibility (Portugal), new benefits for pensioners (Ireland, Portugal and Greece), or higher annual increases in the minimum pension (Spain, Italy, Greece, Portugal and Denmark). In the case of old age benefits in kind, an increase in formalised care to the elderly has been observed in several countries (Portugal, Greece, Italy, Sweden and the UK).
A second common theme was reform of unemployment protection. During the period, almost all countries attempted to curb unemployment expenditure growth, adopting a different mix of instruments relating to eligibility and entitlement criteria, although to different extents. The qualifying period became more restrictive in Sweden, Denmark and Germany (and less restrictive in France), while all countries have introduced more restrictive payment conditions, mainly by implementing activation measures. The amount of benefit underwent a decrease in Spain, France, Germany, Denmark and the UK, while the duration of payments was reduced only in Denmark, Sweden, Ireland and the UK.
In the field of health care, the most important expenditure of in kind benefits, two trends can be distinguished. First, several measures have been adopted in order to reduce or at least control public expenditure (Spain, Portugal, Greece, France, Germany and Sweden) by increasing dependence on user charges and promoting the use of generic medicines. However, some countries made access easier by reducing waiting lists and times (the UK and Portugal) and extended coverage (France, Greece, Portugal and Italy). Additionally, some countries have carried out changes in the organisation of the health-care systems, among which Sweden stands out, given the strong decentralisation of primary care to county councils.
The issue of financing the social emerged in a number of countries (Spain, France, Portugal and the UK), which separated the financing sources according tobenefit type, increasing the portion funded by taxation. The structure of financing has been influenced by the reduction or exemption of employer contributions in return for hiring unemployed persons (Germany, France, Ireland, Spain and Portugal).
Finally, it should be noted that some increase in social expenditure can be justified by improvements in coverage and the amount of family and children benefits (cash and in kind) observed in all countries, as well as in the social benefits in favour of the most vulnerable groups (Denmark, France, Greece, Portugal and the UK), thereby increasing financing by taxation.
Social effort and financing
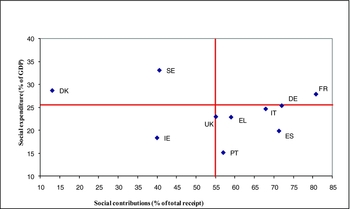
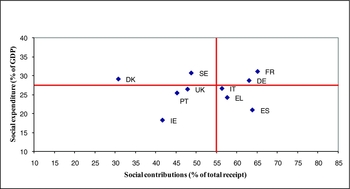
A first longitudinal analysis relates the positioning of the ten countries in 1990 (Figure 1) and 2006 (Figure 2) according to the ratio of social protection expenditure to gross domestic product (GDP) (social effort) and to the ratio of social contributions to total revenues (contribution-dominance). The reference values were set at 27.5 per cent (EU-15 average) and 55 per cent (dominance of social contributions), respectively.
Social effort and financing in 1990

Social effort and financing in 2006

In 1990, three countries were situated in the left-hand quadrants (Beveridgean model): Denmark and Sweden (high spenders), and Ireland (low spender). Another five countries were located in the right-hand quadrants (Bismarckian model): France (high spender), Germany and Italy (average spenders), Greece, Spain and Portugal (low spenders). The UK could be defined as a mixed case: a low spender, with equal emphasis on contributions and taxation. Due to the Italian case, the Mediterranean countries did not cluster together.
Over the period 1990–2006, two general trends were observed in the EU-15: average expenditure on social protection increased (from 25.5 per cent to 27.5 per cent of GDP), with social contributions reinforced as the main source of funding. However, these general trends mask major national differences which are illustrated here by the ten countries under analysis.
Relating to the social effort, one significant contraction was observed in Sweden – due to a decrease in both the transfer and service efforts – while in Ireland the ratio remained constant. By contrast, an increase in the ratio was observable in all other countries, among which are worth mentioning Portugal (10.2 points) and the UK (3.4 points), both explained by higher transfer and service efforts.
Regarding the structure of financing, only three countries (Denmark, Sweden and Ireland) reinforced the prevalence of contributions, while the remaining seven increased the share of government funding. The most pronounced changes took place in Portugal, Italy, Spain and France (from –12 to –15 points) and Sweden (+17 points). These dual effects explain the repositioning of the countries in 2006 (Figure 2).
The composition of the three groups identified in 1990 experienced three changes: Portugal moved to the Beveridge group, showing a close-to-average social effort; the UK clearly moved into the same group; and, finally, Italy became a mixed case in terms of funding. Particularly interesting are the movements inside quadrants in the cases of Denmark (an outlier in 1990), Sweden, France and Germany, where all register a major change in funding sources, through not enough to characterise a paradigm shift; the case of Sweden added the only contraction in social effort.
The dispersion observed in 1990 resulted in a higher concentration of countries around the reference values, which suggests a trend towards convergence already detected in other empirical studies (Kautto, Reference Kautto2002; Guo and Gilbert, Reference Guo and Gilbert2007).
Transfer effort and service effort
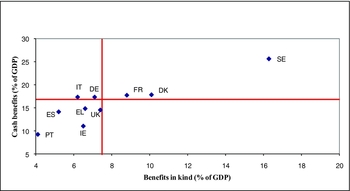
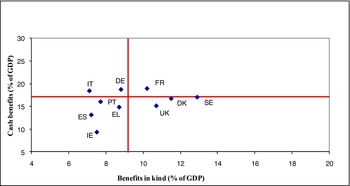
We proceed now to the second longitudinal analysis: the positioning of the ten countries in 1990 (Figure 3) and 2006 (Figure 4) according to the transfer effort (social expenditure on cash benefits as a percentage of GDP) and to the service effort (social expenditure on benefits in kind as a percentage of GDP).
Transfer effort and service effort in 1990

Transfer effort and service effort in 2006

In 1990, the transfer effort ranged from 9.3 per cent (Portugal) to 25.7 per cent (Sweden), while the service effort ranged from 4.1 per cent (Portugal) to 16.3 per cent (Sweden). Setting the reference values at 16.9 per cent and 7.7 per cent (EU-15 averages), and using the terminology of Kautto (Reference Kautto2002), the following groups can be identified: a service group, characterised by a high service effort and a high/average transfer effort (Sweden, Denmark and France), a transfer group, characterised by a high transfer effort and an average service effort (Italy and Germany), and a third group characterised by a low service effort and a low transfer effort (Portugal, Greece, Ireland, Spain and the UK).
Over the period 1990–2006, there was another general trend in Europe: an increase in the service effort (1.7 points) and the practical maintenance of the transfer effort (0.3 points). The reference values are set now at 9.2 per cent and 17.2 per cent. Again, the EU-15 averages hide significant differences in the behaviour of different countries. In the case of our ten countries, transfer efforts ranged from 9.4 per cent (Ireland) to 18.8 per cent (Germany) of GDP, while the service effort ranged from 7.1 per cent (Italy) to 12.9 per cent (Sweden) of GDP.
Changes in the two ratios over the period may be evidence of changing numbers of beneficiaries related to unemployment and ageing and/or an impact of welfare reforms. However, these effects may have contrary impacts in some countries. Additionally, we must remember that differences from country to country are always partially explained by economic development. With these reservations, we now seek to interpret the main changes in the two ratios in the light of the major welfare reforms identified above.
Compared with 1990, five countries recorded lower (Sweden, Denmark, Ireland and Spain) or constant transfer efforts (Greece), while the remaining five show an increased ratio with the most pronounced changes observed in Sweden (–8.6 points), Portugal (+6.8 points) and the UK (+4.5 points). The interpretation of these results requires the identification of four different cases: (i) countries that have implemented a significant mix of measures in order to contain pensions and unemployment expenditure (Sweden, Denmark and Spain); (ii) countries that have adopted measures to control expenditure and also some other measures with the opposite effect (France, Italy and the UK); (iii) the case of Germany where the impact of reforms may have been undermined by economic conditions; (iv) the special case of Portugal, which demonstrated a broadening of the public system over the whole period.
Still in comparison with 1990, a decrease in service effort was recorded only in Sweden (–3.5 points), while the highest increases in the ratio were registered by Portugal (+3.6 points) and the UK (+3.3 points). These results are not surprising given the aforementioned reforms, particularly in health care (controlling expenditure or improving access and coverage) but also in family and old age (formalised care) functions.
Once again, these combined effects explain the repositioning of several countries. Two countries changed their previous reference group: the UK moved to the service group, while Portugal (an outlier in 1990) became more like Italy (transfer group). Sweden, another outlier in 1990, underwent the most pronounced movement inside the quadrants, which is justified by the contraction in both the transfer and service efforts.
Conclusions
Despite the extensive scientific production over the past 19 years, we may conclude that the number of clusters as well as their composition remains an open issue. The diversity found in the extensive number of empirical studies appears justified given the variety of their conceptual and methodological options.
However, another explanatory factor must be taken into consideration, i.e. the potential effects of reforms carried out, particularly in Europe, on the classification of the welfare states. To test this hypothesis, the bi-dimensional approaches of Bonoli (Reference Bonoli1997) and Kautto (Reference Kautto2002) were applied in a longitudinal perspective – 1990 and 2006 – to ten European countries as representative of different welfare regimes.
Despite the limitations of the quantitative indicators, some main results may be identified. As regards the social effort and the structure of financing, we observed some interesting repositioning of countries in 2006: Portugal moved to the Beveridge group, showing a social effort close-to-average; the UK, a hybrid case in 1990, moved clearly to the same group; and, finally, Italy became a mixed case in terms of funding. Particularly interesting was the inner quadrant movement of Sweden, which is explained by a double effect, i.e. a major change in the structure of funding, though not enough to characterise a paradigm shift, and the only contraction in social effort. Besides the border case of Italy, the other three Mediterranean countries appeared classified in two different clusters.
As regards the transfer effort and the service effort, some interesting movements were also detected. Two countries changed their previous reference group: the UK moved to the service group, while Portugal (an outlier in 1990) became more like Italy (transfer group). Sweden, another outlier in 1990, provided the most pronounced inner quadrant movement, which is justified by the contraction in both the transfer and service efforts.
The results for all ten countries appear consistent with the main trends in welfare reforms identified. Correspondingly, the more pronounced movements of the three countries mentioned is evidence of the impact of the various changes implemented over the period: (i) Sweden adopted a significant mix of measures in order to contain pensions, unemployment and health care expenditure, (ii) in the UK, the impact of measures aimed at controlling expenditure has been hampered by the impact of all the measures adopted catering for the elderly (new cash benefits and long-term care) and families, (iii) Portugal showed a broadening of the public system over the whole period as a result of improvements in access, coverage and generosity in all social functions.
Finally, it should be noted that the typologies of Bonoli and Ferrera are not validated by the clustering of the ten countries in 2006. Indeed, not only do the Mediterranean countries appear classified in different clusters, but also the number of hybrid cases is significant due to a higher concentration around the EU-15 reference values.