

POLITICIANS Dogged by Voter Discontent.” “Apathy Growing in Many Voters.” “Voter Turnout a Vexing Problem.” “Record Low Voter Turnout Expected in National Election.” “Concerns over Low Voter Turnout.” “Low Voter Turnout Puzzles Analysts.” “Voter Turnout Lowest in 20 Years Due to Political Apathy.” These post-2000 headlines from leading media around the worldFootnote 1 illustrate how declining voter turnout has become a global phenomenon in contemporary democracies. Whereas in the late 1960s, more than 77 percent of citizens typically voted in national legislative and presidential elections, after 2010, the global average voting rate fell to 67 percent.Footnote 2 Figure 1 shows the gradual nature of this decline.Footnote 3 Although democracy expanded across countries,Footnote 4 electoral participation faded within them. This is both problematic and puzzling.
Evolution of Voter Turnout in National Elections 1945–2017a
a The figure draws on the first rounds of legislative (lower house) and presidential elections. Voter turnout is measured as percent of registered voters. For sources and further details, see the data and methods section of analysis 1.

The global decline is problematic because low voter turnout often reflects the fact that economically and socially disadvantaged groups tend to abstain from voting more than wealthy and resourceful groups, which calls into question the principle of democratic equality.Footnote 5 Moreover, there is evidence that low voter turnout introduces a bias in public policy, reduces government responsiveness, and favors clientelism and patronage over programmatic party competition.Footnote 6
For a number of reasons, the global decline in voter turnout is puzzling. First, it occurred despite the presence of factors that could have increased participation, such as a general rise in education.Footnote 7 Second, the most intuitive explanation, heavily present in journalistic accounts, which attributes the decline to citizen discontent, is not supported by available microlevel and macrolevel evidence (see below). Third, the decline is not a result of the five-fold expansion of the pool of electoral democracies by low-turnout countries. In countries that have held elections continuously since the 1940s, post-1960 voting rates have fallen as much as the global democratic average (see Figure 1).Footnote 8
Political scientists have offered a large number of alternative accounts. The most prominent hypotheses, which we discuss in depth in the next section, pertain to a decline in group mobilization, transformation of party competition, voting-age reform, income inequality, economic globalization, and generational change. But the current literature does not clearly solve the puzzle of voter decline, as existing studies usually theorize and test the different hypotheses in isolation and on a limited number of elections. Moreover, they rarely quantify the relative weight of the various contributions to the decline. In this article, we draw on valuable insights from existing studies and propose a comprehensive investigation of the global rise in electoral abstention.
From a theoretical standpoint, we critically reassess the strengths and weaknesses of the competing explanations. We argue in favor of two hypotheses—generational change and a multiplication of elective institutions—which we further develop. The generational hypothesis builds on the rich literature on value change inspired by modernization theory.Footnote 9 We postulate that new generations born in relative material affluence have different values, ones that are less conducive to electoral participation, than generations born in less economically favorable contexts. The increasing share of these new generations in the electorate gradually reduces the aggregated voting rates. The second hypothesis is based on the observation that democracies have witnessed a substantial increase in the total number of elections and referendums in which citizens may participate. Drawing on the existing evidence on the effects of election frequency, we argue that the increase in the number of elective institutions has depressed global voter turnout.
The empirical contribution of this article consists of testing our two hypotheses as well as alternative explanations in large-scale analyses that combine evidence from the aggregated and individual levels. In total, the analyzed data span 1,421 national elections and 314,071 individual observations from high-quality post-electoral surveys. Moreover, besides testing the different hypotheses, our study explicitly estimates the weight of their contribution to the global decline in voter turnout.
The empirical section proceeds in three steps. First, we put all the major hypotheses to the test in what we believe is the most comprehensive cross-national analysis of voter turnout to date. This analysis employs an original exhaustive data set of democratic legislative and presidential elections held across the globe from 1945 through 2017. It shows that in contrast to other explanations, the generational and elective institutions hypotheses receive empirical support across a variety of model specifications and additional robustness checks. Second, we focus on the generational hypothesis and test it directly at the individual level using survey data from the four waves of the Comparative Study of Electoral Systems (cses) as well as from national election studies from Britain, Canada, and the United States. This second analysis also fully supports the generational explanation and provides no evidence in favor of competing alternatives. Moreover, the estimated magnitude of generational differences in voter turnout is, interestingly, similar to that observed in the first analysis. Third, we estimate the contributions of our key factors, generational replacement and rising number of elective institutions, to the global decline by calculating counterfactual voting rates. Altogether, these findings contribute to a better understanding of the current transformation of representative democracy and the challenges it faces.
I. Existing Explanations
The most intuitive explanation of why turnout has declined pertains to citizen discontent. Political analysts often assume that the growing number of abstainers reflects citizen dissatisfaction with politics. But the political science literature does not support this view theoretically or empirically. Theoretically, it is not clear why dissatisfaction should demobilize rather than mobilize voters or why these effects should not cancel out each other.Footnote 10 Empirically, little evidence suggests that satisfaction declined over the past decades.Footnote 11 In addition, Lawrence Ezrow and Georgios Xezonakis find that contrary to conventional expectations, democratic satisfaction, rather than dissatisfaction, can be detrimental to voter turnout.Footnote 12 Ultimately, research using microlevel panels reveals that the relationship between democratic satisfaction and voter turnout is reversed. In earlier work, we demonstrate that although preelection satisfaction is unrelated to voter turnout, postelection satisfaction is generally stronger among voters than among nonvoters thanks to the legitimizing effect of elections and a boost in satisfaction in the victorious camp.Footnote 13
In the political science literature, one of the first influential explanations of the global decline in voter turnout relates to group mobilization. Mark Gray and Miki Caul argue that falling membership rates in trade unions and political parties (particularly left-wing parties), observed in most established democracies, weakened the mobilization of peripheral voters.Footnote 14 But although lower membership in political organizations naturally does not help voter turnout, the magnitude of this effect is likely to be small.Footnote 15 Moreover, it may be at least partly compensated for by modern mobilization techniques, including social media.Footnote 16
Mark Franklin suggests two main causes of declining voter turnout: transformation of party competition and voting-age reform.Footnote 17 In regard to party competition, he argues that voter turnout declined because elections became less decisive as party systems gradually fragmented after the 1960s. This greater fragmentation led to more coalition cabinets and a weaker correspondence between the outcome of the election and the composition of the government.
The second cause of the decline in voter turnout, according to Franklin, is the lowering of the voting age below twenty-one, which occurred in most established democracies around the mid-1970s. Franklin contends that lowering the voting age increases abstention in the first elections citizens face, which has implications for their long-term propensity to vote. When compared to first-time voters age twenty-one and over, eighteen-to-twenty-year-olds are less likely to acquire the habit of voting. The progressive replacement of cohorts who made their first voting decision after age twenty-one by those socialized earlier results in an overall decline in turnout. A weak point of this explanation is that it does not take into account the variety of situations in which young adults live, which reflect the job market and welfare state arrangements, among other factors. In a number of countries where turnout declined the most, especially in southern Europe, many eighteen-to-twenty-year-olds live with their parents, which should protect them from the negative effect of the voting-age reform. In contrast, in northern Europe, where voter turnout declined the least, youngsters often leave their families early thanks to generous welfare schemes and a healthy job market.Footnote 18
Frederick Solt uses survey data to demonstrate that income inequality may depress electoral participation and the engagement of the lowest income categories in particular.Footnote 19 As inequality has risen in recent decades,Footnote 20 this factor may have contributed to the global voter decline. Yet two caveats are in order. Theoretically, inequality may mobilize voters when political parties seize on it.Footnote 21 And empirically, most studies using aggregated voter turnout have not found support for the negative effect of income inequality.Footnote 22 It thus seems that the role of income inequality in participation is “more complex than has often been articulated.”Footnote 23
Several studies suggest that economic globalization is a major source of declining turnout.Footnote 24 According to these accounts, increased economic integration and capital mobility constrain government policy, which makes national elections less relevant. The strength of this account is that it can in theory explain the global nature of the decline. But economic globalization is accompanied with a rise in the prominence of cultural issues. And parties that oppose the principles of economic and cultural openness are able to gather considerable support and influence policy outcomes,Footnote 25 raising turnout in some social groupsFootnote 26 and countries.Footnote 27 Therefore, whether and by how much economic globalization depresses voter turnout remains an open question. At the empirical level, several studiesFootnote 28 find support for the negative effect of globalization and party-competition depolarization on turnout. By contrast, Lasse Aaskoven conducts three different types of analysis and finds little evidence of fiscal constraints’ negative effect on voter turnout.Footnote 29
In sum, there are several promising explanations for declining turnout, but none is free of caveats. Some of these explanations, in particular the economic globalization hypothesis, are macro-macro accounts and do not provide supporting evidence from individual-level research. By contrast, the hypotheses we present in the next section build heavily on findings at the individual level.
II. Theory and Hypotheses
This section presents and further develops two explanations. The first suggests that the decline in voter turnout stems from generational replacement. Although this explanation capitalizes on valuable insights from earlier works, it fundamentally departs from the existing literature in that it attributes the causal mechanism of generational change to economic affluence. This explanation has important implications for the empirical tests of the generational account as well as for our understanding of the ultimate causal factors that depress voting rates. The second explanation is institutional and points out the rising number of elective institutions across the democratic world. Although it is clear from the existing research that this institutional trend may be detrimental to participation rates, this factor has been curiously overlooked as an explanation for the long-term decline in global voter turnout.
Emergence of Affluent Generations
Researchers have long observed that in established democracies, voter turnout tends to be quite stable, oscillating by only a few percentage points from one election to another.Footnote 30 This stability seems to stem from the fact that once individuals get politically and electorally socialized, which typically occurs by the time they reach their late twenties, their propensity to vote tends to remain relatively stable through the rest of their lifetime.Footnote 31 Some works interpret this stability as a sign of a habit;Footnote 32 others argue that stability in voting instead reflects stability in attitudes that drive the decision to vote, such as political interest.Footnote 33 In any case, relative stability in the individual propensity to vote suggests that major trends in voter turnout occur primarily through generational replacement as new cohorts replace older ones.
Accordingly, a large number of studies of individual-level voter turnout have discovered generational differences between more electorally active older cohorts and less active younger cohorts.Footnote 34 Among these studies, one by André Blais and Daniel Rubenson presents evidence from the most diverse set of countries.Footnote 35 Studying longitudinal survey data from eight established democracies, they show that individuals born after 1960 vote at significantly lower rates than earlier generations when age and period effects are accounted for. They also demonstrate that the generational difference disappears once two key political attitudes are controlled for: civic duty and external political efficacy. In other words, members of the post-1960 cohort vote less than their predecessors because they have a weaker sense of duty and lower sense of efficacy.
These results support the view that generational differences in attitudes may be one of the causes, if not the main cause, of the gradual decline in voting rates around the world. But the main limitation of such an explanation is that the deep causes of the generational difference in political attitudes remain unknown. Most of the aforementioned studies, which typically focus on individual countries, interpret the differences between generations in terms of country-specific historical events and periods. This means that the generational differences are seen as products of the changing sociopolitical climate in the countries under study. But a slightly different, though largely compatible, interpretation is arguably more compelling.
Given that similar effects are observed across democracies located in different subregions of the developed world with contrasting political trajectories,Footnote 36 generational differences in turnout are unlikely to primarily reflect these countries’ or their subregions’ political or historical singularities.Footnote 37 Instead, they should stem from what these countries have in common, which is clearly economic development and its corollaries, such as education, access to information, and the weakening of traditional social hierarchies. This alternative interpretation is fully compatible with a broad stream of literatureFootnote 38 that draws on Ronald Inglehart’s pioneering workFootnote 39 and shows that economic affluence produces significant cultural change. Affluence radically transforms lifestyles and changes the socialization environment in which individuals develop their values and attitudes. Historical research has meticulously documented how the emergence of an age of affluence in the late 1950s and early 1960s transformed Western societies. It created a world in which youth no longer had to help their families with subsistence and instead developed an autonomous culture with distinct values and norms.Footnote 40
An important aspect of this cultural transformation is a generational decline in deference to authority and social norms.Footnote 41 Given that the social norm of participation (that is, the feeling that voting is a civic duty) is one of the key reasons why citizens vote,Footnote 42 the observed cultural change is likely to have depressed new generations’ propensity to vote. This mechanism would explain the generational differences in voter turnout rates observed across a variety of countries. More general studies on political participation corroborate this theory. They observe that in contrast to older generations, new generations consider citizenship more as a right than as a duty and increasingly prefer direct forms of participation, such as protests or boycotts, to voting.Footnote 43
Affluence, therefore, produces an environment in which electoral abstention is significantly less stigmatizing. This destigmatization process should exert the strongest effect among less educated citizens, who are less interested in politics than those with more educations and who have a low intrinsic motivation to vote. It is indeed those citizens whose participation has declined the most in European democracies.Footnote 44 Like education,Footnote 45 affluence thus exerts a different effect at the micro and macro levels. Whereas microlevel affluence is associated with participation, macrolevel affluence and the resulting social change start depressing overall participation levels when the country reaches an advanced level of economic development.
If this theory is correct, similar generational differences should be observed in most electoral democracies when they reach levels of economic development comparable to those observed in the West around the early 1960s. In other words, this theory implies that new cohorts of voters who were born and socialized in relative societal economic affluence (and whom we hereafter call “affluent”), progressively reduce the global turnout rate. It should be emphasized that many members of the affluent cohorts are far from individually well off in terms of assets or income. What matters is the global socialization context that the different cohorts experienced.
This theory addresses shifts in lifestyles as a result of long-term economic transformation, not the ebbs and flows of the economy. Given that economic slowdowns in developed countries do not make children join the workforce in their early teen years and do not eradicate youth culture and autonomy, our theory implies that they also do not stop or reverse the process of generational change. We thus do not expect that the post-1970 economic slowdown or the 2008 economic crisis would have halted the generational decline in the propensity to vote in economically developed democracies. Our theory is inspired by earlier economic,Footnote 46 political,Footnote 47 sociological,Footnote 48 and historicalFootnote 49 research that explicitly describes the late 1950s and early 1960s as an age of affluence. Hypothesis 1:
—H1. The share of cohorts that grew up in relative economic affluence is negatively associated with voter turnout.
Institutional Change
In past decades, citizens’ requests for greater participation in government resulted in institutional reforms that significantly increased the number of times citizens are invited to vote in most electoral democracies. Elections have proliferated because of decentralization, regional (that is, European) integration, frequent use of referendums, introduction of directly elected presidencies, and shorter terms of office. For instance, in France, in the three years before the 1978 legislative election, citizens could participate in three elections on average. In the three years before the 2017 legislative election, they could participate in nine elections and millions of citizens voted in open presidential primaries organized by several political parties.Footnote 50 Interestingly, the 2017 legislative election recorded the lowest turnout in France’s post-1945 history. In other countries, the expansion of voting opportunities has been less dramatic, but in European Union member states, for example, the number of elected institutions increased by approximately 34 percent on average from the 1960s to the 2010s.Footnote 51
This phenomenon has so far passed unnoticed in the literature on the global decline in voter turnout. This is surprising, given that theoretical arguments and empirical findings support the negative effect of election frequency on voting rates. Moreover, a high number of elective institutions is often advanced to explain why voter turnout is exceptionally low in countries like the United States and Switzerland.Footnote 52
The detrimental effects of election frequency on participation may be manifold.Footnote 53 Some voters are likely to perceive the increasing participatory demands as unrealistic and feel that if they vote in one election, they have fulfilled their duty and are entitled to abstain in the following election. Further, more elections typically mean more campaigning time and greater strain on party resources. Although additional public funding may be available in some cases, the contributions and availability of party supporters usually cannot be significantly expanded and need to be pooled across the increasing number of elections. More generally, the effectiveness of party mobilization appeals is presumably inversely proportional to the frequency of mobilization. The more often voters get mobilized, the less powerful the mobilization message becomes. In addition, the creation of new elective institutions reduces the importance of preexisting institutions. As long as preexisting and new types of elections are held separately, voters see fewer benefits than before from participating in the preexisting types of elections.
Empirically, most existing studiesFootnote 54 find that election frequency has a substantial and statistically significant negative effect on voting rates. But these studies typically do not explicitly connect the rise in election frequency with falling participation rates. Therefore, there is still no empirical evidence that this factor significantly contributes to the puzzle of global voter decline.Footnote 55 We hypothesize that the general rise in the number of electoral institutions has depressed voter turnout around the world. Hypothesis 2:
—H2. The rising number of elective institutions is negatively associated with voter turnout.
In what follows, we conduct two types of empirical analyses. Analysis 1 tests our two hypotheses and the existing explanations on a large comparative data set of post-1945 national elections. Analysis 2 focuses on the generational accounts and tests them against both comparative (cses) and country-specific (British Canadian, and US election studies) survey data. In addition, the final empirical section estimates the contributions of our two key factors to turnout decline by calculating counterfactual voting rates that would be observed today had those factors remained unchanged since the 1960s.
III. Analysis 1
Data and Methods
We built an original data set of all the first rounds of national legislative and presidential electoral contests meeting democratic standardsFootnote 56 that were held from 1945 through 2017, which includes 1,421 elections.Footnote 57 Using this data set, we ran regression analyses in which voter turnout measured as the percentage of registered voters who cast a voteFootnote 58 is the dependent variable. To operationalize the decline in voter turnout, our analyses included decade dummy variables. Including them allows for a nonlinear trend. We expected to reduce the magnitude of these dummies’ coefficients through the inclusion of substantive independent variables. The supplementary material shows that our main results are robust to the inclusion of linear (year) and quadratic (year squared) time trends.Footnote 59
The operationalization of H1 requires a certain level of affluence from which newly born cohorts develop values that are less conducive to electoral participation. We chose the real gross domestic product (gdp) per capita of Great Britain in 1960, equivalent to US $12,000 in 2011, for several reasons.Footnote 60 First, British households experienced a significant improvement in their standards of living in the 1950s. These developments motivated early analyses of value and attitudinal change, such as John Goldthorpe and colleagues’ study, The Affluent Worker. Footnote 61 More generally, around 1960, Great Britain was the most developed large country in western Europe, and it was at the forefront of Europe’s cultural transformation, which in most other European countries started only in the later 1960s or early 1970s.Footnote 62 Second, Harold Clark and colleagues document the existence of the generational divide in voter turnout and civic duty between pre-1960 and post-1960 cohorts using data from the British Election Study.Footnote 63 Third, Maria Grasso and colleagues choose almost the same cut point (1959), and analyzing entirely different data (the annual British Social Attitudes Survey), find similar generational differences in political participation.Footnote 64
The choice of this benchmark implies that in North America, which was largely spared the damage of the Second World War and enjoyed high growth rates in the early 1940s, the value change started significantly earlier (for example, in 1941 in the US) than in Europe. This corresponds well to earlier operationalizations of affluenceFootnote 65 and to the results of available generational studies. With regard to the latter, for example, Warren Miller and Merrill Shanks find that New Deal cohorts, who entered the US electorate before 1964 (that is, were born through the early 1940s), vote at higher rates than post–New Deal cohorts.Footnote 66 In most western European countries, the generational divide starts later, in the 1960s or 1970s.Footnote 67 To estimate the age composition of the electorates, we drew on data from the Population Division of the United Nations,Footnote 68 which covers the 1950–2015 period.Footnote 69 For each election, the resulting variable, affluent generations, indicates the share of cohorts born in or after the country-specific cut yearFootnote 70 (that is, the year in which the real gdp reached the British 1960 level).Footnote 71 The variable varies from 0 to 0.91 (the US in 2014). The supplementary material presents the full descriptive statistics for this and all other variables.Footnote 72
We operationalized H2 through the variable elective institutions, which corresponds to the sum of elective institutions in each country. It considers the presence of the following seven items: transnational elective institution (that is, the European Parliament), head of state, lower chamber of parliament, upper chamber of parliament, regional level of government, local level of government, and nationwide referendum (at least one held in the five previous years). The information comes mostly from the Varieties of Democracy (V-Dem) data setFootnote 73 and the number of institutions varies from one (for example, Czechoslovakia in 1946) to seven (Slovenia after 2000).Footnote 74 The variable was recoded to vary from 0 to 1.
Regarding alternative interpretations, the variables TU membership and party membership operationalize the group mobilization hypothesis. TU membership corresponds to the share of trade union membership in the working population.Footnote 75 We calculated party membership by dividing the membership of the winning party by the size of the total population.Footnote 76 The variable majority status measures the decisiveness of party competition and corresponds to the absolute value of the difference between 50 percent and the vote share of the election winner.Footnote 77 Vote at 18 operationalizes voting-age reform and gives the share of the electorate that became eligible to vote at eighteen years old.Footnote 78 The role of income inequality is explored through the variable gini (disp. income), which corresponds to the Gini index of inequality in household disposable income from the Standardized World Income Inequality Database.Footnote 79 Two variables test the direct and indirect effects of globalization. First, as in John Marshall and Stephen Fisher’s study,Footnote 80 the variable FDI flows measures the volume of foreign direct investment flows.Footnote 81 Second, following Nils Steiner and Christian Martin,Footnote 82 the variable left-right polarization gauges the polarization of party competition. It corresponds to the standard deviation of political parties’ positions on the left-right scaleFootnote 83 in the Manifesto Project data.Footnote 84
In the full model specification, we controlled for the most important macrolevel predictors of voter turnout as identified in the scientific literature.Footnote 85 Voter turnout is higher in countries where voting is compulsory and where electoral compulsion is enforced.Footnote 86 We thus created two dummy variables (compulsory voting and compulsory voting enforced), which we coded as 1, respectively, when voting is required by law and when abstention is sanctioned, at least in rare cases. We included the dummy variable presidential election to allow for variation across election types.Footnote 87 Another dummy variable, concurrent election, takes the value of 1 when presidential and legislative elections are held jointly. This should increase the benefit of voting and consequently boost voter turnout.Footnote 88 In terms of party or candidate competition, another factor to consider in addition to majority status, is closeness, also known as the margin of victory. Our variable closeness corresponds to the difference in vote share between the two parties or candidates winning the most votes. The larger the value of this measure, the less uncertain the election outcome and the lower the voting rate.Footnote 89
In the analyses restricted to legislative elections, we controlled for the possibility that some electoral systems foster participation.Footnote 90 We included dummy variables for proportional, majoritarian, mixed, and other electoral systems (for example, single-transferable-vote systems) as distinguished in the V-Dem data set. Because voter turnout in new democracies may be affected by the processes of democratization and democratic consolidation,Footnote 91 we allowed for specific time trends in new democracies. For mutually exclusive categories of pre-1974, post-1974, and postcommunist new democracies, we coded three democratization variables that range from 15 (first year of democracy) to 0 (the sixteenth year of democracy and after).Footnote 92 We originally controlled for the level of economic development (gdp per capita in 2011 dollars), but the variable was never statistically significant. This is probably due to our inclusion of country dummies (see below) and the restriction of our analysis to countries meeting democratic standards, which tend to be economically developed.Footnote 93 Given that the variable is not available for some country-years, we show the analyses with gdp per capita (entered as both linear and quadratic terms) only in the supplementary material.Footnote 94 These analyses yield the same substantive results as those presented in the next subsection.
The time-series cross-sectional nature of the data requires special care in the specification of regression models, because the results could suffer from unit heterogeneity, autocorrelation, contemporaneous correlation, and nonstationarity.Footnote 95 Concerning unit heterogeneity, we opted for a within model by applying country fixed effects. This is the standard approach in the social sciences.Footnote 96 Moreover, this choice fits particularly well with our research question given that we are interested in over-time change and not in the explanation of cross-national variation in the absolute levels of turnout.Footnote 97 The statistical tests applied to our preferred model (Table 3, model O below) also indicate the presence of serial correlation but not of nonstationarity or contemporaneous correlation.Footnote 98 Because our panels are unbalanced and the data is cross-sectionally dominated, we cluster standard errors by country.Footnote 99 We show in the supplementary material that our results are robust to a range of alternative technical specifications.Footnote 100
Results
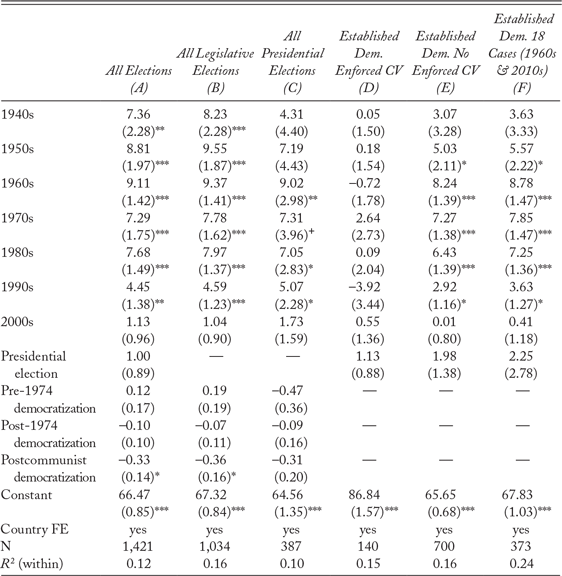
Table 1 presents a general overview of the post-1945 evolution of voting rates. It displays several models that regress voter turnout on decade dummy variables, controlling for election type and for democratization in models that include new democracies. The reference category is elections held since 2010. A positive coefficient associated with a decade dummy variable indicates that turnout was higher in that decade than nowadays. We consider all democratic elections (model A), legislative elections (model B), presidential elections (model C), established democracies with enforced compulsory voting (model D), established democracies without compulsory voting (model E), and eighteen established democracies without compulsory voting that held elections in both the 1960s and the 2010s (model F).Footnote 101 In all cases but one (model D), we observe a clear negative trend in voter turnout. The table demonstrates that the decline in voting is not specific to an election type (see models B and C) and that it is not due to an increase in the number of democratic countries (model F). Conversely, the results of model D show that, when compulsory voting is enforced and voters may be legally prosecuted for abstention, voter turnout remains remarkably stable over time because most citizens vote in all elections. Our research question thus clearly does not apply to countries that enforce compulsory voting, and we remove them from the remaining analyses.Footnote 102
Evolution of Voter Turnout 1945–2017a

+ p < 0.1, *p < 0.05, **p < 0.01, ***p < 0.001; clustered standard errors by country in parentheses
a OLS regression.
To prevent the following analyses from being affected by factors specific to regime change, our study, like many earlier ones, restricts the principal analyses to established democracies.Footnote 103 But we also demonstrate below that our main results hold even in a pooled analysis of established and new democracies that do not enforce compulsory voting (see model R in Table 3 below).
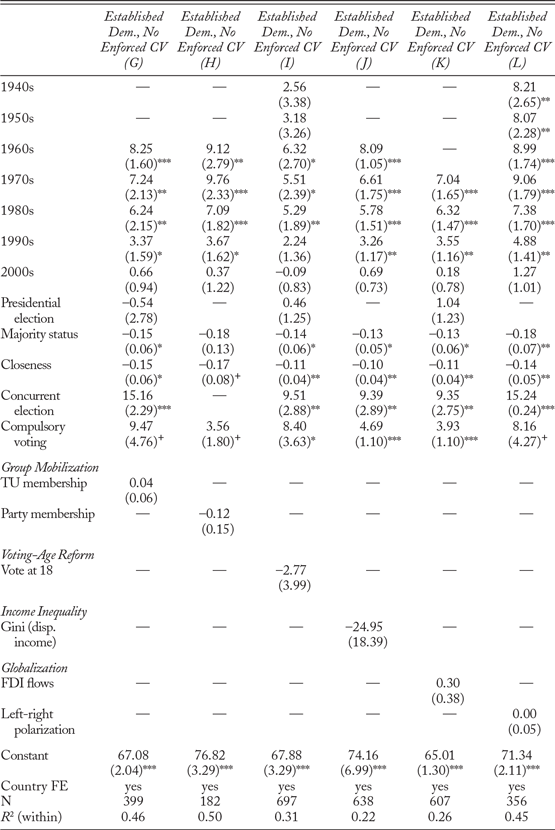
Before testing H1 and H2, in Table 2 we focus on the other explanations of voter decline. All models include the political and institutional controls whose regression coefficients are mostly statistically significant and in the expected direction. Voter turnout is higher when voting is compulsory, even if not enforced, or when presidential and legislative elections are held concurrently. Participation also increases when the gap between the first two competitors diminishes (closeness) or when the winner gets close to the absolute majority (majority status). The latter two variables simultaneously operationalize the party competition hypothesis, but a comparison of the decade dummy variables’ regression coefficients between model E and models G–K demonstrates that, at best, they account for a small share of the decline. The remaining suspects are tested in turn.Footnote 104 Unexpectedly, none receives support from the data. Left-right polarization, party membership, and FDI flows are statistically insignificant and their sign is in the wrong direction. Although TU membership, vote at 18, and Gini (disp. income) have the correct sign, their substantive significance is limited and they do not meet even the most lenient threshold of statistical significance. Clearly, in the present comprehensive data set, there is no evidence that group mobilization, voting-age reform, income inequality, or economic globalization provide the solution to the puzzle of voter decline.
Test of Alternative Explanations for Voter Decline Suggested in the Literature a

+ p < 0.1, *p < 0.05, **p < 0.01, ***p < 0.001; clustered standard errors by country in parentheses; countries with enforced compulsory voting are excluded
a OLS regression.
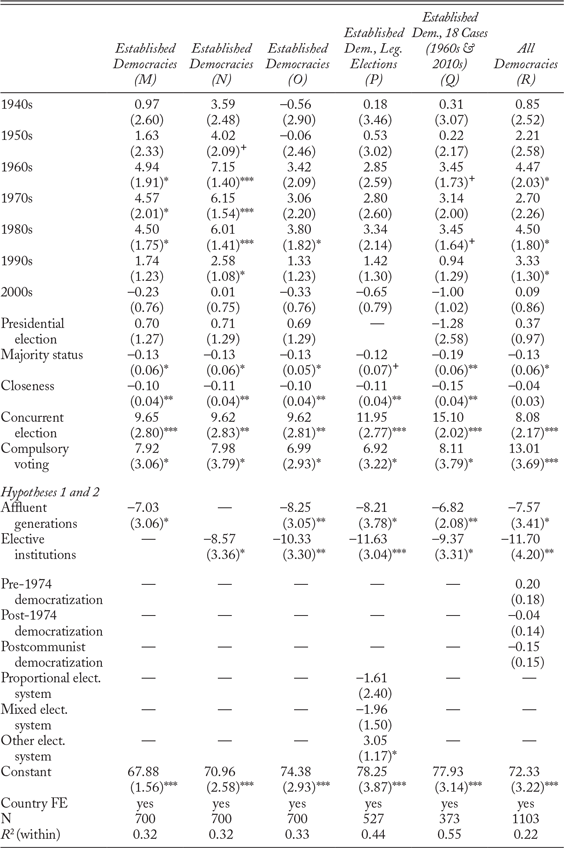
We turn to H1 and H2 in Table 3. Models M–O test the variables affluent generations and elective institutions separately and jointly on the baseline sample of seven hundred elections from model E. Models P–R run additional tests, respectively, on legislative elections, the eighteen stable established democracies from model F, and all elections in both new and old democracies without enforced compulsory voting. In all models, both hypotheses receive strong support from the data. The related variables are statistically and substantively significant and have the correct sign. The larger the share of affluent cohorts or the larger the number of elective institutions, the lower the voter turnout.
Test of Generational and Institutional Changea

+ p < 0.1, *p < 0.05, **p < 0.01, ***p < 0.001; clustered standard errors by country in parentheses; countries with enforced compulsory voting are excluded
a OLS regression.
We present additional analyses in the supplementary material showing that the current results hold when, inter alia, we test finer operationalizations of the elective institutions hypothesis on subsets of our data set, control for per capita gdp and gdp growth, enter different operationalizations of time, use random effects instead of fixed effects, or apply panel-corrected standard errors instead of clustered standard errors.Footnote 105
IV. Analysis 2
Data and Methods
In the second analysis, we study in greater detail the generational explanation. To provide further evidence, we conducted a series of logistic regressions of individual-level voter turnout using several data sets. We mainly employed the four available waves of the cses.Footnote 106 We replicated the key results using long-running national studies. In addition to the existing cumulative data set of the American National Election Study (anes, 1948–2016), we used freshly aggregated data from the British Election Study (bes, 1964–2017) and the Canadian Election Study (ces, 1965–2015).Footnote 107
It is well known that the study of generational effects is fraught with difficulty because of their perfect collinearity with the confounding combination of age and period effects (generation = period – age). This identification problem can be addressed only through theoretically based assumptions.Footnote 108 Following Mikael Persson, Hanna Wass, and Henrik Oscarsson,Footnote 109 we applied a two-level hierarchical model (individuals nested in elections) after reducing the number of levels through country fixed effects.Footnote 110 Our models assume the presence of broad generational groups identified through dummy variables. Altogether, we tested three generational schemes. The first scheme operationalizes H1 through the dummy variable affluent generations, which identifies individuals who were born after their country reached the real GDP of US(2011) $12,000. The second scheme tests the voting age hypothesis. The dummy variable vote at 18 codes as 1 those respondents who became eligible to vote at age eighteen. The third scheme delves into generational differences independent of economic development and voting age. It adopts the Pew Research Center’s taxonomy,Footnote 111 distinguishing among the silent generation (respondents born before 1946), baby boomers (born 1946–64), generation X (born 1965–80), and millennials (born 1981–96), who serve as the reference category. Although these labels draw on the US experience, the periodization largely reflects global events (for example, the end of the Second World War and the cultural revolts in the 1960s), and the scheme is routinely used overseas.Footnote 112 Our theory implies that the first scheme (affluent generations) provides the most powerful explanation.
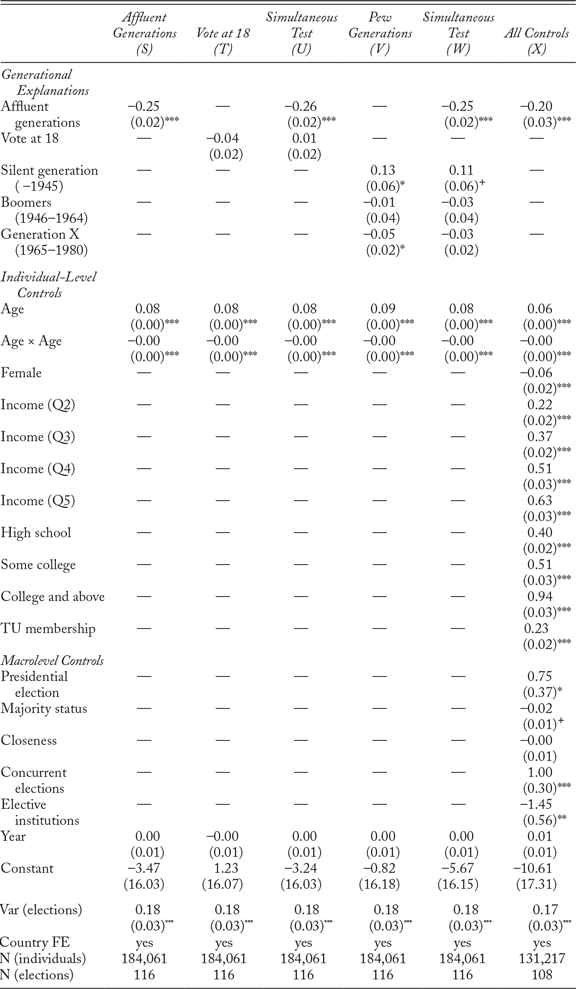
All models control for a quadratic function of age in years (that is, age effects) and the year of the survey (to operationalize the time trend), and all employ election-specific random intercepts to account for the context of each election (that is, period effects). In addition, although we are primarily interested in the unconditional effects of generational change,Footnote 113 one model specification includes individual-level and macrolevel controls. The individual-level controls comprise dummy variables for gender (reference category male), education (primary), income (quintile 1), and trade union membership (not member). The macrolevel controls are all the control variables from analysis 1 and the elective institutions variable.Footnote 114 If H1 is valid and the generational differences are driven by a changing value structure, these controls should not significantly diminish the effect of the generational variables.
Results
Table 4 displays six regression models of the cses data. Models S, T, and V test H1, the voting age hypothesis (vote at 18), and the Pew-based scheme, respectively. Models U and W conduct simultaneous tests, and model X includes the controls and elective institutions. The regression coefficient of affluent generations is substantively and statistically significant and of a similar magnitude in all model specifications.Footnote 115 Likewise, elective institutions yields the expected negative regression coefficient, which provides additional support for H2. By contrast, vote at 18 and the Pew-based scheme yield statistically and substantively insignificant coefficients, especially when entered jointly with affluent generations. In the rest of the analysis, we thus focus on H1.
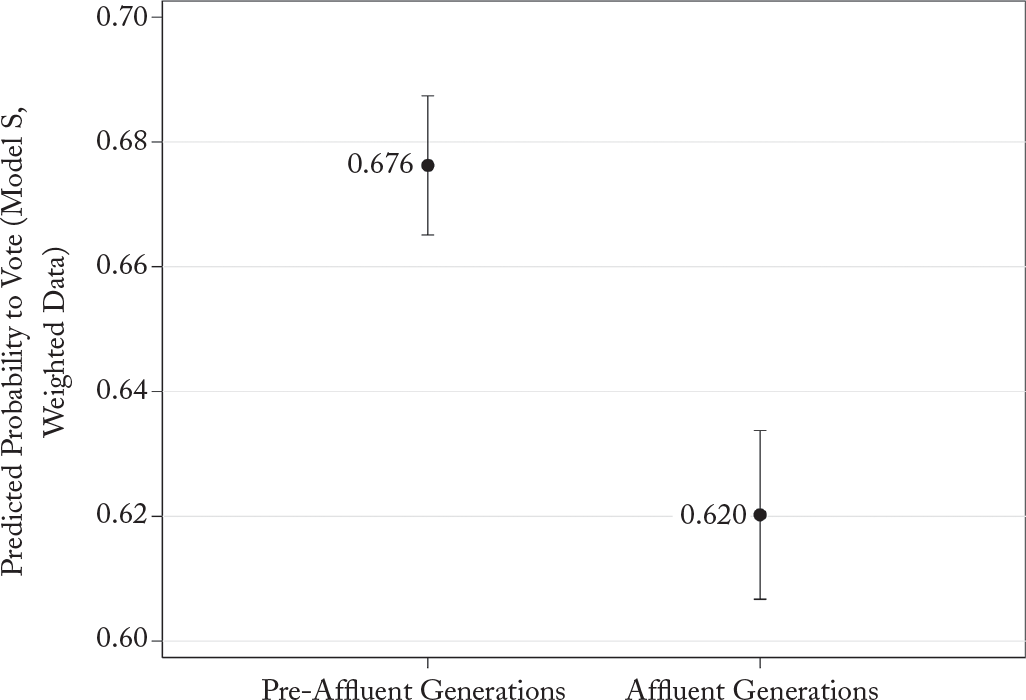
Figure 2 illustrates the substantive significance of affluent generations. It shows the predicted probability to vote based on model S from Table 4.Footnote 116 The difference between affluent generations and their elders amounts to nearly six percentage points. Interestingly, this magnitude is close to what we observed in the macroanalysis of elections (analysis 1), where the coefficient of affluent generations oscillated around seven percentage points. Of course, these estimates correspond to the potential maximal effects of generational replacement and not to the amount of the decline in voter turnout that generation effects account for. This amount is properly estimated in the next section. But we first further examine the empirical evidence on H1.
Generational Difference in the Probability to Vote (CSES Data)

Individual-Level Analysis (CSES Data) a

+ p < 0.1, *p < 0.05, **p < 0.01, ***p < 0.001; standard errors in parentheses; countries with enforced compulsory voting are excluded
a Data from Comparative Study of Electoral Systems 2020, waves 1—4. Hierarchical logistic regression with random intercepts for elections and country fixed effects.
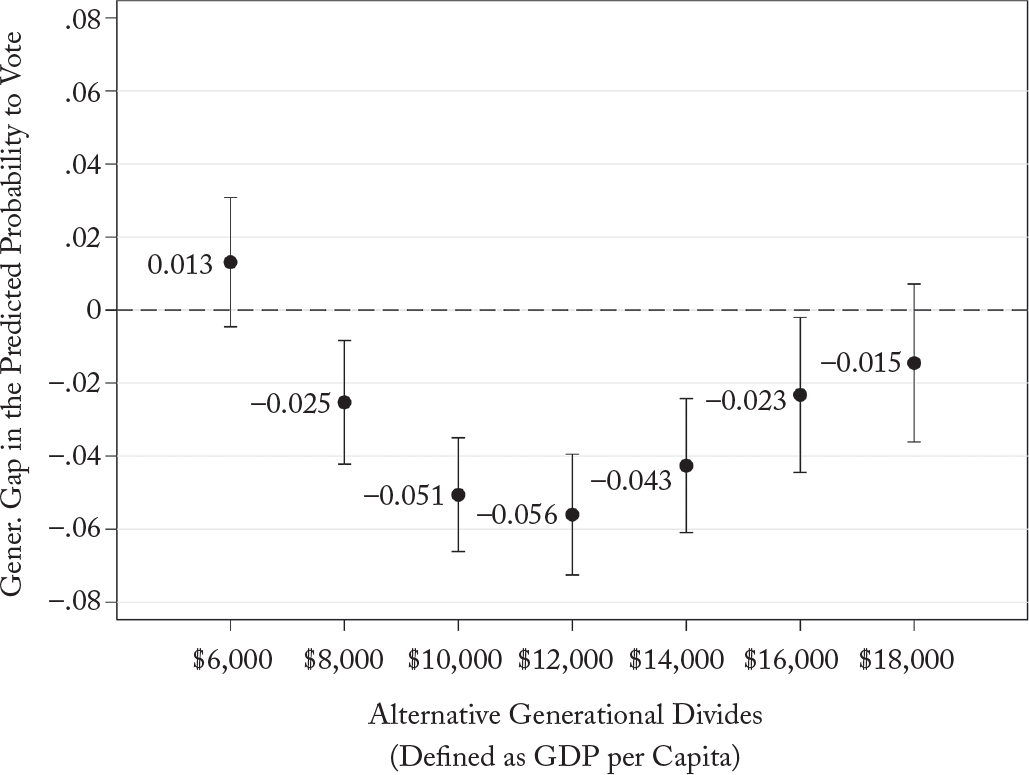
To minimize the risk that the result from model S is based on random noise and to check the appropriateness of the US $12,000 benchmark, we replicated the analysis using alternative thresholds of economic affluence (also in US 2011 dollars) ranging from $6,000 to $18,000. If H1 is correct and there is a generational divide around $12,000, the coefficient of affluent generations should decline if lower or higher thresholds are chosen.Footnote 117 This is exactly what Figure 3 shows. The substantive significance of the regression coefficient gradually rises as the value of the threshold approaches $12,000, where the coefficient reaches its maximum. The theory-based choice of the $12,000 benchmark is thus correct. But had we chosen any other value between $10,000 and $14,000, we would observe similar, albeit slightly weaker results. Clearly, there is a robust relationship between being born in a context of relative affluence and the propensity to abstain from voting.
Generational Differences (CSES Data), Alternative Thresholds

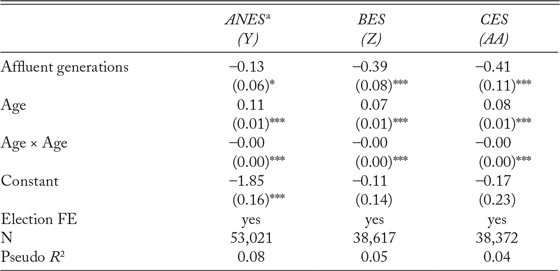
To further test the robustness of our findings, we replicated model S using the anes, bes, and ces data sets, which, inter alia, have the advantage of covering much longer time spans.Footnote 118 Table 5 shows that in all three cases, the affluent generations variable has the expected sign and is substantively and statistically significant. In terms of predicted probability to vote, there is a generational gap of 3.1, 7.6, and 8.5 percentage points in the US, British, and Canadian national elections, respectively. In those countries, generational replacement thus may account for most of the decline at the aggregated level, which amounts to 3.6 percentage points in US presidential elections, 9.3 percentage points in British legislative elections, and 11.2 percentage points in Canadian legislative elections.Footnote 119 These results provide further support for H1.
Individual-Level Analysis (National Election Studies)

*p < 0.05, ***p < 0.001; single-level logistic regressions with election fixed effects and clustered standard errors by election in parentheses.
a American National Election Study (1948–2016), British Election Study (1964–2017), and Canadian Election Study (1965–2015), respectively.
V. Quantifying the Sources of Decline
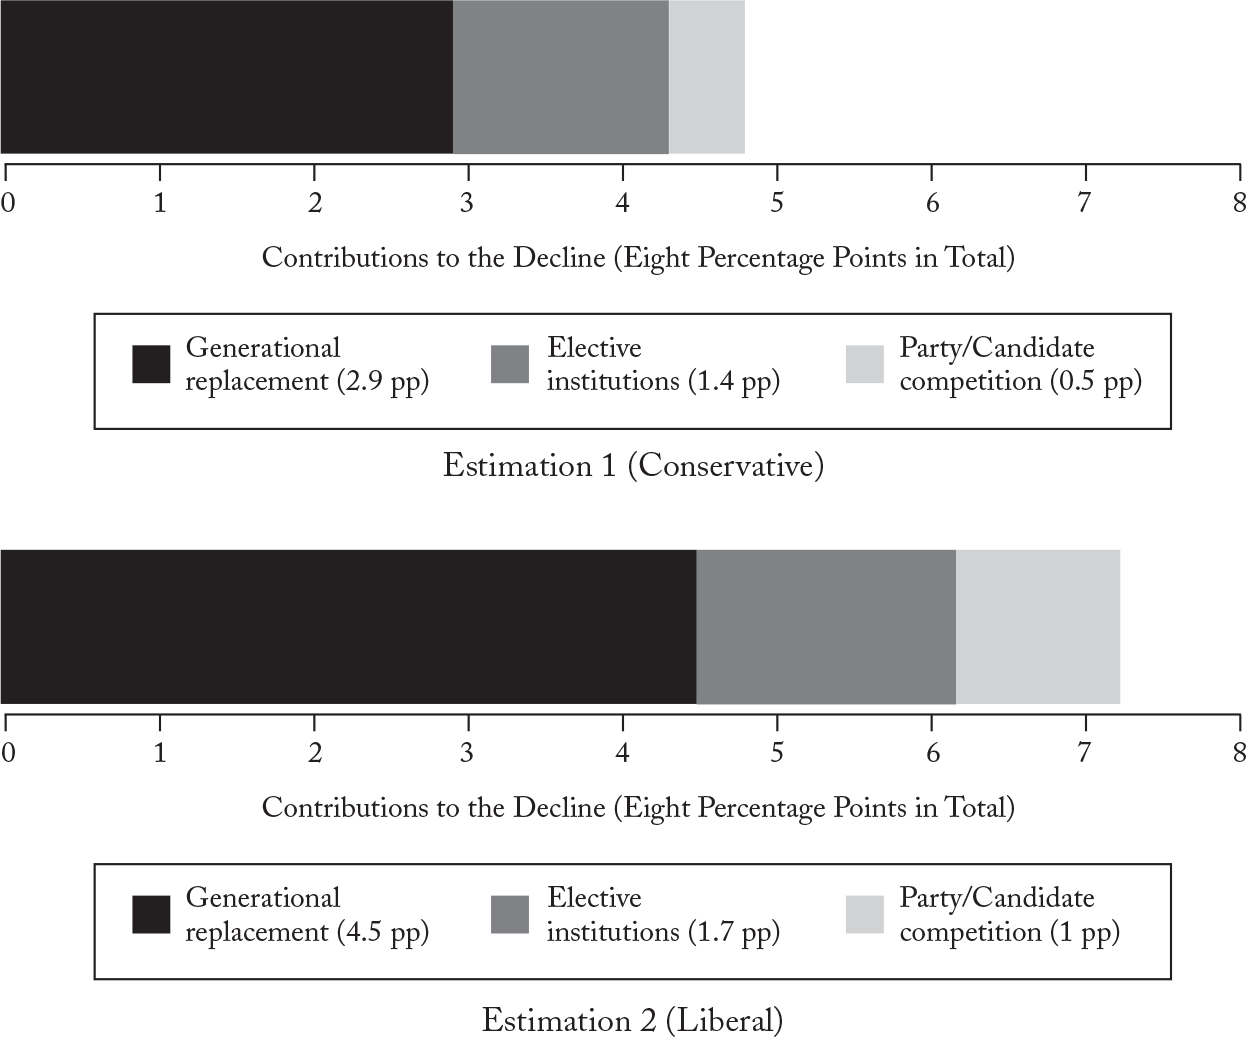
Analyses 1 and 2 provide evidence for H1 and H2. But they do not indicate how much of the observed decline these hypotheses explain. To study that, we moved back to the aggregated level (analysis 1) and focused on the eighteen countries that conducted democratic elections in both the 1960s and the 2010s. In them, voter turnout declined by eight points.Footnote 120 We estimated how voter turnout would change if in the 2010s, the independent variables included in the full regression model (Table 3, model Q) took the values from the 1960s.Footnote 121 We provide two estimations. The first is conservative, as it is based on model Q, which includes decade dummy variables. Their inclusion controls for the time trend, which eliminates the risk of a spurious correlation but simultaneously may absorb some of the explanatory power of the substantive variables. For the other, liberal estimation, we replicated model Q without the decade dummy variables in the regression analysis. Doing so gives more leeway to the substantive variables but, of course, runs the risk of spuriousness in some of the explained variance.
The conservative and liberal estimations are displayed in Figure 4. In both cases, the largest contribution to the decline in turnout (2.9 and 4.5 percentage points, respectively) stems from generational replacement, the share of affluent cohorts having increased from 0 to 0.44 on average from the 1960s to the 2010s. Reforms relative to elective institutions, including fewer concurrent elections, come second (1.4 and 1.7 percentage points, respectively),Footnote 122 followed by party/candidate competition (0.5 and 1 percentage points, respectively).Footnote 123 Although the decline is clearly multicausal in nature, generational replacement appears to be the most powerful factor. Altogether, the two estimations amount to 4.8 and 7.2 percentage points, respectively, which means that the present model accounts for between 60 percent and 90 percent of the total 8-percentage-point decline. These estimations suggest that our two hypotheses jointly explain a substantial part of the global decline in voter turnout.
Contributions to the 1960s–2010s Decline in Eighteen Established Electoral Democraciesa
aThe eighteen included countries that held democratic elections without enforced compulsory voting in the 1960s and 2010s are Canada, Costa Rica, Denmark, Finland, France, Germany, India, Ireland, Israel, Italy, Japan, New Zealand, Norway, Sri Lanka, Sweden, Turkey, the United Kingdom, and the United States. The conservative estimation draws on regression model Q from Table 3. The liberal estimation employs a replication of model Q that omits decade dummy variables.

VI. Discussion
We have investigated causes of the global decline in voter turnout in democracies. For this investigation, we built a data set of more than fourteen hundred national democratic elections held from 1945 to 2017, and combined this aggregate analysis with an examination of individual survey data, both cross-nationally (cses) and longitudinally (Britain, Canada, and the United States). Our results provide no support for the detrimental effects of economic globalization or weakened group mobilization. Nor do we find that lowering the voting age substantially contributed to the decline. Among the prominent explanations advanced in prior macroanalyses, only the role of majority status in party competition is partly supported. But shifts in majority status are responsible for only a small share of the decline and are largely compensated for by today’s more competitive elections. Instead, we find that most of the decline comes from two sources, one cultural and one institutional.
The generational replacement explanation trumps all other accounts. Although the presented evidence is correlational, there are several reasons for being fairly confident about this finding. First, it holds across a large variety of model specifications in the macroanalysis for various subsamples of electoral democracies and in the presence of alternative time indicators or more generic variables (per capita GDP, for example). Second, this finding matches the evidence on generational differences in voting rates from a number of recent microlevel longitudinal studies—panels and rolling cross-sections—that we discuss in the theory section above. Third, our own generational analysis of individual-level data, which allows for a close inspection of the generational divide, fully corroborates the distinction between affluent cohorts and their older counterparts. Fourth, the patterns of participation that we observe at the macro- and microlevels are consistent with the expectation of less duty-based citizenship as described in the literature on value change.Footnote 124
Another explanation that is consistently supported in our analysis is the rise in the number of elective institutions. Although this factor’s contribution is relatively modest compared to that of generational replacement, it is still more than twice as large as the contribution of party competition. And while this factor has been largely absent in other accounts of the global decline, our finding empirically supports widely held views about the reasons for exceptionally low voter turnout in the United States and Switzerland, and it matches evidence from a number of geographically circumscribed analyses.
The present findings support the existence of an ongoing profound transformation in participation trends in electoral democracies. This transformation is not yet over. Even in countries that reached the age of affluence early on, such as the United States and Canada, affluent cohorts still do not represent the entirety of their respective electorates. Unless offset by other factors, generational replacement may thus further reduce participation rates in the years to come.Footnote 125 These findings support some of the central claims of the literature on value change and invite further research into the underlying mechanisms through which economic development affects citizens’ sense of civic duty and other relevant values and attitudes.
Supplementary Material
Supplementary material for this article can be found at https://doi.org/10.1017/S0043887121000149.
Data
Replication files for this article can be found at https://doi.org/10.7910/DVN/UMWLMB.
Acknowledgments
We would like to thank Damien Bol, Ruth Dassonneville, Jean-François Daoust, Anja Durovic, Robert Johns, Ian McAllister, Shane P Singh, Dietlind Stolle, Vincent Tiberj, and the World Politics editors and reviewers for their insightful comments on earlier drafts of this article.
Authors
Filip Kostelka is a lecturer in the Department of Government at the University of Essex. Starting in 2022, he will hold the Chair in Social and Political Change at the European University Institute. He is particularly interested in political behavior, party politics, and regime change. He can be reached at filip.kostelka@essex.ac.uk.
André Blais is a professor in the Department of Political Science at the University of Montreal, where he holds a research chair in electoral studies. He was a coinvestigator of the Canadian Election Study from 1988 to 1993 and the principal investigator from 1997 to 2006. His research interests are elections, turnout and voting, electoral systems, and public opinion. He can be reached at andre.blais@umontreal.ca.