Implications
Water buffalo is widely diffused in Asia, South America, Southern Europe, North Africa and Australia. In Italy it is a species of great economic importance for the production chain of typical, high-quality milk-derived products. Gene expression based approaches are useful research tools in several studies directed to elucidate wide range of aspects in animal physiology and pathology.
Introduction
Real-time reverse transcription PCR (RT-PCR) is now considered a ‘gold standard’ for quantification of mRNA and is therefore extensively used for gene expression evaluation in biological, biomedical and veterinary research (Ding and Cantor, Reference Ding and Cantor2004), however, there are several technical concerns that have a strong impact on the assay (Nolan et al., Reference Nolan, Hands and Bustin2006). Pre-analytical steps, like sampling technologies, nucleic acid extraction and purification and RT, together with normalization, optimization, standardization of qPCR reaction and data analysis are all critical steps to generate quantitative data that are reliable and reproducible. A key step to obtain informative results from RT qPCR assay is the data normalization (Bustin, Reference Bustin2002; Lee et al., Reference Lee, Sladek, Greenwood and Hudson2002; Pfaffl, Reference Pfaffl2001) that means to correct results against a reference gene transcript. In several organisms, it has become clear that no single gene is constitutively expressed in all cell types and under all experimental conditions, implying that the use of single housekeepers for normalization cannot guarantee unbiased results (Schmittgen and Zakrajsek, Reference Schmittgen and Zakrajsek2000; Nicot et al., Reference Nicot, Hausman, Hoffmann and Evers2005). However, the finding of an appropriate panel of reference genes for data normalization is a challenging problem (Kubista et al., Reference Kubista, Andrade, Bengtsson, Forootan, Jonák, Lind, Sindelka, Sjőback, Sjőgreen, Strőmbom, Ståhlberg and Zoric2006) and up to now these genes were selected from conventionally used ones or adapted from the literature (Radonić et al., Reference Radonić, Thulke, Mackay, Landt, Siegert and Nitsche2004; Huggett et al., Reference Huggett, Dheda, Bustin and Zumla2005) or starting from microarray data (Abruzzo et al., Reference Abruzzo, Lee, Fuller, Silverman, Keating, Medeiros and Coombes2005). In plants, internal controls for normalization have been identified in Arabidopsis (Czechowski et al., Reference Czechowski, Stitt, Altmann, Udvardi and Scheible2005) by a genome-wide screening, revealing that there are many genes other than the ones traditionally used that are more stably expressed. Starting from the idea to expand the panel of available potential reference genes, Faccioli et al. (Reference Faccioli, Ciceri, Provero, Stanca, Morcia and Terzi2007) have reported an ‘in silico’ approach based on the use of Expressed Sequence Tag (EST) data for an agile identification of reference genes suitable for normalization in plant gene expression studies. In this work, we have applied the same ‘in silico’ approach, followed by laboratory validation steps, with the aim to identify candidate reference genes in river buffalo (Bubalus bubalis), an animal species of great economic importance in Italy for the production chain of protected designation of origin products like Mozzarella di Bufala Campana (stretched curd cheese) and ricotta (whey cheese) (European Community Regulation numbers 2037/1993, 107/1996, 2301/1997). The rationale of the applied procedure is based on the fact that reference genes are expressed across a variety of tissues and/or biological conditions. Therefore, if we select those transcripts that are present in a remarkable number of different cDNA libraries we should be able to identify potentially reference genes, constitutively expressed in a wide range of different tissues, organs and physiological conditions. To do this, we have focused the attention on ESTs derived from cDNA libraries of Bos taurus prepared from different tissues and physiological conditions and collected in the TIGR Gene Indices (http://compbio.dfci.harvard.edu/tgi/) database. These Indices are public EST-based species-specific databases, constructed by first clustering, then assembling ESTs and annotated gene sequences resulting in a set of unique, high-fidelity virtual transcript (Tentative Consensus (TC)). The use of an ESTs database from Bos taurus is justified by the absence of such database for Bubalus bubalis and by comparative genomic studies that have demonstrated the usefulness of genomic tools developed for cattle when applied to related species like water buffaloes (Ritz et al., Reference Ritz, Glowatzki-Mullis, MacHugh and Gaillard2000; Navani et al., Reference Navani, Jain, Gupta and Sisodia2002; Stafuzza et al., Reference Stafuzza, Ianella, Miziana, Agarwala, Schäffer, Riggs, Womack and Amaral2007).
Material and methods
In silico selection of candidate reference genes
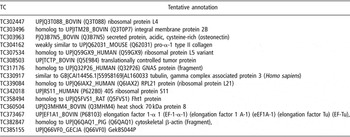
A publicly available Bos taurus ESTs database has been downloaded and mined by some simple frequency algorithms to find out which TCs are present in a remarkable number of different cDNA libraries and, consequently, more suitable to be included in a starter set of candidate reference genes. More in details, the TIGR Cattle Gene Index (BtGI), Release 12.0 (http://compbio.dfci.harvard.edu/tgi/cgi-bin/tgi/T_release.pl?gudb=cattle) was screened with a Pyton-based script to find out the TCs present in a remarkable number of different libraries and to order them on the basis of their frequency (number of hosting libraries/total number of libraries). The 15 most frequent TCs (listed in Table 1, with their tentative annotations) have been selected for further evaluation.
List of the TCs studied with their tentative annotation. TC numbers and their annotation are referred to TIGR Cattle Gene Index (BtGI), Release 12.0

TC = tentative consensus.
Animal samples
In the first step of the work, samples of liver, spleen, kidney, heart, skeletal muscle, lymph node, udder and lung were removed from two buffaloes, randomly selected in a slaughterhouse. In a second step, samples of liver, kidney, skeletal muscle, lymph node, udder and lung were removed from six buffaloes, randomly selected in a slaughterhouse.
The samples were placed in clean nylon bags in ice and then immediately transferred to the sampling laboratory. Slaughter and sampling rooms were close but distinct to avoid possible contamination. For the same reason, the outmost layer of tissue from each organ was removed to sample the inner part. Three aliquots (25 mg each) from each sample were immediately stored in liquid nitrogen and subsequently stored at −80°C until use for RNA extraction.
During the sampling procedure special care was taken to avoid accidental contamination from the environment and to ensure low temperature conditions. The working place was carefully cleaned with a 5% hypochlorite solution in sterile water. Disposable gloves were changed between each organ sampling.
Extraction and quantitation of RNA
Total RNA was isolated from samples using Trizol (Invitrogen, CA, USA), according to manufacturer instructions. The resulting RNAs were purified using Qiagen RNeasy columns (Qiagen GmbH, Hilden, Germany) following the RNA cleanup protocol. The purified RNAs were quantified by standard optical density measurement and the results were also verified using RyboGreen dye (Molecular Probes Inc., Eugene, OR, USA) in a fluorescent-based solution assay (Jones et al., Reference Jones, Yue, Cheung and Singer1998), according to manufacturer protocol. The quality and quantity of RNAs were further evaluated with the 2100 Bioanalyzer instrument (Agilent Technologies, Santa Clara, CA, USA), based on microcapillary electrophoresis. With this technology, electropherograms and gel-like images can be visually evaluated and an expert software can generate an RNA integrity number (RIN), a user-independent assessment of RNA integrity. The mean RIN obtained for all extracted samples was of 7.1 ± 0.9. This value is higher than 6, the threshold for high and low quality RNA defined by Schroeder et al. (Reference Schroeder, Mueller, Stocker, Salowsky, Leiber, Gassmann, Lightfoot, Menzel, Granzow and Ragg2006).
RNA RT and real-time PCR
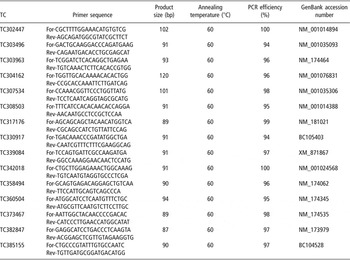
Total RNA samples were reverse transcribed in triplicate following the TaqMan One step RT-PCR protocol (Applied Biosystems, Foster City, CA, USA). Briefly, 100 ng of purified RNA with 0.25 U/ml MultiScribe Reverse Transcriptase (Applied Biosystems), 0.4 U/ml Rnase Inhibitor (Applied Biosystems), 150 nM forward and 150 nM reverse primers in a 50 μl final volume of SYBR Green PCR Master Mix 1X (Applied Biosystems) were subjected to the following thermal profile: one step at 48°C for 30 min, one step at 95°C for 10 min, 40 cycles with a denaturation step at 95°C for 15 s and an annealing/extension step at 60°C for 1 min. PCRs were performed in the PE Biosystems GeneAmp 7300 Sequence Detection System (Applied Biosystems) using MicroAmp optical tubes and caps. Primers design was done with Primer Express version 2.0 software (Applied Biosystems) and then after the assays were optimized and evaluated for specific product amplification. Primer sequences used in real-time RT-PCR are listed in Table 2. To evaluate the specificity of the amplified products two strategies were adopted. The reactions were in fact subjected to a heat dissociation protocol present in the PE Biosystems 7300 software for PCR product validation through melting curve analysis and detection of non-specific amplifications: at the end of the final PCR cycle, the amplification products were heat denatured over a 35°C temperature gradient at 0.03°C/s from 60°C to 95°C. A negative control without template was run with every assay to assess the overall specificity. The identities of PCR products were further confirmed by sequencing and annotation. The amplification products obtained were purified with Wizard® PCR Preps DNA Purification System (Promega, Madison, WI, USA) and then sequenced with the Big Dye® Terminator Cycle Sequencing Kit (Applied Biosystems) on the ABI PRISM® 3100 Genetic Analyzer (Applied Biosystems). Similarities with all the sequences in the international nucleotide non-redundant data banks and with sequences from EST division were detected using the BLAST program on network servers.
In the table for each TC, primer sequence, amplicon size, annealing temperature, PCR efficiency and GenBank accession number are reported

TC = tentative consensus; For = forward; Rev = reverse.
Real-Time PCR: data analysis
GenEx Ver.4.3 (Multid Analyses AB, Lotsgatan 5A, Gothenburg, Sweden; www.multid.se), including geNorm and NormFinder software packages, was used to manage the RT Real-Time PCR data entered as cycle threshold values.
Results and Discussion
Table 1 reports the list of the TCs, whose expression in buffalo tissues was studied in this work. These TCs are included in TIGR Cattle Gene Index, a publicly available database developed by the Institute for Genomic Research (Rockville, MD, USA) that collects ESTs, partial, single-pass sequences from either end of a cDNA clone. The current version of Cattle Gene Index includes 1051687 ESTs from several cDNA libraries developed by international Bos taurus EST sequencing and gene research projects. From the assembling of these ESTs into virtual transcripts, 90392 TC sequences have been created. With the aim to screen for reference genes in water buffalo, we have ordered all the TCs according to their frequency, calculated as number of hosting libraries/total number of libraries included in TIGR Cattle Gene Index. Taking into account the most frequent ones, we have identified a panel of 15 TCs. With this selection procedure genes that are expressed in several tissues, organs and conditions have been identified, responding to the requirement that a maintenance gene must be constitutively expressed to ensure cellular function (Warrington et al., Reference Warrington, Nair, Mahadevappa and Tsyganskaya2000).
To evaluate the potential of such candidates for their use as normalizers in buffalo gene expression analysis, a two-step laboratory bench-based test has been carried out, in which the expression stability of all the TCs are reported in Table 1 and has been evaluated on a panel of RNA samples extracted from tissues or organs. The specificity of the amplified products in each RT qPCR reaction was guaranteed by the absence of multiple peaks in melt curve analysis and by the sequencing step of the amplified products, followed by annotation.
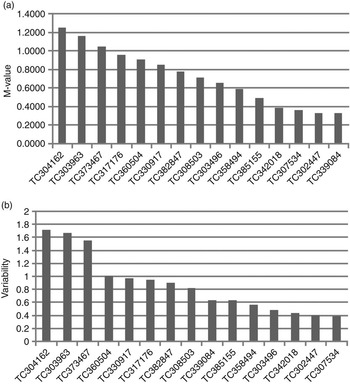
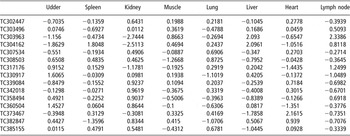
In a first screening step, the expression levels of the 15 TCs were determined in RNA samples extracted from liver, spleen, kidney, heart, skeletal muscle, lymph node, udder and lung of two animals randomly selected in a slaughterhouse. Data have been evaluated by both geNorm and NormFinder softwares (Vandesompele et al., Reference Vandesompele, De Praeter, Pattyn, Poppe, Van Roy, De Paepe and Speleman2002; Andersen et al., Reference Andersen, Jensen and Ørntaft2004) and graphically reported in Figure 1 for the whole set of examined tissues. Both softwares indicate TC302447 and TC339084 as the most suitable genes for data normalization. Moreover, NormFinder analysis was applied to evaluate differences in the expression stability of the TCs among the tissues. In Table 3 for each TC the intergroup variation is reported that reflects the stability of the gene among different tissues.
Expression stability of 15 TCs in eight different tissues from two animals. (a) M-value; (b) variability. The results of geNorm analysis to select the best reference genes suitable for buffalo gene expression studies are reported in panel a. This applet provides a measure of gene expression stability (M), which is the mean pair-wise variation between an individual gene and all other tested genes. In y axis are reported these M-values. In the y axis of panel b the variability for stability values (V-values) of the tested genes calculated by NormFinder comparing the individual genes is plotted against the TCs.

Stability of TCs expressions in different tissues expressed as intergroup variation calculated with NormFinder

TCs = tentative consensuses.
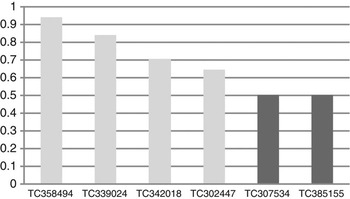
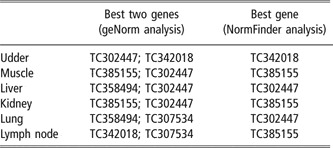
In the second step of the laboratory bench test, a subset of six genes, identified in the screening step as the most stable (TC339084, TC302447, TC307534, TC342018, TC385155, TC358494), were validated on a second set of RNAs (two biological replicates) extracted from six tissues and organs (liver, kidney, skeletal muscle, lymph node, udder, lung) of six animals, randomly selected in the slaughterhouse. The resulting data (Figure 2) demonstrated that TC385155 (Gek protein), TC 307534 (ribosomal protein L5) and TC 302447 (ribosomal protein L4) are the most stable genes when the whole set of tissues is considered. When NormFinder analysis is applied to our data grouped into classes corresponding to the tissues, TC302447 is the most stable gene, whereas TC342018 and TC385155 is the optimum pair. Among different animals, the less variable gene is TC302447 and the optimum pair is TC302447 and TC385155. Moreover, the analysis applied to single tissue data gives suggestions on the preferential use of specific TCs for each examined tissue, as reported in Table 4.
Expression stability of six TCs in six different tissues from six animals. In y axis are reported the M-values calculated with geNorm analysis.

Most stable pair of genes/single gene in the indicated tissues after data analysis with geNorm and NormFinder

TC = tentative consensus.
Genes that show the lowest level of variability both in screening and in validation steps encode for ribosome components, like ribosomal protein L4 (TC302447) and ribosomal protein L5 (TC307534). The use of genes encoding for ribosomal proteins as reference has a long history of use in Northern blot experiments, in which mRNA data are usually presented as arbitrary units of the ratio of a target RNA over levels of a control RNA. However, Hocquette and Brandstetter (Reference Hocquette and Brandstetter2002) have demonstrated that for data normalization in several molecular biology techniques, like Northern blot analysis, semi-quantitative and real-time PCR, a regression-based approach for quantifying mRNA levels relatively to a control RNA species must be preferred. Genes encoding for ribosomal proteins have been suggested as reference by Ayers et al. (Reference Ayers, Clemens, Salway and Day2007) for canine articular connective tissues, by Garcia-Crespo et al. (Reference Garcia-Crespo, Juste and Hurtado2005) for ovine lymph node, by Goossens et al. (Reference Goossens, Van Poucke, Van Soom, Vandesompele, Van Zeveren and Peelman2005) for bovine embryos, by Donaldson et al. (Reference Donaldson, Vuocolo, Gray, Strandberg, Reverter, McWilliam, Wang, Byrne and Tellam2005) for mitogen-stimulated bovine cells, by Bionaz and Loor (Reference Bionaz and Loor2007) for bovine mammary gland and by Janovick-Guretzy et al. (Reference Janovick-Guretzy, Dann, Carlson, Murphy, Loor and Drackley2007) for bovine liver. Recently, Aswal et al. (Reference Aswal, Datta, Raghav, De, Yadav and Goswani2007) evaluated with a semi-quantitative RT-PCR procedure the expression stability of 18s rRNA during the in vitro maturation of buffalo follicular oocytes. In this experimental system, the expression stability pattern of this gene was found superior than that of glyceraldehyde-3-phosphate dehydrogenase, a gene frequently used as endogenous control for quantitative RNA analysis (Aswal et al., Reference Aswal, Raghav, De, Yadav, Thakur, Goswani and Datta2008). On the contrary, RPL0 (acidic ribosomal protein large) encoding gene was found unsuitable as reference for bovine blood samples derived from both healthy and Boophilus microplus infected animals (Robinson et al., Reference Robinson, Sutherland and Sutherland2007).
Besides ribosomal protein encoding sequences, our list of TCs includes some well-described housekeeping genes, like TC382847, encoding for β-actin; TC330917, encoding for tubulin; TC360504, encoding for HSP70 and TC373467 and elongation factor 1α1. All these sequences show middle level of stability. β-actin and elongation factor α are used as control genes in the Affymetrix GeneChip Bovine Genome Array, specifically designed to monitor expression of more than 23 000 bovine transcripts. Moreover, in bovine, actin expression stability has been evaluated in embryos (Goossens et al., Reference Goossens, Van Poucke, Van Soom, Vandesompele, Van Zeveren and Peelman2005), in mammary gland (Bionaz and Loor, Reference Bionaz and Loor2007), in oocyte (Bettegowda et al., Reference Bettegowda, Patel, Ireland and Smith2006), in polymorphonuclear lymphocyte (De Ketelaere et al., Reference De Ketelaere, Goossens, Peelman and Burvenich2006), in liver (Janovick-Guretzy et al., Reference Janovick-Guretzy, Dann, Carlson, Murphy, Loor and Drackley2007), in blood of healthy and diseased animals (Robinson et al., Reference Robinson, Sutherland and Sutherland2007). The importance of using multiple control genes for normalization has been demonstrated in bovine liver, kidney, pituitary and thyroid by Lisowski et al. (Reference Lisowski, Pierzchala, Goscik, Pareek and Zweirzchowski2008).
Low-expression variability level has been shown in our experiments by some TCs encoding for genes never used as reference in cattle, like TC385155, encoding for Gek protein; TC303496, homolog to integral membrane protein, TC308503, encoding for TCTP and TC358494, homolog to Fht1. The least stability in expression has been attributed by both softwares to TC304162 (weakly similar to pro-α-1 type II collagen) and to TC303963 (encoding for osteonectin).
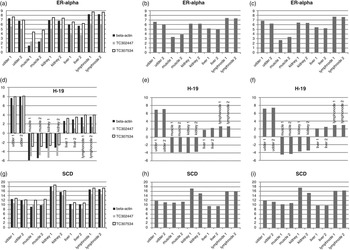
As additional data, the two sequences TC302447 and TC307534, encoding for ribosomal proteins and showing very low level of variability both in screening and in validation steps, were selected and used as normalizers in comparison with the common reference gene β-actin (Feng et al., Reference Feng, Salter, Parr and Gransworthy2007). The relative mRNA abundance of three genes encoding for estrogen receptor α (ERα) (Pfaffl et al., Reference Pfaffl, Lange, Daxenberger and Meyer2001), H19 (Khatib and Schutzkus, Reference Khatib and Schutzkus2006) and stearoyl-CoA desaturase (SCD) (Feng et al., Reference Feng, Salter, Parr and Gransworthy2007) were quantified in five buffalo tissues (udder, skeletal muscle, kidney, liver and lymph node) after normalization to TC302447, TC307534 and β-actin individually (Figure 3a, d and g) or in combination of two (Figure 3b, e and h) or three genes (Figure 3c, f and i). The normalization steps with multiple controls ensure that the wide ranges of variations shown by ER-α, H19 and SCD in the different tissues are reliable. The results obtained strongly support the normalization through geometric averages of two or three reference genes selected among the TCs validated.
In the figure are reported the expression levels of estrogen receptor (ER-α) (Pfaffl et al., Reference Pfaffl, Lange, Daxenberger and Meyer2001), H19 (Khatib and Schutzkus, Reference Khatib and Schutzkus2006) and stearoyl-CoA desaturase (SCD) (Feng et al., Reference Feng, Salter, Parr and Gransworthy2007) genes in buffalo tissues after normalization to single or to multiple genes. (a), (b) and (g) are reported the values for ER-α, H-19 and SCD after normalization to single reference genes (β-actin or TC302447 or TC307534); (b), (e) and (h) are reported the values for ER-α, H-19 and SCD after normalization to TC302447 + TC307534; (c), (f) and (i) are reported the values for ER-α, H-19 and SCD after normalization to TC302447 + TC307534 + β-actin. The normalization was done with GenEx software using the equation: CTGOI,norm = CTGOI − 1/n Σ CTRG

In conclusion, in this work a set of reference genes suitable for real-time qPCR data normalization in several tissues of water buffalo has been individuated and validated.
Acknowledgements
This work was supported by ‘BURAFOCOBANIMIC’ (MiPAAF) project.