1 Introduction
The widespread successes of deep reinforcement learning (deep RL) have brought a resurgence in using deep neural networks for RL tasks. Using a deep neural network as its function approximator, deep RL can learn state representations directly from raw input pixels and has achieved state-of-the-art results in various domains (Mnih et al., Reference Mnih, Kavukcuoglu, Silver, Rusu, Veness, Bellemare, Graves, Riedmiller, Fidjeland, Ostrovski, Petersen, Beattie, Sadik, Antonoglou, King, Kumaran, Wierstra, Legg and Hassabis2015; Silver et al., Reference Silver, Huang, Maddison, Guez, Sifre, Van Den Driessche, Schrittwieser, Antonoglou, Panneershelvam, Lanctot, Dieleman, Grewe, Nham, Kalchbrenner, Sutskever, Lillicrap, Leach, Kavukcuoglu, Graepel and Hassabis2016; Kempka et al., Reference Kempka, Wydmuch, Runc, Toczek and Jaśkowski2016; Lillicrap et al., Reference Lillicrap, Hunt, Pritzel, Heess, Erez, Tassa, Silver and Wierstra2016; Duan et al., Reference Duan, Chen, Houthooft, Schulman and Abbeel2016; Silver et al., Reference Silver, Hubert, Schrittwieser, Antonoglou, Lai, Guez, Lanctot, Sifre, Kumaran, Graepel, Lillicrap, Simonyan and Hassabis2018). However, despite this impressive ability, deep RL remains data inefficient and often requires a long training time to achieve reasonable performance. This drawback has made deep RL impractical in real-world applications where data are expensive to collect, such as in robotics, self-driving cars, finance, or medical applications (Bojarski et al., Reference Bojarski, Yeres, Choromanska, Choromanski, Firner, Jackel and Muller2017; Deng et al., Reference Deng, Bao, Kong, Ren and Dai2017; Miotto et al., Reference Miotto, Wang, Wang, Jiang and Dudley2017).
Similar to classic RL algorithms, deep RL suffers from poor initial performance since it learns tabula rasa (Sutton & Barto, Reference Sutton and Barto2018). Inherently, deep RL takes even longer to learn because, unlike in classic RL where hand-engineered features were used, deep RL has to learn features directly from raw observations, in addition to policy learning. Therefore, one can speed up deep RL by addressing its two learning components: feature learning and policy learning. In this work, we tackle the feature learning problem and show that faster learning can be achieved by addressing one of the two problems.
There have been many techniques proposed to speed up feature learning in deep RL, from transfer learning (Taylor & Stone, Reference Taylor and Stone2009; Pan et al., Reference Pan and Yang2010), to reward shaping (Ng et al., Reference Ng, Harada and Russell1999; Brys et al., Reference Brys, Harutyunyan, Taylor and Nowé2015), to using auxiliary tasks (Zhang et al., Reference Zhang, Lee and Lee2016; Jaderberg et al., Reference Jaderberg, Mnih, Czarnecki, Schaul, Leibo, Silver and Kavukcuoglu2017; Mirowski et al., Reference Mirowski, Pascanu, Viola, Soyer, Ballard, Banino, Denil, Goroshin, Sifre, Kavukcuoglu, Kumaran and Hadsell2017; Papoudakis et al., Reference Papoudakis, Chatzidimitriou and Mitkas2018; Du et al., Reference Du, Czarnecki, Jayakumar, Pascanu and Lakshminarayanan2018). Learning from demonstration (LfD) (Argall et al., Reference Argall, Chernova, Veloso and Browning2009) is yet another way to help speed up learning in deep RL and has recently gained traction due to its ability to bootstrap the agent at the beginning of training (Kurin et al., Reference Kurin, Nowozin, Hofmann, Beyer and Leibe2017; Vinyals et al., Reference Vinyals, Ewalds, Bartunov, Georgiev, Vezhnevets, Yeo, Makhzani, Küttler, Agapiou, Schrittwieser, Quan, Gaffney, Petersen, Simonyan, Schaul, van Hasselt, Silver, Lillicrap, Calderone, Keet, Brunasso, Lawrence, Ekermo, Repp and Tsing2017; Hester et al., Reference Hester, Vecerik, Pietquin, Lanctot, Schaul, Piot, Sendonaris, Dulac-Arnold, Osband, Agapiou, Leibo and Gruslys2018; Pohlen et al., Reference Pohlen, Piot, Hester, Azar, Horgan, Budden, Barth-Maron, van Hasselt, Quan, Večerík, Hessel, Munos and Pietquin2018). In this work, we make use of human demonstration data by first using supervised learning to pre-train a neural network to learn the underlying state features and then transfer the learned features to an RL agent (Erhan et al., Reference Erhan, Manzagol, Bengio, Bengio and Vincent2009, Reference Erhan, Bengio, Courville, Manzagol, Vincent and Bengio2010; Yosinski et al., Reference Yosinski, Clune, Bengio and Lipson2014). We evaluate our approach using a recently developed deep RL algorithm, the asynchronous advantage actor-critic (A3C) (Mnih et al., Reference Mnih, Badia, Mirza, Graves, Lillicrap, Harley, Silver and Kavukcuoglu2016) algorithm in six Atari games (Bellemare et al., Reference Bellemare, Naddaf, Veness and Bowling2013). Unlike previous work where a large amount of expert human data is required to achieve good initial performance boost, our approach shows significant learning speed improvements on all experiments with only a relatively small amount of noisy, non-expert demonstration data. The simplicity of our approach has made it generally adaptable to other deep RL algorithms and potentially to other domains since the collection of demonstration data becomes easy. In addition, we apply Gradient-weighted Class Activation Mapping (Grad-CAM) (Selvaraju et al., Reference Selvaraju, Cogswell, Das, Vedantam, Parikh and Batra2017) on learned feature maps for both the human data and the agent data, providing a detailed analysis on why pre-training helps to speed up learning. Our work makes the following contributions:
1. We show that pre-training on a small amount of non-expert human demonstration data is sufficient to achieve significant performance improvements.
2. We are the first to apply the transformed Bellman (TB) operator (Pohlen et al., Reference Pohlen, Piot, Hester, Azar, Horgan, Budden, Barth-Maron, van Hasselt, Quan, Večerík, Hessel, Munos and Pietquin2018) in the A3C algorithm (Mnih et al., Reference Mnih, Badia, Mirza, Graves, Lillicrap, Harley, Silver and Kavukcuoglu2016) and further improve A3C’s performance on both baseline and pre-training methods.
3. We propose a modified version of the Grad-CAM method (Selvaraju et al., Reference Selvaraju, Cogswell, Das, Vedantam, Parikh and Batra2017), which we are the first to provide empirical analysis on what features are learned from pre-training, indicating why pre-training on human demonstration data helps.
4. We release our code and all collected human demonstration data at https://github.com/gabrieledcjr/DeepRL.
This article is organized as the following. In the next section, we review some of the related work in using pre-training to improve data efficiency. Section 3 provides background on deep RL algorithms and the TB operator. In Section 4, we propose our pre-training methods for deep RL, followed by Section 5, where we describe the experimental designs. Results and analysis are presented in Section 6. We conclude this article in Section 7 with discussions and future works.
2 Related work
Our work is closely related to transfer learning (Taylor & Stone, Reference Taylor and Stone2009; Pan et al., Reference Pan and Yang2010) where learned knowledge from source task(s) is transferred to target task(s) such that the target task does not need to learn features and/or policies from scratch, thus obtaining faster learning. In supervised learning, transferring parameters from a model pre-trained on ImageNet (Russakovsky et al., Reference Russakovsky, Deng, Su, Krause, Satheesh, Ma, Huang, Karpathy, Khosla, Bernstein, Alexander and Fei-Fei2015) has shown to be an effective way of speeding up image classification in a new data set, especially when the source data set is similar to the target data set (Yosinski et al., Reference Yosinski, Clune, Bengio and Lipson2014). In deep RL, the performance of a target agent can be improved by making use of the knowledge learned in one or more similar source agents (Du et al., Reference Duan, Chen, Houthooft, Schulman and Abbeel2016; Glatt et al., Reference Glatt, Silva and Costa2016; Parisotto et al., Reference Parisotto, Ba and Salakhutdinov2016; Rusu et al., Reference Rusu, Colmenarejo, Gulcehre, Desjardins, Kirkpatrick, Pascanu, Mnih, Kavukcuoglu and Hadsell2016; Teh et al., Reference Teh, Bapst, Czarnecki, Quan, Kirkpatrick, Hadsell, Heess and Pascanu2017). All works mentioned above perform pre-training and transfer under the same problem settings, that is, pre-training in supervised learning and transfer to supervised learning, or pre-training in RL and transfer to RL. In this work, we consider a different mechanism that transfers between different problem settings. We pre-train a supervised classification model on the human demonstration data, and then transfer the learned features to an RL agent.
Existing work has shown that pre-training can effectively speed up learning in RL. For example, Abtahi and Fasel (Reference Abtahi and Fasel2011) considered learning latent features with unsupervised learning through Deep Belief Networks as a pre-training method; Anderson et al. (Reference Anderson, Lee and Elliott2015) pre-train hidden units of a Q-network by learning to predict state dynamics. These works show learning speed up in relatively easy RL domains such as Mountain Car, Puddle World, and Cart-Pole. Our approach is in spirit to these earlier works and differs in that we consider a much complex domain, Atari, and learn features directly from raw input images instead of using hand-engineered features in a simpler domain. Learning directly from raw inputs is extremely challenging to an RL agent as it has to learn both the feature representations and the policy simultaneously.
Leveraging human knowledge via LfD is another effective way to pre-train an RL agent and has shown to be successful in robotics problems (Argall et al., Reference Argall, Chernova, Veloso and Browning2009). LfD has recently been applied widely in deep RL. Christiano et al. (Reference Christiano, Leike, Brown, Martic, Legg and Amodei2017) use human feedback to learn a reward function; Hester et al. (Reference Hester, Vecerik, Pietquin, Lanctot, Schaul, Piot, Sendonaris, Dulac-Arnold, Osband, Agapiou, Leibo and Gruslys2018) pre-train a deep Q-network (DQN) (Mnih et al., Reference Mnih, Kavukcuoglu, Silver, Rusu, Veness, Bellemare, Graves, Riedmiller, Fidjeland, Ostrovski, Petersen, Beattie, Sadik, Antonoglou, King, Kumaran, Wierstra, Legg and Hassabis2015) with human demonstrations by combining a large margin supervised loss with temporal difference loss, such that the agent closely imitates the demonstrator’s policy at the beginning and later on learn to surpass the demonstrator. Our work similarly leverages a supervised loss as pre-training but differs in that we consider only the cross-entropy-supervised loss as a feature learner, but not to imitate the policy. Pohlen et al. (Reference Pohlen, Piot, Hester, Azar, Horgan, Budden, Barth-Maron, van Hasselt, Quan, Večerík, Hessel, Munos and Pietquin2018) builds upon Hester et al. (Reference Hester, Vecerik, Pietquin, Lanctot, Schaul, Piot, Sendonaris, Dulac-Arnold, Osband, Agapiou, Leibo and Gruslys2018) and proposes a reward-invariant update rule that uses the TB operator in the DQN algorithm which better leverages expert demonstrations. In our work, we instead apply the TB operator in the A3C algorithm. The work of Silver et al. (Reference Silver, Huang, Maddison, Guez, Sifre, Van Den Driessche, Schrittwieser, Antonoglou, Panneershelvam, Lanctot, Dieleman, Grewe, Nham, Kalchbrenner, Sutskever, Lillicrap, Leach, Kavukcuoglu, Graepel and Hassabis2016) also trains human demonstrations in supervised learning and then uses the supervised learner’s network to initialize RL’s policy network. However, their work uses a vast amount of expert demonstration data to train the supervised learner, while ours only uses a small amount of non-expert data. Our work is also the first to provide a comparative analysis on how pre-training with human data impacts learning in deep RL algorithms, as well as how our approach complements existing deep RL algorithms when (a small amount of) human demonstrations are available.
3 Background: deep reinforcement learning
An RL problem is typically modeled using a Markov Decision Process that is represented by a five-tuple 〈S, A, P, R, γ〉. At each time step t, an RL agent receives some state representation  $S_t \in {\mathcal S}$ and explores an unknown environment by taking an action
 $A_t \in {\mathcal A}(s)$. A reward
 $R_{t + 1} \in {\mathcal R} \subset {\mathbb R}$ is given based on the action the agent took and the next state S t + 1 it reaches. The goal of an RL agent is to learn to maximize the expected return value
 $G_t = \sum\nolimits_{k = 0}^\infty \gamma R_{t + k + 1}$ for each state at time t. The discount factor γ ∈ [0, 1] determines the relative importance of future and immediate rewards (Sutton & Barto, Reference Sutton and Barto2018).
The first successful deep RL method, DQN, learns to play 49 Atari games directly from screen pixels by combining Q-learning with a deep convolutional neural network (Mnih et al., Reference Mnih, Kavukcuoglu, Silver, Rusu, Veness, Bellemare, Graves, Riedmiller, Fidjeland, Ostrovski, Petersen, Beattie, Sadik, Antonoglou, King, Kumaran, Wierstra, Legg and Hassabis2015). In classic Q-learning, an agent learns a state-action value function  $Q^\pi (s,a) = {\Bbb E}_{s'} [r + \gamma \max _{a'} Q^\pi (s',a')|s,a]$, which is the expected discounted reward determined by performing action in state and thereafter following policy (Watkins & Dayan, Reference Watkins and Dayan1992). The optimal Q * can be deduced by following actions that have the maximum Q value, Q * (s, a) = argmaxπQ π (s, a). Directly computing the Q value is not feasible when the state space is large or continuous. The DQN algorithm uses a convolutional neural network as a function approximator to estimate Q(s, a; θ) ≈ Q * (s, a), where θ is the network’s weight parameter. For each iteration i, DQN is trained to minimize
 $$L_i (\theta _i ) = {\Bbb E}_{s,a,r,s'} [(y - Q(s,a;\theta _i ))^2 ]$$
where is a  $y = r + \gamma \max a'Q(s',a';Q_i^ - )$ target network parameterized as
 $\theta _i^ - $ that was generated from previous iterations.{s, a, r, s′} are state-action samples drawn from an experience replay memory, which is used to store the agent’s experiences. At each time step, a batch of 32 samples (or minibatch) is drawn from the experience replay memory to perform an update—this off-policy method could break the correlation between data (i.e., the sampled data are i.i.d.), which stabilizes the learning. All rewards are clipped to [−1, 1] to cope with different reward scales in games. The use of a target network, an experience replay memory, and the reward clipping are essential to stabilizing learning. The ɛ-greedy policy is used by the agent to obtain sufficient exploration of the state space; for a probability of ɛ, the agent selects a random action to explore.
3.1 Asynchronous advantage actor-critic
The DQN algorithm suffers from two drawbacks: long training times and high computational requirements for memory and GPU resources. The A3C algorithm, in contrast, trains faster without the need of a GPU. In this work, we choose to use the A3C algorithm for all experiments.
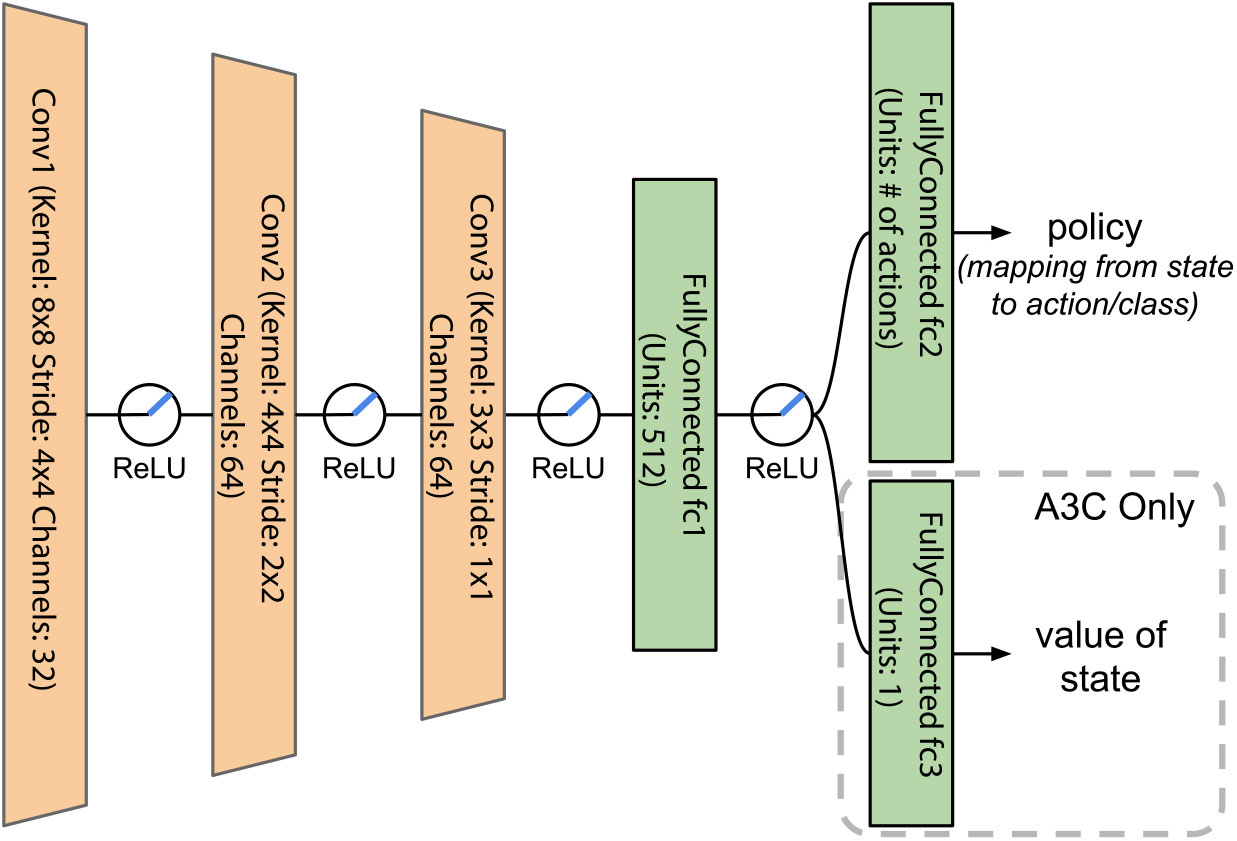
A3C combines the actor-critic algorithm with deep RL. It differs from value-based algorithms where only a value function is learned. An actor-critic algorithm is policy-based and maintains both a policy function π(at|st; θ) and a value function Vπ(St; θν). The policy function is called the actor, which takes actions based on the current policy π. The value function is called the critic, which serves as a baseline to evaluate the quality of the action using the state value  $V^\pi (s_t ;\theta _v )$. The network architecture of the A3C algorithm is shown in Figure 1. There are three convolutional layers (conv1, conv2, and conv3), one fully connected layer of size (fc1), followed by two branches of fully connected layer: fc2 is the policy function output layer which is of the same size as the number of actions and fc3 is the value function output layer of size 1.
Network architecture for each parallel actor in the A3C agent. We follow the same architecture as in Mnih et al. (Reference Mnih, Kavukcuoglu, Silver, Rusu, Veness, Bellemare, Graves, Riedmiller, Fidjeland, Ostrovski, Petersen, Beattie, Sadik, Antonoglou, King, Kumaran, Wierstra, Legg and Hassabis2015), where there are three convolutional layers (conv1, conv2, and conv3), followed with two fully connected layers (fc1 and fc2), and a third fully connected layer (fc3) for learning the state value function as was done in Mnih et al. (Reference Mnih, Badia, Mirza, Graves, Lillicrap, Harley, Silver and Kavukcuoglu2016)

In A3C, k actor-learners run in parallel with their own copies of the environment and parameters for the policy and value function, which enables exploration of different parts of the environment and therefore observations will not be correlated. Each actor-learner performs a parameter update every actions, or when a terminal state is reached—this is similar to using minibatch update as was done in DQN. Updates are synchronized to a master learner that maintains a central policy and value function, which will be the final policy upon the completion of training.
The policy network is directly parameterized and improved via policy gradient (Sutton & Barto, Reference Sutton and Barto2018). To reduce the variance in policy gradient, an advantage function is used and calculated as  $A(s_t ,a_t ;\theta ,\theta _v ) = Q^{(n)} (s_t ,a_t ;\theta ,\theta _v ) - V(s_t ;\theta _v )$. The Q (n) function is defined as
 $Q^{(n)} (s_t ,a_t ;\theta ,\theta _v ) = \sum\limits_{k = 0}^{n - 1} \gamma ^k r_{t + k} + \gamma ^n V(s_{t + n} ;\theta _v )$
where n is upper-bounded by t max. The loss function for the policy network is then defined as
 $L(\theta ) = \nabla _\theta \log \pi (a_t |s_t ;\theta )A(a_t ,s_t ;\theta ,\theta _v ) + \beta \nabla _\theta H(\pi (s_t ;\theta ))$
where H is the entropy of policy π that encourages exploration and therefore helps prevent premature convergence to suboptimal policies. The value network is updated using the loss function
 $L(\theta _v ) = \nabla _{\theta _v } [(Q^{(n)} (s_t ,a_t ;\theta ,\theta _v ) - V(s_t ;\theta _v ))^2 ]$
3.2 Transformed Bellman operator
Reward clipping is introduced in DQN and is also used in A3C to cope with different reward scales among Atari games (Mnih et al., Reference Mnih, Kavukcuoglu, Silver, Rusu, Veness, Bellemare, Graves, Riedmiller, Fidjeland, Ostrovski, Petersen, Beattie, Sadik, Antonoglou, King, Kumaran, Wierstra, Legg and Hassabis2015), Reference Rusu, Colmenarejo, Gulcehre, Desjardins, Kirkpatrick, Pascanu, Mnih, Kavukcuoglu and Hadsell2016). However, this is problematic because the RL agent will not be able to distinguish between states with high rewards versus those with low rewards, resulting in learning a suboptimal policy. The poor performance in some Atari games has been attributed to reward clipping (Hester et al., Reference Hester, Vecerik, Pietquin, Lanctot, Schaul, Piot, Sendonaris, Dulac-Arnold, Osband, Agapiou, Leibo and Gruslys2018).
In this work, we apply the TB operator (Pohlen et al., Reference Pohlen, Piot, Hester, Azar, Horgan, Budden, Barth-Maron, van Hasselt, Quan, Večerík, Hessel, Munos and Pietquin2018) to the A3C algorithm to overcome the problem of reward clipping. We use the raw rewards instead of clipping them to the scale of [−1, 1]. A function  $h:{\mathbb R} \to {\mathbb R}$ is used to reduce the scale of Q(n)(st, at; θ, θν) (Equation (1)) and is transformed as
 $$Q^{(n)} (s_t ,a_t ;\theta ,\theta _v ) = \sum\limits_{k = 0}^{n - 1} h\left( {\gamma ^k r_{t + k} + \gamma ^n h^{ - 1} \left( {V\left( {s_{t + n} ;\theta _v } \right)} \right)} \right)$$
 $$h:z \mapsto {\text{s}}ign(z)\left( {\sqrt {|z| + 1} - 1} \right) + \varepsilon z$$
 $$h^{ - 1} :x \mapsto {\text{s}}ign(x)\left( {\left( {\frac{{\sqrt {1 + 4\varepsilon (|x| + 1 + \varepsilon )} - 1}}{{2\varepsilon }}} \right)^2 - 1} \right)$$
where εz is for regularization that ensures h−1 is Lipschitz continuous and a closed-form inverse.
4 Supervised pre-training for deep reinforcement learning
Deep RL can be divided into two subtasks: feature learning and policy learning. Although deep RL in itself has succeeded in learning both tasks simultaneously, it still suffers from long training time and slow learning. We believe that by addressing feature learning, we can jump-start the performance in an RL agent since it will be able to focus more on policy learning, which in turn speeds up the entire learning process.
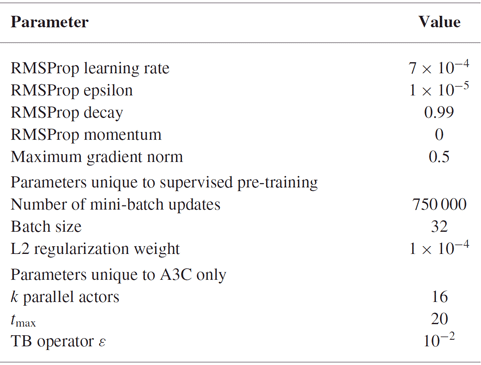
In this article, we propose to use supervised pre-training on human demonstration data as a way to address feature learning. We train a multiclass classification network over a set of non-expert human demonstrations, where actions demonstrated by the human were used as the ground truth labels for a given input game frame. The network uses the same architecture as in A3C (shown in Figure 1) where the fc2 layer is used as the classification output layer. Note that we exclude the fc3 layer for the classification task. The network classifier minimizes a softmax cross-entropy loss using the RMSProp (Tieleman & Hinton, Reference Tieleman and Hinton2012) optimizer with a set of hyperparameters shown in Table 1. We also use gradient clipping and L2 regularization for more stable training.
All games use the same set of hyperparameters except for Pong, where we found setting RMSProp epsilon 1 × 10⁻⁴ to gives a much more stable learning

A3C=asynchronous advantage actor-critic; TB=transformed Bellman.
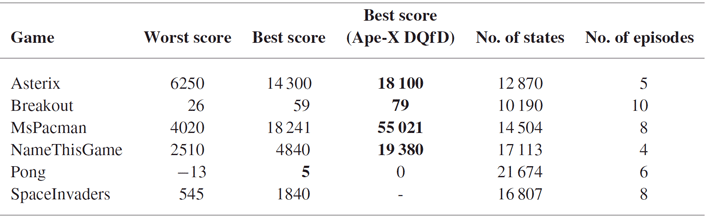
However, we identify two problems when using non-expert human demonstration for pre-training. First, we assume the actions provided by the human are the correct labels—the low quality of our data shown in Table 2 indicates that we are pre-training with noisy data. In this work, we empirically study if the noise in the data would still allow us to learn important features. Second, the collected human data are highly imbalanced. For example, in the game of Breakout, after hitting the ball, the human usually do nothing until the ball bounces and starts falling back to the paddle, which results in most collected actions being the ‘NOOP’ action. In some games, the human demonstrator tends to use the simpler actions like ‘LEFT’ instead of the compound actions like ‘LEFTFIRE’. The class imbalance problem plagues all six games used in our experiments. To cope with this, we use proportional sampling. During minibatch sampling, we randomly sample over all available actions based on their proportion to the entire demonstration data; doing so ensures that each minibatch includes a relatively balanced set of classes. We pre-train a classification model for each Atari game for 750 000 training iterations.
Human demonstration size and quality. The data are of a small amount and the demonstrator is a non-expert, compared to the best human demonstration score in the state-of-the-art Ape-X DQfD algorithm (Pohlen et al., Reference Pohlen, Piot, Hester, Azar, Horgan, Budden, Barth-Maron, van Hasselt, Quan, Večerík, Hessel, Munos and Pietquin2018) (Ape-X DQfD did not collect human demonstration for SpaceInvaders)

Best values are shown in bold.
After pre-training, the learned weights and biases from the classifier are then used to initialize the A3C’s network (instead of random initialization). Note that when using all layers’ parameters from the pre-trained model (including the output fc2 layer), normalizing the output layer’s weights is necessary to achieve a positive result; we empirically observe that the values of the output layer tend to explode without normalization. To normalize the output layer, we keep track of the maximum value of the output layer during training, which is then used as the divisor to all weights and biases. We refer to our pre-training method as the pre-trained model for A3C (PMfA3C). We also apply pre-training to the TB operator variant of the A3C algorithm, and we refer to it as PMfA3C-TB.
5 Experimental design
We evaluate our approach in six Atari games: Asterix, Breakout, MsPacman, NameThisGame, Pong, and SpaceInvaders. We use the deterministic version four of the Atari 2600 environment from OpenAI Gym (Brockman et al., Reference Brockman, Cheung, Pettersson, Schneider, Schulman, Tang and Zaremba2016). We follow the Atari settings described in the DQN algorithm and OpenAI baselines Atari wrapper (Mnih et al., Reference Mnih, Kavukcuoglu, Silver, Rusu, Veness, Bellemare, Graves, Riedmiller, Fidjeland, Ostrovski, Petersen, Beattie, Sadik, Antonoglou, King, Kumaran, Wierstra, Legg and Hassabis2015; Dhariwal et al., Reference Dhariwal, Hesse, Klimov, Nichol, Plappert, Radford, Schulman, Sidor, Wu and Zhokhov2017). Here are the Atari settings used:
At the beginning of a game, the agent executes a random x (0 ≤ x ≤ 30) number of ‘NOOP’ actions.
Take an action for games (e.g., Breakout) that remains static unless pressing ‘FIRE’.
Apply max pooling over the game frames to remove flickering effects of the game.
Consider loss of life as the end of an episode or as a terminal state, but only do a hard reset on the game environment (i.e., reset back to the initial game state) when losing all lives.
Use a frame skip of four, meaning that an action is repeated for four frames before a new action is selected.
The network architecture for A3C is shown in Figure 1. The four most recent game frames are used as input to the network—each frame is converted to grayscale and resized to 84 × 84 without cropping. We use the same set of hyperparameters for all games (except for Pong). We summarize the hyperparameter values in Table 1. Gradient clipping is also used in A3C. For all experiments, we train a total of million steps, distributed over parallel A3C actors. Each step consists four game frames (since we use frame skip of four); thus, all experiments run a total of 200 million game frames.
5.1 Collection of human demonstration
We use the keyboard interface from OpenAI Gym (Brockman et al., Reference Brockman, Cheung, Pettersson, Schneider, Schulman, Tang and Zaremba2016) to enable interactions between the human demonstrator and the Atari environment. For each game, the demonstrator is provided with game rules and a set of valid actions with their corresponding keyboard keys. The frame skip is set to one to provide smoother game transitions during human plays (whereas we reset it to four during agent training). To simulate frame skipping during the demonstration, we collect every fourth frame of the game. At each collection step, we save (1) the game image (i.e., the state), (2) the action taken by the demonstrator, (3) the reward received, and (4) if the current state is a terminal state. For each episode, we allow a maximum of 20 minutes of playing time for the human demonstrator. The demonstration ends when the game reaches the time limit or when the game ends—whichever comes first. Table 2 provides a breakdown of the demonstration size and quality for all games.
5.2 Evaluation procedures
For all experiments, we perform policy evaluation on the RL agent at every one million training steps. We get the average testing score over 125 000 testing steps and report the average over four trials. We report the highest average reward of the RL agent and also measure the learning speed improvement using three metrics adapted from Taylor and Stone (Reference Taylor and Stone2009):
1. Best reward: the highest average reward attained by the agent from over four trials.
2. Final performance: the final learned performance of the agent. We use the reward obtained at step million as the value for the final performance.
3. Total reward: the total reward accumulated (i.e., the area under the learning curve (AUC)) by the agent. We approximate the AUC using the trapezoidal rule:
 $AUC \approx \sum\nolimits_{t = 1}^T \frac{{f(x_{t - 1} ) + f(x_t )}}{2}\Delta x_t $, where f(x t) is the reward value at time t and $\Delta x_t = x_t - x_{t - 1} = 10^6 $ is the evaluation frequency. Note that for readability, we scale down all calculation results by one million and consider Δxt = 1—this does not affect the comparison results.
4. Reward improvement: the ratio of the total reward improvement of the pre-trained agent compared to the baseline agent. We calculate it as
$\% Ratio = \frac{{AUC_{{\text{pre}} - {\text{trained}}} - AUC_{{\text{baseline}}} }} {{AUC_{{\text{baseline}}} }} \times 100. $


6 Results
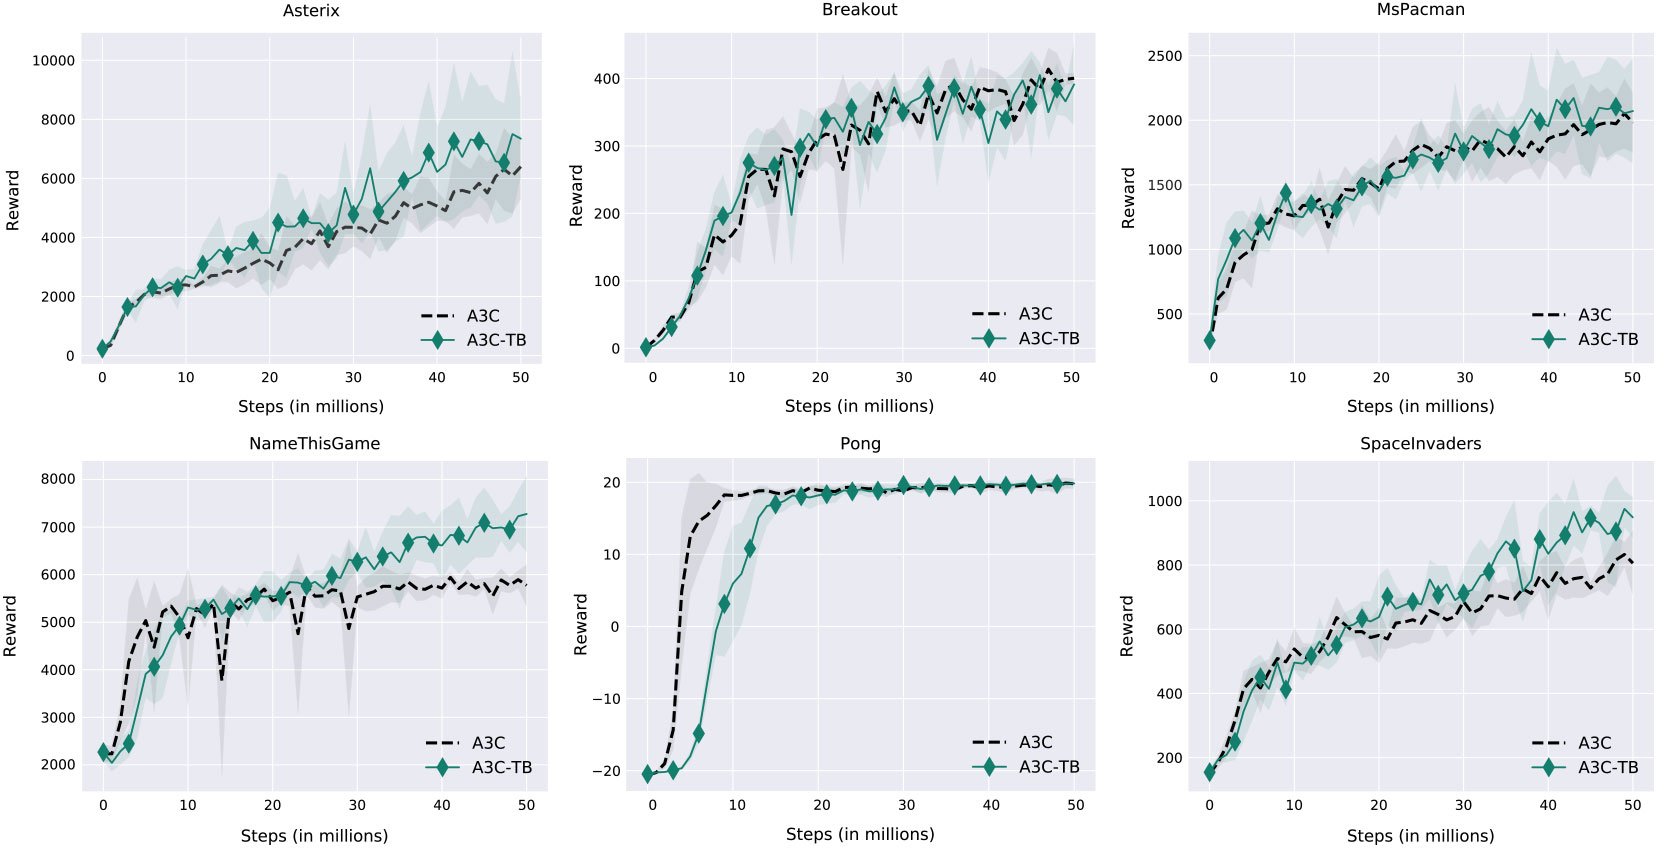
First, we present the performance of the baseline A3C and the TB operator-variant A3C (A3C-TB). Figure 2 shows that A3C-TB outperforms the baseline A3C in five out of the six games. Although Pong in A3C-TB has a low performance,Footnote 1 we still consider the results as consistent with the findings in Hester et al. (Reference Hester, Vecerik, Pietquin, Lanctot, Schaul, Piot, Sendonaris, Dulac-Arnold, Osband, Agapiou, Leibo and Gruslys2018) that using reward clipping leads to an agent learning a suboptimal policy. As we discussed in Section 3.2, A3C-TB enables using raw reward signals such that the RL agent can distinguish between low and high rewarding states, which leads to better policy learning. This is even more important to address when LfD for games that have distinct reward signals. For example, in the game of MsPacman, humans tend to take actions that move toward states with high rewards (e.g., eating an edible ghost is more rewarding than eating the dots). However, in a baseline A3C agent where the rewards are clipped, it sees all rewards as equal and might not be able to leverage the human knowledge of ‘eating an edible ghost’.
Performance of the baseline A3C and the TB operator variant A3C (A3C-TB). The x-axis is the total number of training steps (among all actors), where each step consists of four game frames (we use frame skip of four). The y-axis is the average testing score over four trials where the shaded regions correspond to the standard deviation

Next, we present and discuss results for our pre-training approaches, PMfA3C and PMfA3C-TB. Note that we do not compare our results to recent algorithms in Hester et al. (Reference Hester, Vecerik, Pietquin, Lanctot, Schaul, Piot, Sendonaris, Dulac-Arnold, Osband, Agapiou, Leibo and Gruslys2018) and Pohlen et al. (Reference Pohlen, Piot, Hester, Azar, Horgan, Budden, Barth-Maron, van Hasselt, Quan, Večerík, Hessel, Munos and Pietquin2018) since our training steps are much shorter and are not directly comparable to those that were trained on large scale.
6.1 Pre-training methods
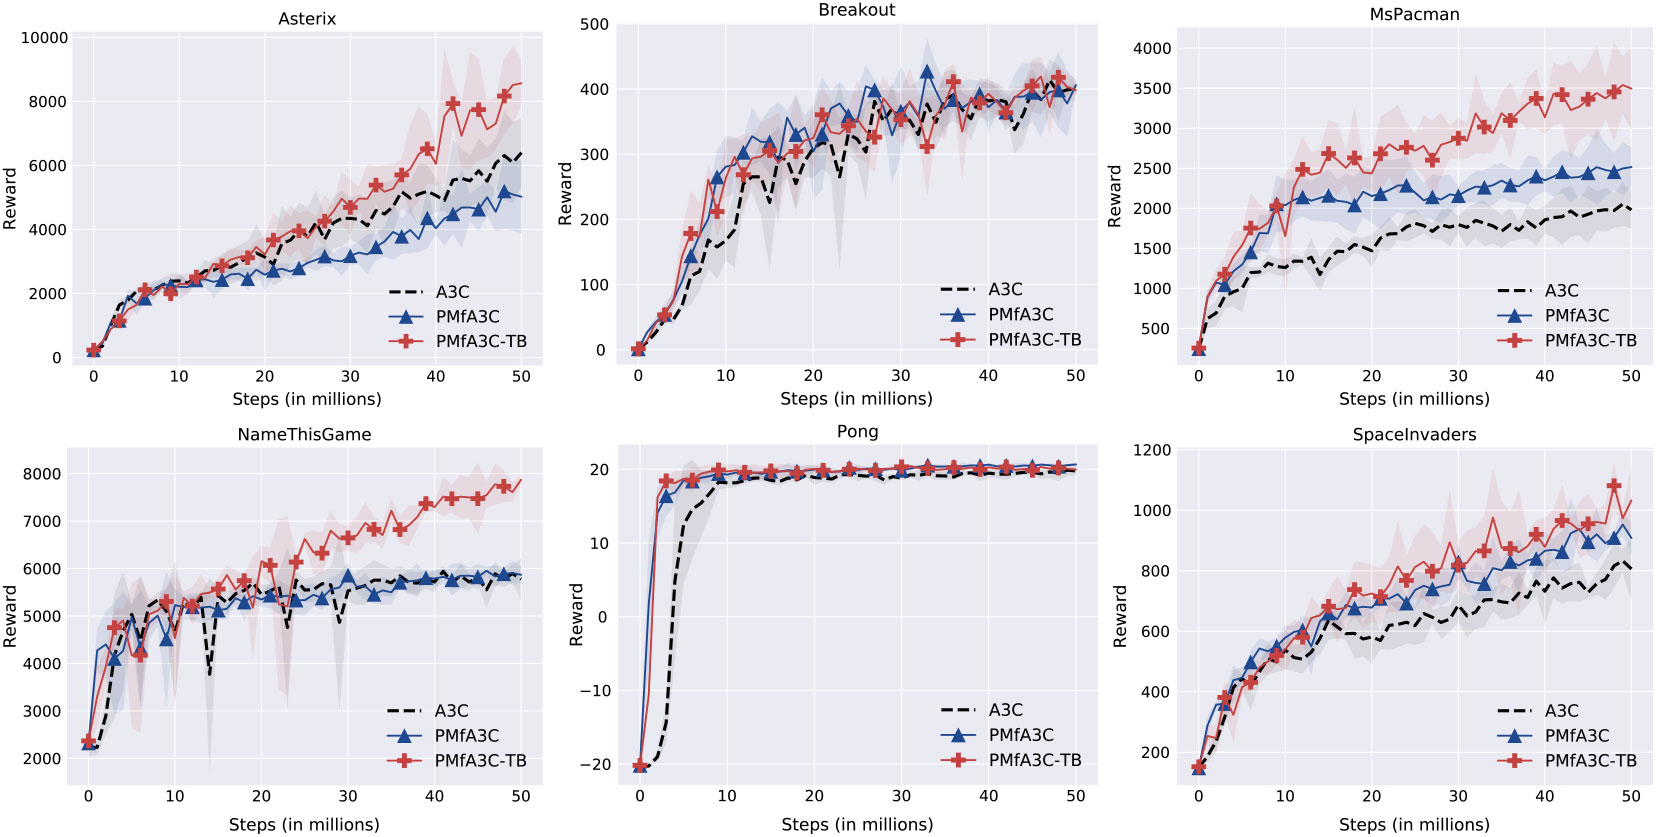
We apply pre-training methods as described in Section 4 to both PMfA3C and PMfA3C-TB. A multiclass-classification network is pre-trained using the human demonstration data set. All weights and biases from the classifier are used to initialize A3C’s network layers, conv1, conv2, conv3, fc1, and fc2; the fc3 layer is initialized randomly. Figure 3 shows the learning curve of both PMfA3C and PMfA3C-TB. Compared to the baseline A3C, PMfA3C outperforms in three out of six games; PMfA3C-TB shows a much stronger performance and exceeds the baseline in five out of six games.
Performance of baseline and pre-training using A3C. The x-axis is the total number of training steps (among all actors), where each step consists of four game frames (we use frame skip of four). The y-axis is the average testing score over four trials where the shaded regions correspond to the standard deviation

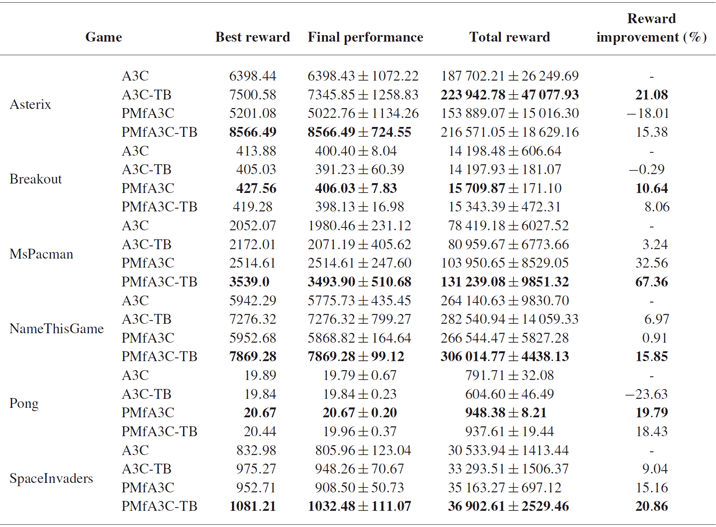
Table 3 shows the quantitative performance improvements of our pre-training methods over the baseline. PMfA3C and PMfA3C-TB achieve the best performance in the game of MsPacman among all experiments with a remarkable total reward improvement of 67.36%. This verifies the importance of being able to learn from raw reward signals (instead of clipped rewards) in games with various reward scales. SpaceInvaders and Pong also show good reward improvement ratios in both pre-training methods compared to the baseline. While the performance increase in Breakout might not seem obvious visually from the learning curves, their total rewards indicate a 10.64% and an 8.06% improvement for PMfA3C and PMfA3C-TB, respectively. In contrast, we note that PMfA3C did not help in NameThisGame and Asterix. The former shows comparable results as the baseline A3C with a negligible improvement of 0.91%. When using PMfA3C for Asterix, it shows the worst performance among all experiments with an 18.01% performance drop compared to the baseline. However, we point out that when applying the TB operator, A3C-TB and PMfA3C-TB, Asterix outperforms the baseline by 21.08% and 15.38% respectively.
Quantitative evaluation of pre-training methods using four metrics: best reward, final performance, total reward, and reward improvement

A3C=asynchronous advantage actor-critic; A3C-TB =transformed Bellman operator variant A3C; PMfA3C: pre-trained model for A3C.
Best values are shown in bold.
In summary, our experiment results show that (1) using the TB operator is important for games with various reward scales and (2) pre-training is beneficial for training in the RL agent.
6.2 Ablation studies
In reusing networks for image classification, Yosinski et al. (Reference Yosinski, Clune, Bengio and Lipson2014) pointed out that the lower layers of a network tend to learn more general features while upper layers tend to learn more specific features toward the task. This is what inspired us to use all layers from the pre-trained network since both networks are trained on data collected from the same game.
To understand how reusing just a subset of the whole pre-trained network affects the performance speedup and how it compares to our best approach PMfA3C-TB, we conduct the following ablation studies:
PMfA3C-TB: reuse all layers (as was done in Section 6.1).
PMfA3C-TB fc1: reuse conv1, conv2, conv3, and fc1.
PMfA3C-TB conv3: reuse conv1, conv2, and conv3.
PMfA3C-TB conv2: reuse conv1 and conv2.
PMfA3C-TB conv1: reuse conv1 only.
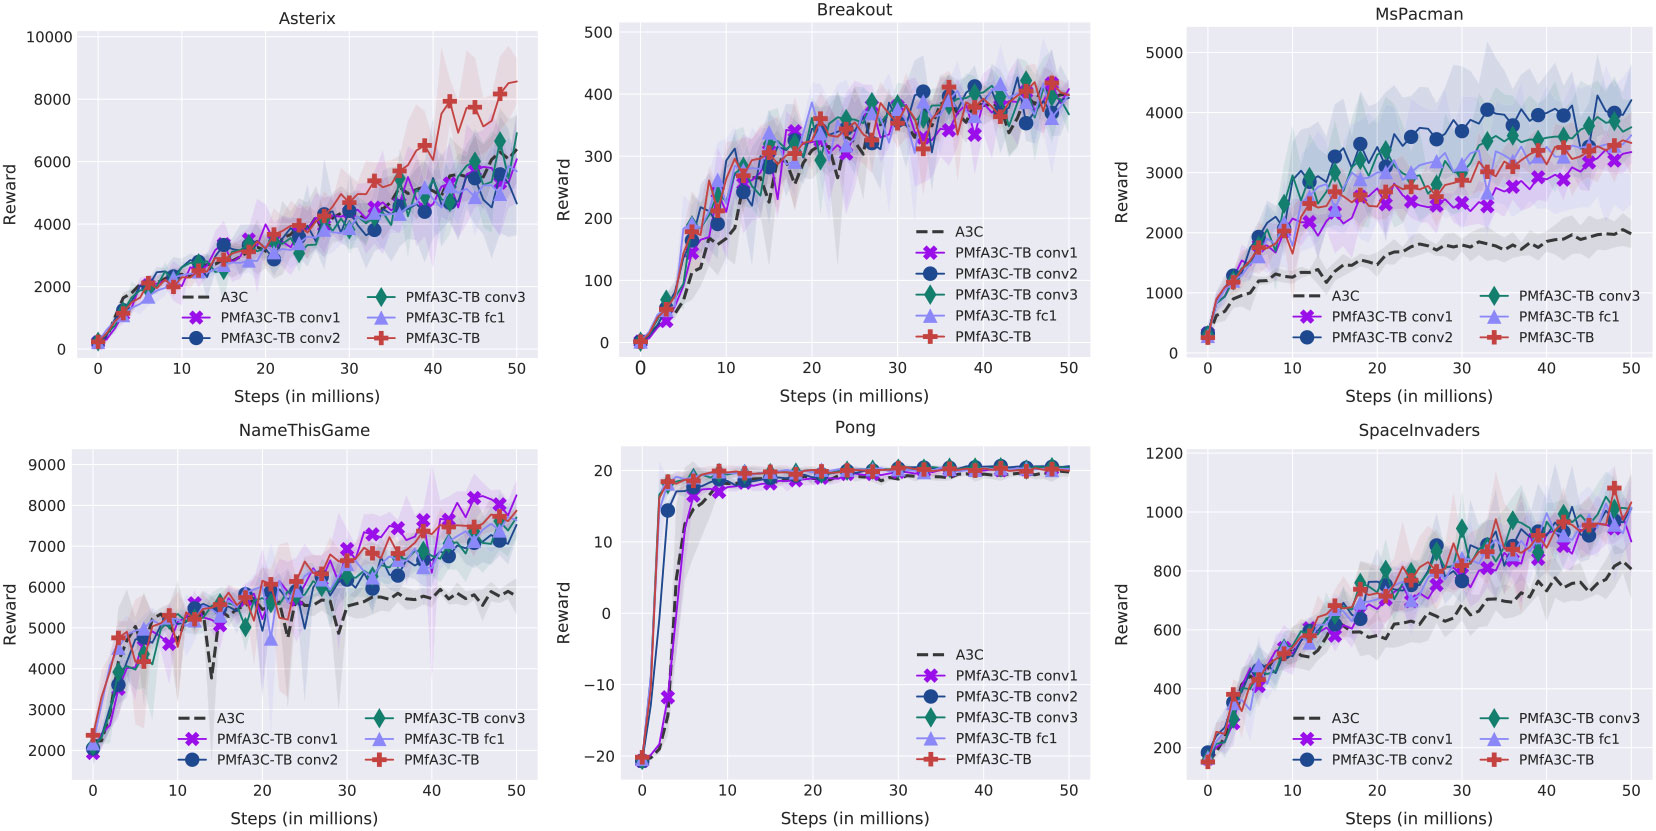
Figure 4 shows the results for our ablation study. We found the most intuitive results in Pong where the more pre-trained layers are reused, the better the results are. In Breakout and SpaceInvaders, reusing different layers shows no obvious distinctions in performance compared to reusing all layers. In Asterix, reusing all pre-trained layers still has the best performance; when reusing only a part of the pre-trained layers, the performance is similar to the baseline A3C. MsPacman and NameThisGame have the most varying results when different layers are reused. It is interesting to note that they show inverted performance for different reusing strategies—PMfA3C-TB conv1 has the worst result in MsPacman among all reusing strategies but shows the best result in NameThisGame. Despite this distinction, all pre-training methods in these two games outperform the baseline, regardless of the choice of reuse layers.
Performance of baseline and pre-training using A3C. The x-axis is the total number of training steps (among all actors), where each step consists of four game frames (we use frame skip of four). The y-axis is the average testing score over four trials where the shaded regions correspond to the standard deviation

In summary, our ablation study shows that reusing the entire pre-trained network consistently performs well—it either achieves the best results or is comparable to reusing other layers. We point out that reusing layers that are closer to the output layer (PMfA3C-TB fc1 and conv3) also shows competitive results in four out of six games. This is consistent with the findings in Yosinski et al. (Reference Yosinski, Clune, Bengio and Lipson2014) that lower layers learn general features while higher layers learn task-specific features, and transferring general features are more beneficial when the training and testing data are different. In our case, however, since the classification model and the A3C network are trained on data that are collected from the same game, leveraging task-specific features can be more helpful than reusing only general features.
6.3 What is really learned from pre-training?
In order to understand the benefit of our pre-training method, we visualize the feature maps in the last convolutional layer to assess if an RL agent can learn meaningful high-level information about the game through pre-training. We adopt the Grad-CAM as our visualization method since it is model-agnostic and can be used in any convolutional-based network without needing to change architectures (Selvaraju et al., Reference Selvaraju, Cogswell, Das, Vedantam, Parikh and Batra2017). Using Grad-CAM, we analyze how different regions in feature maps are activated by corresponding actions under three settings: (1) a randomly initialized RL agent, (2) a pre-trained classification model, and (3) a final learned RL agent in PMfA3C-TB. By comparing feature map patterns among the three scenarios, we will be able to obtain an intuitive understanding of what is learned through pre-training and how an RL agent uses the pre-trained knowledge during its learning.
Grad-CAM is a visualization tool designed to increase the interpretability of prediction results of a deep neural network (Selvaraju et al., Reference Selvaraju, Cogswell, Das, Vedantam, Parikh and Batra2017). Specifically, Grad-CAM computes the gradient of the target logits (output values before applying softmax) with respect to feature maps of a convolutional layer. The importance weight of each neuron can then be obtained by performing global averaging pooling (Lin et al., Reference Lin, Chen and Yan2013) over the gradients. For a classification task, the target logits refer to the score of a target class, while in the context of RL, the target class can be considered as the action taken based on the current policy π. Given any game state s, the score ya of an action a is defined as ya = π(a|s; θ), where parameterizes the policy network in A3C. We then compute gradients for with respect to the feature maps of the last convolutional layer (denoted as Mk).Footnote 2 We compute the importance weight (denoted as  $\alpha _k^a$) in A3C as
 $$\alpha _k^a = \overbrace {\frac{1} {Z}\sum\limits_i \sum\limits_j }^{{\text{global}}\,{\text{average}}\,{\text{pooling}}}\underbrace {\frac{{\partial y^a }} {{\partial M_{ij}^k }}}_{{\text{gradients}}\,{\text{via}}\,{\text{backprop}}} $$
Selvaraju et al. (Reference Selvaraju, Cogswell, Das, Vedantam, Parikh and Batra2017) also combine forward activation maps and pass through a rectifier linear units (ReLU) to show the features that has a positive effect on the action of interest. This gives us the action-discriminative saliency map as
 $$ L_{{\text{Grad}} - {\text{CAM}}}^a = ReLU\left( {\sum\limits_k \alpha _k^a M^k } \right) $$
However, the output of the discriminative saliency map did not provide an interpretable visualization under A3C. According to Selvaraju et al. (Reference Selvaraju, Cogswell, Das, Vedantam, Parikh and Batra2017), the weight  $\alpha _k^a$ captures the importance of the feature map k.Since
 $\alpha _k^a$ can have both positive and negative values, we choose to emphasize only on positive weights (i.e., captures the most important features). Thus, we instead apply ReLU directly to
 $\alpha _k^a$, transforming
 $L_{{\text{Grad}} - {\text{CAM}}}^a $ as
 $$L_{{\text{Grad}} - {\text{CAM}}}^a = \sum\limits_k ReLU(\alpha _k^a )M^k$$
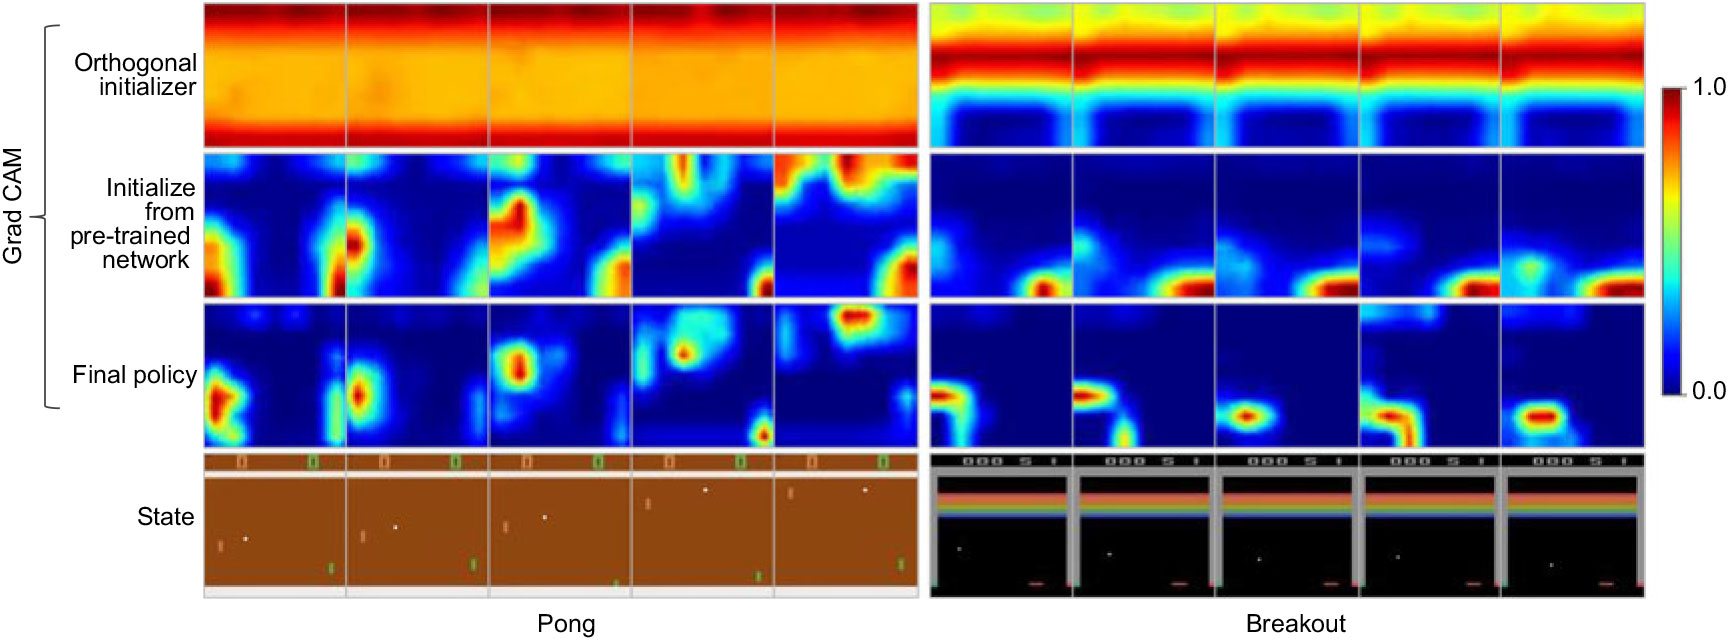
We present Grad-CAM results for two games, Pong and Breakout, as the running example in this section for analyzing what features are learned. Video clips for all six games’ Grad-CAM results are available online at https://sites.google.com/view/pretrain-deeprl. Figure 5 shows example Grad-CAM results for a sequence of five frames in Pong and Breakout and each frame is used as the input image to the network. We run a forward pass to compute the target logits ya and output an action a based on the current policy π. Note that actions are not executed in the environment but only used to compute  $L_{{\text{Grad}} - {\text{CAM}}}^a$—we do not perform gradient updates to the network. To ensure we compare the three models (random initialized, pre-trained, and final learned RL) with the same set of game inputs, we perform one episode of evaluation (until the game ends or reaches 5000 testing steps, whichever comes first) using the final learned RL agent and save all game images it encounters, and then use these images as a sequential state input to calculate Grad-CAM for the random initialized agent and the pre-trained model. Grad-CAM is visualized as a heatmap of scale [0, 1]: red (value close to 1) indicates regions that are important for a corresponding action while blue (value close to 0) indicates unimportant regions. The top row shows the feature map for a randomly initialized agent; the second row is the feature map of a pre-trained classifier; the third row shows a final learned RL agent’s feature map; the bottom row shows the original game image.
Gradient-weighted Class Activation Mapping visualization for Pong and Breakout. Top row: random initialization; second row: pre-trained model; third row: final learned RL policy; bottom row: the original game image

At the beginning of training when the network weights are randomly initialized (top row of Figure 5), both Pong and Breakout agents act randomly and overall consider the entire game state to be important. In particular, Pong agent sees the top part (where the score is located shows more red color) and somehow the bottom part to be more important than the middle part (orange color) of the game image; Breakout agent also considers the top part to be important—with more focus on the location of bricks (red-orange color) than the location of the score (yellow-green color)—but the bottom part of the image is shown to be not important at all (blue color).
The important regions change notably when the network reuses weights from pre-trained models (second row of Figure 5). Interestingly, in both games, the agent learns to pay attention to the paddle movements. In Pong, both the opponent’s paddle (left) and the agent’s paddle (right) are identified to be important; in Breakout, the paddle at the bottom becomes the most important (whereas under random initialization the bottom part of the image is considered to be the least). The result is intuitive for the pre-trained model as it finds the object that follows the cardinal directions of the actions taken to be the most important feature—when the demonstrator takes an action, the object that correlates the most to this action is the paddle.
We see a further change of important regions in the final learned RL policy (third row of Figure 5). Instead of paying attention to the paddle, both games learn to track the movement of the ball. This is particularly clear in Pong: the important features evolve following roughly the same trajectory as the movement of the ball, from the bottom-left to the top-right of the game image.
While the Grad-CAM examples in Figure 5 show that the pre-trained model picks up different important regions than the final RL policy, we also observe that some pre-training features are carried on to the final RL policy. For example, in Pong, although the RL policy has more focus on the ball, the regions around paddles are still activated with a lower importance—an inheritance from the pre-train model. In addition, in the Grad-CAM video clips where we show a complete run on all six games, it is more clear that important features in the pre-training are also identified in the final RL policy. We refer the readers to the video clips at https://sites.google.com/view/pretrain-deeprl.
7 Conclusion and discussion
The goal of this article is not to defeat the state-of-the-art results for Atari. Instead, we want to address the problem of slow learning. Other work focuses on increasing computational resources to speed up the training, while our work focuses more on improving learning speed, which is the ability to learn better policy with a smaller amount of game environment interactions. We attain the speedup in learning by supervised pre-training of the deep RL’s network using non-expert human demonstrations.
We used the TB operator (Pohlen et al., Reference Pohlen, Piot, Hester, Azar, Horgan, Budden, Barth-Maron, van Hasselt, Quan, Večerík, Hessel, Munos and Pietquin2018) in A3C, which addresses reward clipping that allows the RL agent to differentiate high and low rewarding states. The TB operator helps our pre-training approach achieve improvements in all six games that we evaluated our approach. Our pre-training approach improves the reward in MsPacman with 67.36%. In addition, A3C in MsPacman reach the highest average reward of 2052 at 49 million training steps, while PMfA3C-TB in MsPacman only takes 11 million training steps to surpass A3C’s highest average reward. This is quite a significant speedup in the learning speed especially when we only pre-trained PMfA3C-TB’s network on 14 504 game states from a non-expert human.
We also have a much better understanding of what features are being considered during pre-training by using our modified Grad-CAM. One future direction for pre-training in deep RL is to drive the activation mapping toward the objects in the game state image. We believe it would be easier for non-expert humans to simply identify the important objects in the game relative to actually playing the game—this would be another way of using humans to improve learning.
As we investigate further ways to improve our approach, we know there is a limit to how much improvement pre-training can provide without addressing policy learning. In our approach, we have already trained a model with a policy that tries to imitate the human demonstrator, and thus we can extend this work by using the pre-trained model’s policy to provide advice to the agent (Wang & Taylor, Reference Wang and Taylor2017).
To summarize, learning both features and policy directly from raw images through deep neural networks is a major factor why learning is slow in deep RL. This article has demonstrated the following: (1) we have shown through Grad-CAM that using supervised pre-training with non-expert human demonstration data can be used for feature learning and (2) that our method of initializing deep RL’s network with a supervised pre-trained model can significantly speed up learning in deep RL.
Acknowledgments
The A3C implementation was a modification of https://github.com/miyosuda/async_deep_reinforce. The authors thank Sahil Sharma and Kory Matthewson for providing very useful insights on the actor-critic method. We also thank NVidia for donating a graphics card used in these experiments. This research used resources of Kamiak, Washington State University’s high performance computing cluster, where we ran all our experiments.