I. INTRODUCTION
All-solid-state lithium secondary batteries are required for new energy storage devices. The safety and reliability of batteries are greatly improved by avoiding the use of liquid electrolytes. Solid electrolytes with high lithium ion conductivity are essential for improving the performance of all-solid-state batteries. Among the binary and ternary lithium nitrides, Li3N has the highest lithium ion conductivity of ∼10−3 Ω−1 cm−1.Reference Rabenau1 However, the decomposition voltage of Li3N is rather low (0.44 V) at room temperature and decreases rapidly with increasing temperature.Reference Rabenau1 Thus, the applicability of binary lithium nitride as a solid-state electrolyte at elevated temperatures is limited. To avoid this disadvantage, several ternary lithium nitrides have been investigated and their lithium ion conductivity has been measured.Reference Yamane, Kikkawa and Koizumi2–Reference Weppner, Hartwig and Rabenau6
Ternary lithium silicon nitrides are examples of such interesting materials. Among the Li3N–Si3N4 systems, there are several ternary compounds, including LiSi2N3,Reference Yamane, Kikkawa and Koizumi4, Reference David, Laurent, Charlot and Lang7, Reference Orth and Schnick8 Li2SiN2,Reference Yamane, Kikkawa and Koizumi4, Reference Anderson, Blair, Hick and Kaner9, Reference Bhamra and Fray10 Li5SiN3,Reference Yamane, Kikkawa and Koizumi4, Reference Juza, Weber and Meyer-Simon11, Reference Dadd and Hubberstey12 Li18Si3N10,Reference Yamane, Kikkawa and Koizumi4 Li21Si3N11,Reference Yamane, Kikkawa and Koizumi4 and Li8SiN4.Reference Yamane, Kikkawa and Koizumi4 Despite the crystal structure of some of these compounds remaining unclarified, the Li+ ion conductivity of lithium silicon nitride compounds tends to increase with the Li/Si ratio.Reference Yamane, Kikkawa and Koizumi4, Reference Ischenko, Kienle and Jansen13 Li8SiN4 has been reported to have the highest ionic conductivity among the above-mentioned ternary lithium nitrides.Reference Yamane, Kikkawa and Koizumi4 However, it is unstable in the presence of moisture and soluble in water.Reference Yamane, Kikkawa and Koizumi4
Among the lithium silicon nitrides, LiSi2N3 is the most stable compound and has a well-defined wurtzite-type structure (space group Cmc21)Reference David, Laurent, Charlot and Lang7, Reference Orth and Schnick8 that is isostructural with Li2SiO3. The framework of [Si2N3]− in LiSi2N3 is built up of two-dimensional infinite parallel layers of condensed [Si6N6] 12-membered rings formed by sharing the nitrogen atoms at the corners of the SiN4 tetrahedra.Reference Orth and Schnick8 Li+ occupies the 4a site and is directly connected with four and five nitrogen atoms within the unit cell (∼2.3 Å) and the crossover unit cell (∼2.7 Å), respectively. Regarding the practical use of the lithium silicon nitrides, LiSi2N3 is of particular interest because of its high stability. Therefore, we focused on LiSi2N3 in this study.
For the successful application of LiSi2N3 as a solid electrolyte in lithium ion batteries, the Li+ ionic conductivity of LiSi2N3 must be increased. A large number of studies have focused on doping lithium ion–conductive solid electrolytes to improve their ionic conductivity.Reference Wu, Wen, Xu and Han14–Reference Mei, Wang, Lan, Feng, Geng, Lin and Nan23 In such studies, although the doped oxides were mainly investigated, a few studies on lithium ion conductivity in doped nitrides have also been reported. Lapp et al.Reference Lapp, Skaarup and Hooper20 doped 1 at.% Mg, Cu, or Al into Li3N, expecting to increase the number of Li vacancies for charge compensation. They reported negative results. Asai et al.Reference Asai, Nishida and Kawai21 also investigated the effects of Cu substitution in Li3N. They reported that the activation energy for Li+ conduction was reduced by Cu substitution in Li3N. In spite of this reduction, the ionic conductivity also decreased. These studies suggest that it is possible to improve the ionic conductivity of Li3N through the reduction of the activation energy of diffusion by cation doping.
We explore chemical doping in LiSi2N3 with the aim of further improving the ionic conductivity. The radii of Li+ and Ca2+ for octahedral coordination (CN6) are 0.76 and 1.00 Å, respectively.Reference Shannon24 Upon Ca doping, Ca2+ may substitute for the Li+ ion of the LiSi2N3 structure. The host LiSi2N3 lattice expands with calcium doping, leading to much easier lithium ion diffusion. Furthermore, the substitution of Ca2+ for Li+ is expected to create Li+ vacancies for charge compensation, leading to increased Li+ conductivity in LiSi2N3 solid electrolyte. The effects of Ca doping on the ionic conductivity of LiSi2N3 were investigated in this study. Furthermore, the ionic conductivity of Ca-doped LiSi2N3 is discussed in terms of its crystal structure.
II. EXPERIMENTAL
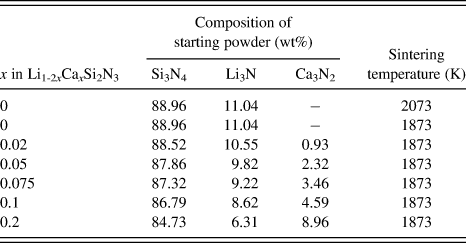
Undoped and Ca-doped LiSi2N3 (Li1-2xCaxSi2N3) were prepared by the reaction of Li3N (>99% purity; Kojundo Chemical Lab. Co., Ltd., Saitama, Japan), α-Si3N4 (SN-E10; UBE Industries, Ube, Japan), and Ca3N2 (Kojundo). Li3N powder, α-Si3N4 powder, and Ca3N2 powder were mixed in silicon nitride mortar. Table I shows the compositions of the starting powders (x = 0–0.2) used in this study. The three powders were mixed in stoichiometric compositions. The mixed powder was placed in a 15-mm–diameter graphite die that was coated with BN powder to prevent the reaction between the powder and the die. All the processes were carried out in a nitrogen-filled glove box. Hot pressing was performed at 1873 or 2073 K for 10 min under a pressure of 30 MPa in a N2 atmosphere (0.10 MPa).
Compositions and sintering temperatures.

The crystal structure of each sample was determined by powder x-ray diffraction (XRD, D8 ADVANCE; Bruker, Karlsruhe, Germany) using Cu Kα radiation. The densities and porosities of the samples were measured using Archimedes’ method with distilled water as the immersion medium. The microstructures of the samples were observed by scanning electron microscopy (SEM, JSM-6700F; JEOL, Ltd., Tokyo, Japan). High-resolution transmission electron microscopy (HRTEM, JEM-4000EX; JEOL) was used to observe the grain boundaries. Composition analysis of the samples by energy-dispersive spectroscopy (EDS, JED-2300T; JEOL) in a device equipped with a field emission transmission electron microscope (FE-TEM, JEM-2100F; JEOL) was also performed.
Both sides of each sintered sample were polished to a 9-μm finish, and Au paste (Tanaka Kikinzoku, Tokyo, Japan) was applied to both sides of the sample by firing at 773 K for 30 min in N2. Subsequently, a circular Pt electrode was attached to each side of the sample before it was mounted on the support tube in a ProboStat (NorECs AS, Oslo, Norway), measurement cell for electrochemical characterization (two-electrode measurements).Reference Dahl, Haugsrud, Lein, Grande, Norby and Einarsrud25, Reference Norby and Hartmanova26 Relatively strong spring loads were applied with alumina parts to hold the assembly together and to maintain contact between the sample and the electrodes. Each sample was heated to the measurement temperature in dry nitrogen and then maintained at this temperature for 0.5 h before the measurement of complex impedance using a Solartron 1260 impedance analyzer (Solartron, Farnborough, UK) equipped with a Solartron 1296 dielectric interface (Solartron, Farnborough, UK). The measurement conditions were as follows: frequency range of 0.1 Hz–10 MHz, applied voltage for impedance measurement of 1 V, temperature range of 298–690 K, and flowing N2 gas atmosphere.
Measurement of the direct current (DC) polarization was also carried out by a potentiostat/galvanostat device (VersaSTAT4; Princeton Applied Research, Oak Ridge, TN) to determine the electronic contribution to total conductivity of sintered sample using Au electrodes as blocking electrodes. A constant DC voltage of 1 V was applied to the hot-pressed samples at room temperature.
III. RESULTS AND DISCUSSION
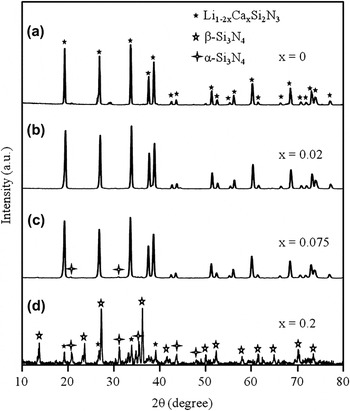
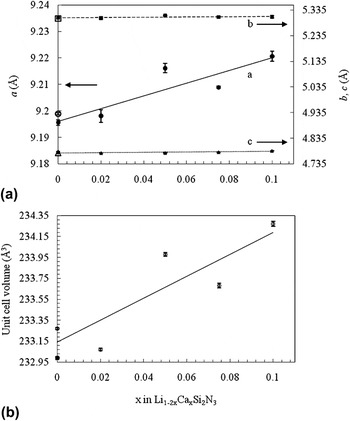
The compositions of the starting powders and the sintering temperatures of the as-hot-pressed Li1-2xCaxSi2N3 materials (x = 0–0.2) are summarized in Table I. All materials were relatively stable in air at room temperature. The serial XRD patterns of Li1-2xCaxSi2N3 (x = 0–0.2) sintered at 1873 and 2073 K are shown in Fig. 1. The XRD analysis indicates that LiSi2N3 is a primary phase in all materials except for Li1-2xCaxSi2N3 (x = 0.2). A small amount of α-Si3N4 exists as a secondary phase in the case of x = 0.075. No other phase except for the primary LiSi2N3 phase and the secondary α-Si3N4 phase was detected by XRD analysis in the case of x = 0–0.075. On the other hand, large amounts of β-Si3N4 phase and α-Si3N4 phase and small amounts of unidentified phases were detected by XRD analysis in the case of x = 0.2. The diffraction patterns of the Li1-2xCaxSi2N3 materials (x = 0–0.1) were similar to the JCPDS Power Diffraction File Card 01-076-0517 (International Centre for Diffraction Data, Newton Square, PA) for crystal LiSi2N3 [wurtzite-type structure (space group Cmc21)]. The lattice parameters and unit cell volume of each sample were obtained by fitting the powder XRD peak data using the LiSi2N3 crystal dataReference David, Laurent, Charlot and Lang7 as an initial model and by using Jade 7 software (Rigaku, Tokyo, Japan). Figures 2(a) and 2(b) depict the variation of the lattice parameters and the unit cell volume of Li1-2xCaxSi2N3 (x = 0–0.1) with increasing Ca2+ concentration, respectively. The lattice parameter a increased with increasing Ca2+ concentration. The lattice is more rigid along the b-axis (b-axis lattice) and c-axis (c axis lattice) than along the a-axis (a-axis lattice) in LiSi2N3 because of the highly covalent Si–N bonds parallel to the b-axis and c-axis (along the Si–N layers). Thus, the incorporation of Ca2+ [ionic radius, 1.00 Å (coordination number CN = 6)] into the significant smaller crystallographic site of Li+ [ionic radius, 0.76 Å (CN = 6)] in the host LiSi2N3 lattice resulted in the lattice parameter a being increased the most. The overall expansion of the lattice volume occurred by the incorporation of Ca2+ ions. The total change in lattice volume is ∼0.4% from x = 0 to 0.1 [Fig. 2(b)]. Judging from the XRD patterns shown in Fig. 1 and the scattering data of the lattice parameters and volumes shown in Fig. 2, the solid solution range x appears to be 0–0.05. On the other hand, the lattice parameters and unit cell volume did not change with increasing sintering temperature in the case of Li1-2xCaxSi2N3 (x = 0).
X-ray diffraction patterns of Li1-2xCaxSi2N3 (x = 0–0.2) sintered at (a) 2073 K and (b)–(d) 1873 K.

(a) Lattice parameters of Li1-2xCaxSi2N3 (x = 0–0.1) sintered at 1873 K [a (●), b (■), and c (▲)] and 2073 K [a (○), b (□), and c (△)] as functions of x, and (b) the unit cell volume for Li1-2xCaxSi2N3 (x = 0–0.1) sintered at 1873 K (○) and 2073 K (●) as functions of x.

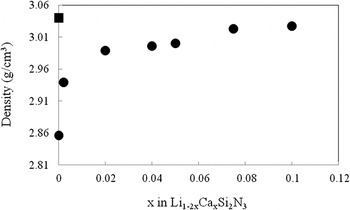
Figure 3 shows the variation of the density of Li1-2xCaxSi2N3 (x = 0–0.1) with increasing Ca2+ concentration. The results illustrate that highly dense Li1-2xCaxSi2N3 ceramics can be obtained by Ca doping at 1873 K. Density increased with increasing Ca2+ concentration. The density of Li1-2xCaxSi2N3 (x = 0.075) sintered at 1873 K and Li1-2xCaxSi2N3 (x = 0) sintered at 2073 K was almost the same. These results indicate that Ca doping promotes the densification of LiSi2N3. The porosity of Li1-2xCaxSi2N3 (x = 0.075) sintered at 1873 K and Li1-2xCaxSi2N3 (x = 0) sintered at 2073 K was ∼1%.
Density of Li1-2xCaxSi2N3 (x = 0–0.1) solid electrolytes sintered at 1873 K (●) and 2073 K (■) as a function of x.

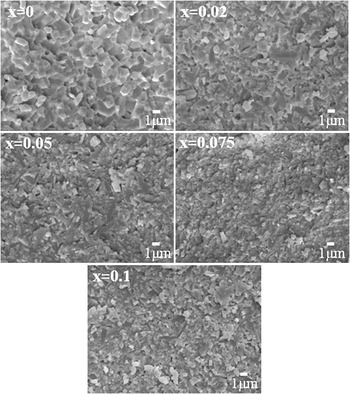
The microstructures of the as-hot-pressed materials are shown in Fig. 4. No abnormal grain growth was observed, and the grains had an almost equiaxed form and were ∼0.5–1 μm in diameter. The absence of residual porosity in the SEM images of all materials indicates that they were almost fully densified.
Scanning electron microscopy images of fracture surface of sintered bodies of Li1-2xCaxSi2N3 (x = 0–0.1) solid electrolytes sintered at 1873 K.

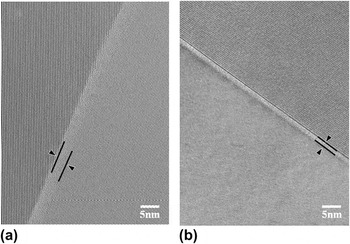
To investigate the grain boundary chemistry in detail, HRTEM was used. Figure 5 shows transmission electron microscopy (TEM) images of a grain boundary in the dense Li1-2xCaxSi2N3 ceramic (x = 0, sintered at 2073 K) and the dense Li1-2xCaxSi2N3 ceramic (x = 0.075, sintered at 1873 K). The high-magnification images of both materials revealed that an intergranular glassy film existed at grain boundaries. The thicknesses of this film in dense Li1-2xCaxSi2N3 (x = 0, sintered at 2073 K) and dense Li1-2xCaxSi2N3 (x = 0.075, sintered at 1873 K) were almost 5 and 2 nm, respectively. This indicates that the thickness of the intergranular glassy film tended to decrease with Ca doping. Because Ca2+ is known to be a potent silica network modifier, causing a decrease in viscosity of several orders, it is expected that the addition of Ca2+ will decrease the steric repulsive force between grains and cause a reduction in the film thickness.Reference Tanaka, Kleebe, Cinibulk, Bruley, Clarke and Ruhle27 The decreasing thickness of the amorphous grain boundary layer with Ca2+ doping also suggests that Ca additives increase the oxygen content in the LiSi2N3 grains.
High-resolution transmission electron microscopy image of a grain boundary in (a) Li1-2xCaxSi2N3 (x = 0, sintered at 2073 K) and (b) Li1-2xCaxSi2N3 (x = 0.075, sintered at 1873 K).

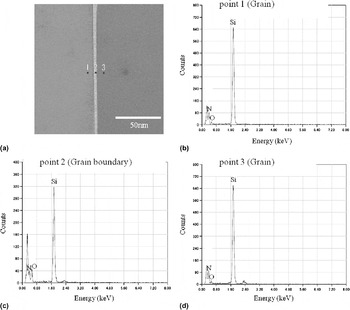
EDS point elemental analysis using an FE-TEM with a focused electron beam size of ∼1 nm was performed to examine the distribution of dopant Ca2+ cations in dense Li1-2xCaxSi2N3 (x = 0, sintered at 2073 K) and dense Li1-2xCaxSi2N3 (x = 0.075, sintered at 1873 K). The spatial resolution available using the FE-TEM in this study was ∼2–3 nm. The results of TEM-EDS analysis for dense Li1-2xCaxSi2N3 (x = 0, sintered at 2073 K) and dense Li1-2xCaxSi2N3 (x = 0.075, sintered at 1873 K) are shown in Figs. 6 and 7, respectively. The peak at ∼0.3 keV observed in Figs. 6 and 7 is a carbon peak due to the carbon coating on the samples used to prevent charging. The carbon peak intensity changes with the amount of the carbon and sample thickness. The EDS analysis indicates that elemental Si, O, and N are present in the grain boundary glassy phase, and by comparing the three EDS plots shown in Figs. 6(b)–6(d) for points 1, 2, and 3, respectively, it can be seen that the oxygen concentrates in the grain boundary regions. These results indicate that a silicate-based Si–O–N glassy phase was formed at the grain boundaries of Li1-2xCaxSi2N3 (x = 0, sintered at 2073 K). The oxygen probably originates from the raw Si3N4 powder because it contained oxygen, which mainly existed as SiO2 on the surface of the powder.Reference Greil, Nitzsche, Friedrich and Hermel28, Reference Bermudo, Osendi and Fierro29 The oxygen in LiSi2N3 might also originate from the Li3N powder.
(a) Transmission electron microscopy (TEM) image of grains and grain boundary in the Li1-2xCaxSi2N3 ceramic (x = 0, sintered at 2073 K), and energy-dispersive spectroscopy (EDS) for (b) point 1 (grain), (c) point 2 (grain boundary), and (d) point 3 (grain).

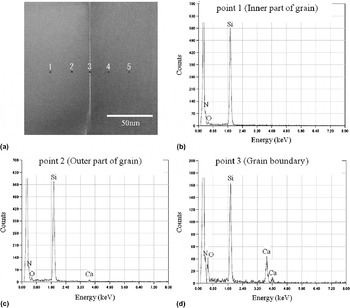
In Fig. 7, the EDS spectra for points 4 and 5 were omitted, because they were similar to those for points 2 and 1, respectively. By comparing the three EDS plots shown in Figs. 7(b)–7(d) for points 1–3, respectively, it can be seen that Ca and O exist with a high concentration at the grain boundaries (point 3) of Li1-2xCaxSi2N3 (x = 0.075). The EDS analysis indicates that elemental Ca, Si, O, and N are present in the grain boundary glassy phase. These results indicate that a silicate-based Ca–Si–O–N glassy phase was formed at grain boundaries of Li1-2xCaxSi2N3 (x = 0.075, sintered at 1873 K). In this case, not only Si3N4 and Li3N but also Ca3N2 may be an oxygen source for Li1-2xCaxSi2N3. Figure 7 clearly shows that most of the Ca added in the starting materials precipitates at the amorphous grain boundaries, indicating that the solid solution limit x for Li1-2xCaxSi2N3 is far from x = 0.075.
(a) TEM micrograph of grains and grain boundary in the Li1-2xCaxSi2N3 ceramic (x = 0.075, sintered at 1873 K) and EDS spectra for (b) point 1 (inner part of grain), (c) point 2 (outer part of grain), and (d) point 3 (grain boundary).

The EDS analysis also indicates that Ca2+ is present in the grain interior (point 2). This suggests that Ca2+ is incorporated into the LiSi2N3 host lattice. The calcium content for the inner part of the grain (point 1) was lower than that for the outer part (point 2). These results indicate that the chemical compositions of the inner and outer parts of Li1-2xCaxSi2N3 grains are different, with Ca cations existing in a higher concentration at the outer part of Li1-2xCaxSi2N3 grains. No Ca peak is observed at the inner part of the grain (point 1) [Fig. 7(b)]. The detection limit of Ca in the EDS analysis is ∼1 wt% (10,000 ppm) in this study; thus, the calcium content for the inner part of the grain (point 1) must be lower than 1 wt% (10,000 ppm).
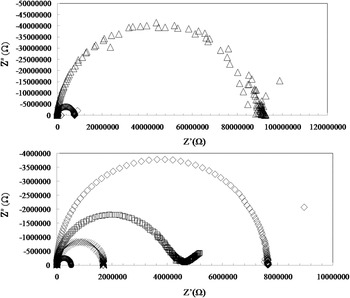
The complex impedance was measured to determine the conductivity. In general, the alternating current impedance of an ionic conductor measured by a two-probe method contains contributions from the grain interior, the grain boundaries, and the electrode–electrolyte interface, which can be illustrated in the complex plane by three successive arcs.Reference Li, Liu, Gong, Chen, Tang and Zhang30, Reference Zhan, Ma, Chen, Luo, Kong and Chan31 The arc at the high-frequency end of the spectrum represents the grain-interior resistivity, that at the middle of the spectrum is a consequence of the grain-boundary effect, and the low-frequency arc is assigned to the electrode response. In practice, however, not all these arcs can be observed, depending on the nature of the sample and the measurement conditions.
Figure 8 shows typical complex impedance diagrams for Li1-2xCaxSi2N3 (x = 0–0.075, sintered at 1873 K) and Li1-2xCaxSi2N3 (x = 0, sintered at 2073 K) recorded at 490 K in N2. One semicircular arc was observed for all materials. The shape of the arc changes with the concentration of calcium (x) in Li1-2xCaxSi2N3. In this context, the semicircular arc is attributed to Li1-2xCaxSi2N3 grains and grain boundaries. The total conductivity of each sample was estimated from the intersections between the extrapolated semicircular arc and the real axis.
Impedance spectra (recorded at 490 K in N2) of Li1-2xCaxSi2N3 [x = 0 (▫), x = 0.02 (△), x = 0.05 (◇), and x = 0.075 (○)] sintered at 1873 K and Li1-2xCaxSi2N3 [x = 0 (×)] sintered at 2073 K.

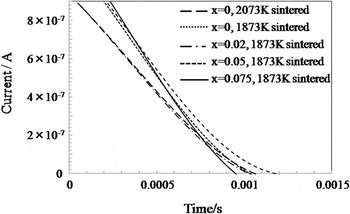
Figure 9 shows the time dependence of DC current at room temperature for Li1-2xCaxSi2N3 (x = 0–0.075, sintered at 1873 K) and Li1-2xCaxSi2N3 (x = 0, sintered at 2073 K) ceramics. A constant voltage of 1 V was applied to these ceramics for 1800 s using Au-blocking electrodes to determine the electronic contribution. These ceramics were initially polarized and then the current was drastically decreased within a very short time. The steady current after polarization could not be determined clearly because the current was too small to be measured by the potentiostat/galvanostat device used in this study. These results indicates that the electronic conductivities of Li1-2xCaxSi2N3 (x = 0, 2073 K sintered) ceramics and Li1-2xCaxSi2N3 (x = 0–0.075, 1873 K sintered) ceramics were negligibly small. Moreover, Yamane et al.Reference Yamane, Kikkawa and Koizumi4 reported that the electronic conductivity of LiSi2N3 was less than 1% of the total conductivity at temperatures between 423 and 673 K. The experimental conditions of their study were almost the same as in this study. In addition, the mobility of calcium ions is generally negligibly small.Reference Gruener, De Sousa Meneses, Odier and Loup32 Thus, we believe that most of the conductivity of the Li1-2xCaxSi2N3 (x = 0–0.075) materials obtained in this study is caused by the migration of lithium ions.
Charge in current relative to time after applying a constant direct current voltage of 1 V to the Li1-2xCaxSi2N3 ceramic (x = 0–0.075, sintered at 1873 K) and the Li1-2xCaxSi2N3 ceramic (x = 0, sintered at 2073 K).

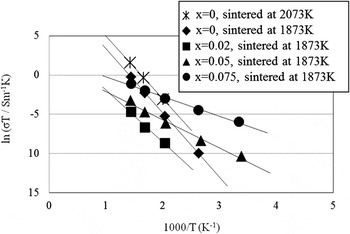
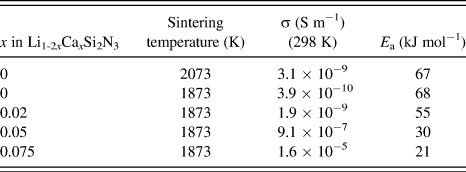
Figure 10 shows the temperature dependences of the ionic conductivity for all the Li1-2xCaxSi2N3 (x = 0–0.075) materials considered in this study. As shown in Fig. 10, the plots of ln(σT) against 1000/T were found to be linear and to closely fit the Arrhenius equation σT = A exp(−E a/RT), where A is the pre-exponential factor, E a is the activation energy for conduction, and R is the gas constant. Table II summarizes the conductivities at room temperature (298 K) and the activation energies of conduction. The conductivities at 298 K for Li1-2xCaxSi2N3 (x = 0, sintered at 2073 K) and Li1-2xCaxSi2N3 (x = 0–0.02, sintered at 1873 K) were estimated by extrapolating the lines representing conductivity in Fig. 10 to 298 K. The conductivities at room temperature of samples with x = 0.1 and 0.2 were smaller than that of the sample with x = 0.075. This reduction in conductivity may have been caused by the impurity phases as shown in Fig. 1(d).
Temperature dependences of ionic conductivities of Li1-2xCaxSi2N3 (x = 0, sintered at 2073 K) and Li1-2xCaxSi2N3 (x = 0–0.075, sintered at 1873 K).

Ionic conductivities and activation energies of Li1-2xCaxSi2N3 (x = 0–0.075).

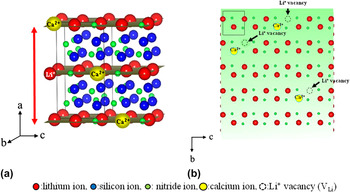
The ionic conductivity increased with increasing sintering temperature and material density, as shown by the results for Li1-2xCaxSi2N3 (x = 0, sintered at 1873 K) and Li1-2xCaxSi2N3 (x = 0, sintered at 2073 K). The high ionic conductivity of Li1-2xCaxSi2N3 (x = 0, sintered at 2073 K) may have been caused by the increased density of the sintered sample, which enhances grain boundary conductivity. However, the activation energy for conduction hardly changed with increasing sintering temperature and material density. On the other hand, the activation energy for conduction gradually decreased with increasing Ca content. Upon increasing the amount of Ca (x) in Li1-2xCaxSi2N3 from x = 0 to 0.075, the activation energy decreased from 67 to 21 kJ/mol. The decrease in activation energy caused the enhancement of ionic conductivity at room temperature. At 298 K, the ionic conductivity of densified Li1-2xCaxSi2N3 (x = 0.075, sintered at 1873 K) ceramic was 1.6 × 10⁻⁵ S m−1, almost four orders of magnitude higher than that of the densified Li1-2xCaxSi2N3 ceramic (x = 0, sintered at 2073 K) of 3.1 × 10⁻⁹ S m−1. The decrease in activation energy and the enhancement of ionic conductivity at room temperature are caused by the incorporation of Ca2+ into the host LiSi2N3 lattice. As mentioned earlier, the lattice parameter a and the unit cell volume increased with increasing Ca2+ concentration. Thus, the framework of LiSi2N3 becomes less rigid [Fig. 11(a)]. This decreases the interaction between the ions and increases the number of defects in the structure. This increases the Li+ mobility. In addition, the incorporation of aliovalent substitutional Ca2+ ions in the LiSi2N3 lattice is expected to create Li+ vacancies (VLi) for charge compensation (Li1-2xCaxVLiSi2N3), thereby increasing the Li+ mobility [Fig. 11(b)]. The decrease in the thickness of the amorphous grain boundary layer upon Ca doping shown in Fig. 5 also suggests that Ca2+ ions increase the oxygen content in the LiSi2N3 grains. O2− may substitute for N3− in the LiSi2N3 structure. The substitution of O2− for N3− is expected to create Li+ vacancies for charge compensation, leading to increased Li+ conductivity in the LiSi2N3 grains.
Schematic illustration of changes occurring in the LiSi2N3 crystal structure upon doping Ca2+ cations: (a) the framework of LiSi2N3 becomes less rigid and (b) Li+ vacancies (V Li) are created for charge compensation.

Although lithium could not be detected by EDS, we cannot rule out the possibility that the change in the grain boundary structure upon Ca doping might change the grain boundary conductivity and the total conductivity. The decrease in grain boundary thickness due to Ca doping shortens the length of Li pathways between grains, thereby making it easier for Li+ ions to migrate between grains.
IV. CONCLUSIONS
In this study, the effect of Ca doping on the ionic conductivity of LiSi2N3 (Li1-2xCaxSi2N3) was studied. The incorporation of Ca2+ into the significantly smaller crystallographic site of Li+ in the host LiSi2N3 lattice increased the lattice parameter a. The change in the total lattice volume was ∼0.4% from x = 0 to 0.1. TEM-EDS results indicated that a silicate-based Ca–Si–O–N glassy phase was formed at the grain boundaries of Li1-2xCaxSi2N3 (x = 0.075, sintered at 1873 K). The activation energy for Li ionic conduction gradually decreased with increasing Ca content. Upon increasing the amount of Ca (x) in Li1-2xCaxSi2N3 from 0 to 0.075, the activation energy decreased from 67 to 21 kJ/mol. At 298 K, the ionic conductivity of densified Li1-2xCaxSi2N3 (x = 0.075, sintered at 1873 K) ceramic reached 1.6 × 10⁻⁵ S m−1, almost four orders of magnitude higher than that of densified Li1-2xCaxSi2N3 (x = 0, sintered at 2073 K) ceramic (3.1 × 10⁻⁹ S m−1).