Implications
We have developed a new method for the indirect estimation of short-term individual forage intake in sheep based on frequently measuring changes in BW. Our ultimate goal is to establish methods for determining feed efficiency of freely grazing ruminants to glean new insights into within-flock variability of this trait. The auto-weighing device developed for this study will also enable frequent and automated individual BW monitoring, saving both time and labor.
Introduction
Measuring the amount of forage consumed by grazing ruminants (i.e. individual forage intake) is one of the most challenging issues in livestock production (Coates and Penning, Reference Coates and Penning2000). This severely limits efforts aimed at measuring individual feed intake and efficiency of grazing ruminants for management purposes and to determine within-flock variability for genetic selection.
Several methods for measurement of pasture intake have been used experimentally including pasture biomass disappearance and chemical markers (Penning, Reference Penning2004) including n-alkanes (Dove and Mayes, Reference Dove and Mayes2006), polyethylene glycol (Hassoun et al., Reference Hassoun, Viudes, Autran, Bastianelli and Bocquier2013) and chromic oxide (Barlow et al., Reference Barlow, Ellis, Williamson, Costigan, Stephenson, Rose and Mears1988). Biomass disappearance is used to estimate intake of pasture by individuals when there is one animal per measured grazing area and chemical markers require dosing, fecal sample collection, processing, and laboratory extraction or digestion and measurement. Despite progress with these methods, factors including cost, labor and variability in accuracy and/or precision depending upon the prevailing conditions make their widespread application impractical and has restricted their adoption.
The present experiment is the first stage in a program of work that aims to estimate intake of forage by freely grazing ruminants. The objective of the present experiment was to determine, under very controlled conditions, the accuracy of a method for estimating individual daily feed intake in sheep based on differences in BW measurements before and after feeding. We used the ewe as experimental model, and hypothesized that differences in two successive BW measures on the same individual before and after each meal would accurately correlate to the amount of feed consumed within specified periods. To test this hypothesis a simple, practical system that enabled systematic, voluntary and automated weighing of ewes was developed, and the BW difference method validated against actual feed intake measured using automated, electronic feeders.
Material and methods
Experimental site and animals
The study was conducted at the Institut National de la Recherche Agronomique (INRA) Experimental Farm La Fage, Causse du Larzac (43°54'54.52"N; 3°05'38.11"E; ~800 m altitude), Roquefort-sur-Soulzon, Aveyron, France. Use of animals and procedures were approved by the Regional Ethics Committee ‘Science et santé animals’ (no. 115; file reference 2016031819254696), Toulouse, France.
A total of 24 Romane meat breed ewes were chosen from the research station flock 2 months before mating at the end of summer during September. The ewes were distributed into two homogeneous groups (n=12 ewes per group) according to parity, ensuring the groups were balanced for BW and body condition score (BCS): hogget ewes (HOG; mean±SD 1.5 years old±1 month; BW 51.8±2.8 kg; BCS 2.6±0.2) and adult or multiparous ewes (ADU; 3.5 years old±1 month; BW 60.4±8.5 kg; BCS 2.7±0.8). Both parity groups were housed together. Parity, BW and BCS were used as selection criteria for the ewes with the aim of creating variation in voluntary feed intake.
Experimental design, management and measurements
Once the ewes were selected according to parity, BW and BCS criteria, they were moved from the research station’s rangeland system (González-García et al., Reference González-García, Gozzo de Figuereido, Foulquie, Jousserand, Autran, Camous, Tesniere, Bocquier and Jouven2014) at the beginning of November, to a confined pen with straw-bedding (total area of ~80 m²). The pen was divided into two separate areas: one area with individual feeders and the second area with access to water and mineral salts. Ewes had access to 24 individual automatic feeders (0.4 m wide×0.5 m long×0.4 m depth) (Bompa et al., Reference Bompa, Ricard and Bodin2013). Each ewe was fitted with an electronic identifier recognized by only one feeder within the pen. Ewes were adapted to the feeding system as described below.
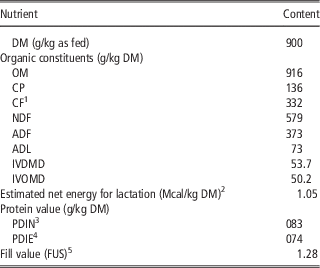
The study was conducted for 28 days (10 November to 7 December) which included a 21-day adaptation period and a 7-day intake measurement period. The 3-week adaptation period allowed ewes to acclimate to the general environment of the housing facility and to be trained to use the electronic and automatic feeders, each of which were fitted with an electronic ‘open-close’ gate system that allowed access to the feed bins. Each ewe had access to one specific feeding station only throughout the study. After each feeding bout the gate of the feeding bin closed automatically. During the first 2 weeks of acclimation, first-cut hay comprising ~50% alfalfa (Medicago sativa), 35% cocksfoot (Dactylis glomerata) and 15% ryegrass (Lolium perenne) was offered, the nutritive values of which are in Table 1. During this period hay was provided ad libitum using a belt feeder. Once ewes had adapted to the feeding system, hay was then offered within manually filled feed bins placed on top of the feeding belt used previously. The feed was offered twice daily: at 0830 h (60% of the allowance) and at 1430 h (40% of the allowance). During the final week of the adaptation phase (day 15 to 20) when ewes were well-adapted, measurement of daily individual feed intake commenced. The automatic feeding system allowed adjustment to a precise quantity of feed on offer for each ewe on each day in accordance with its intake level. The allowance was continually adjusted to 115% of the previous day’s voluntary intake. Ewes also had continuous access to fresh water and mineral salts.
Nutritive content of the first-cut hay comprising 50% alfalfa (Medicago sativa), 35% cocksfoot (Dactylis glomerata) and 15% ryegrass (Lolium perenne) fed to ewes

DM=dry matter; OM=organic matter; IVDMD=in vitro dry matter disappearance; IVOMD=in vitro dry organic matter disappearance
1 Crude fiber content.
2 Net energy for lactation (NEL). In INRA system: Unité Fourragère du Lait (UFL); 1 UFL=1.7 Mcal of NEL. The hay fed had 0.62 UFL (=1.05 Mcal).
3 Protein truly digestible in the small intestine when nitrogen is limiting microbial synthesis in the rumen=PDIA (dietary protein undegraded in the rumen which is digestible in the small intestine)+PDIMN (microbial protein synthesized from the rumen degraded dietary N when energy is not limiting).
4 Protein truly digestible in the small intestine when fermentable energy is limiting=PDIA+PDIME (microbial protein synthesized from the energy available in the rumen when degraded N is not limiting).
5 Fill unit for sheep. By definition, 1 kg DM of a reference young pasture grass has a ‘fill value’ of 1 fill unit both in sheep (FUS) and in cattle (FUC). Thus, a value lower or higher than 1 means that the forage (or ration) has a lower or higher fill value, respectively, compared with the reference pasture grass (Jarrige et al., Reference Jarrige, Demarquilly, Dulphy, Hoden, Robelin, Beranger, Geay, Journet, Malterre, Micol and Petit1986).
Calibration of the method for daily individual feed intake determination based on differences in BW
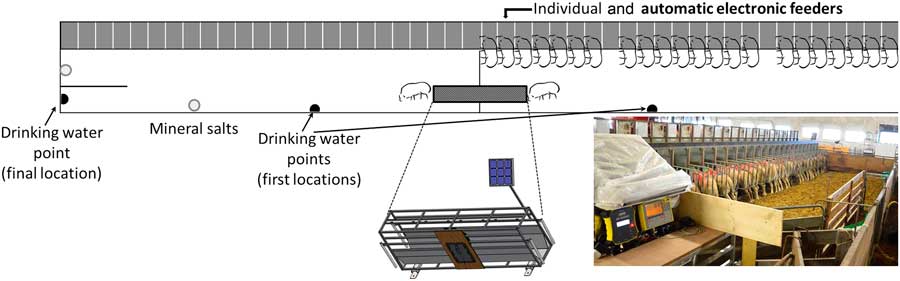
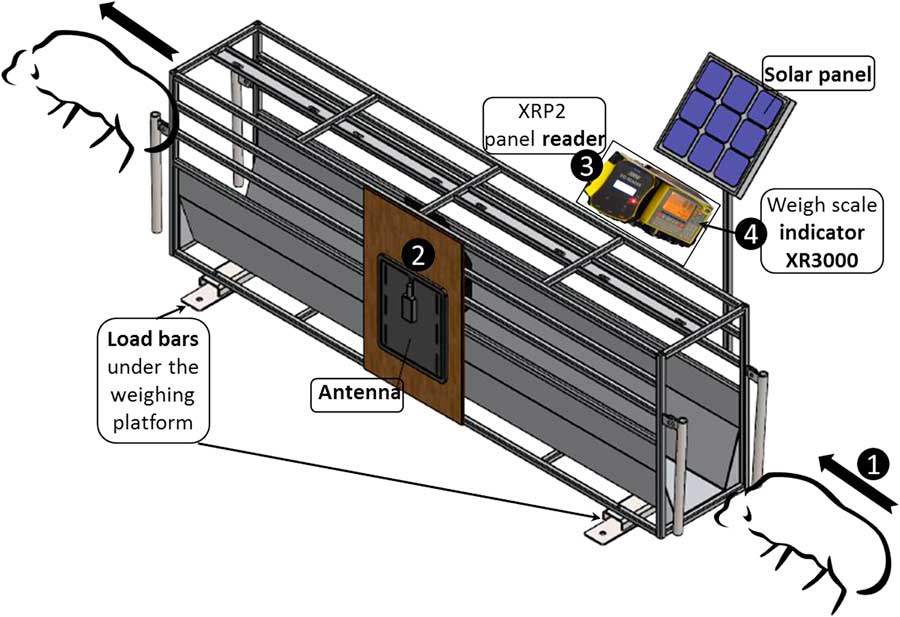
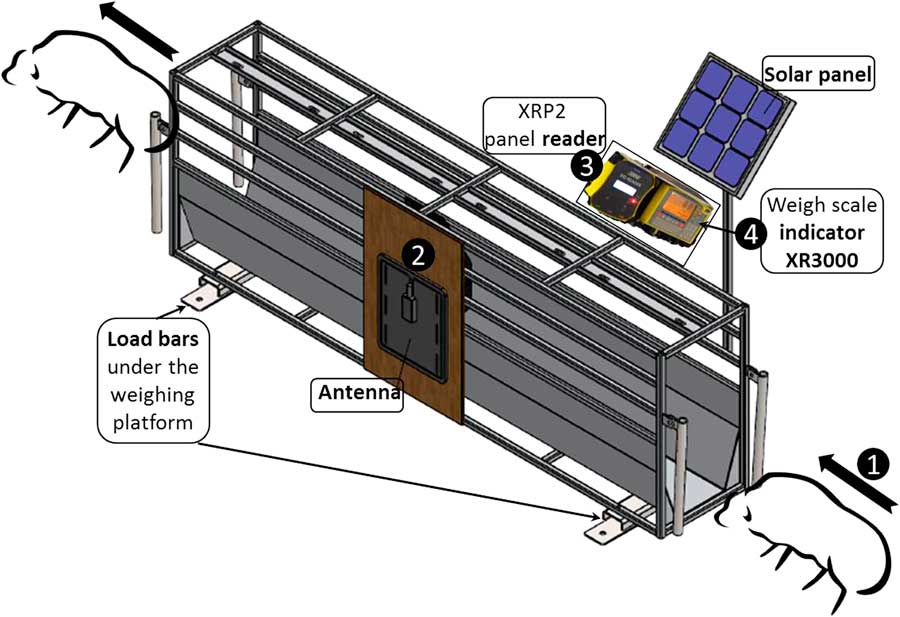
The experimental setting and design used for calibration of the new method of estimating individual feed intake based on differences in BW is illustrated in Figure 1. During the adaptation period, the drinking water points were located in the pen where ewes had access to hay. However, during the feed intake measurement period (day 21 to 28) the ewes could only access water and mineral salts used as attractants by walking through an automatic Walk-over-Weighing (WoW) device (TRU-TESTTM, Auckland, New Zealand; released by Marechale Pessage, Chauny, France) specifically designed for the experiment (Figure 2).
Schematic representation of the experimental facilities set up for calibrating the methodology for individual feed intake estimation using automated weighing. The pen with 48 individual and automatic feeders’ places was divided by two. A total of 24 ewes were individually fed in one half of the pen (24 feeders). In the other half of the pen the water point and mineral salts were used as attractants. When ewes were thirsty they walked voluntarily throughout the Walk-over-Weighing unit. The actual feed intake was measured at the automatic feeders and compared with differences in individual BWs between two successive passages through the unit within a fixed time frame.

Illustration of the portable, mobile sheep Walk-over-Weighing (WoW) platform specifically designed for this experiment. (1) The animals enter the WoW unit voluntarily, (2) the antenna reads the animal electronic identification (ID) tag, (3) sends it to the XRP2 panel reader which records ID tags into a session file which (4) ID is sent directly to the weigh scale indicator XR3000 to record individual animal BW and other information, for example day of the experiment, hour. The operator downloads the stored files with the individual BW information for further processing and interpretation.
Feed intake for the 1-h morning and afternoon feeding periods were measured using the automatic feeders (Bompa et al., Reference Bompa, Ricard and Bodin2013) and compared with the indirect feed intake estimates based on differences in BW. Each ewe was weighed before each meal (BWbefore, kg) by allowing ewes to pass through the WoW unit; 1 h after the start of each meal the ewes were again weighed using the WoW unit (BWafter, kg). At this time, the ewes were manually forced to pass one by one through the WoW unit. The morning and afternoon measurements were made from day 21 to 28. For each feeding period, the difference in BW (∆BW) for each ewe was used as the estimate of the amount of hay consumed during the hour from commencement of feeding. The ∆BW (kg) value was compared with the actual feed intake (H intake, kg) calculated using the automatic feeder as the difference between the weight of hay offered (H before) and residual hay remaining after 1 h (H after). The equations used were:
Hay intake measured in the automatic electronic feeder during the 1 h period from commencement of feeding:
 $$H_{{{\rm intake}}} \left( {\rm g} \right)\,{\equals}\,H_{{{\rm before}}} \left( {{\rm kg}} \right)-H_{{{\rm after}}} \left( {{\rm kg}} \right)$$
Hay intake measured as the difference in BW using the indirect WoW method:
 $$\Delta {\rm BW}\,\left( {\rm g} \right)\,{\equals}\,{\rm BW}_{{{\rm after}}} \left( {{\rm kg}} \right)-{\rm BW}_{{{\rm before}}} \left( {{\rm kg}} \right)$$
Other measurements and derived variables
In addition to measuring H intake at each meal, intake of hay per day was calculated (H intake24) using the data from the automated feed bins. During the adaptation and measurement period, ewes were also weekly weighed using a conventional scale (Weighing scale 300 kg – UO1896-, Société AGID, Dijon, France). A trained observer assessed BCS using the six-point scale of Russel et al. (Reference Russel, Doney and Gunn1969). Plasma was sampled (n=4 samples/ewe) to determine metabolite and metabolic hormone profiles associated with energy metabolism at the start (arrival of ewes to the confined shed), mid-point, and end of the adaptation period (equivalent to the start of the feed intake measurement period), and at the end of the feed intake measurement period. These metabolic profile measurements were used to indicate whether the ewes maintained normal physiological profiles while in the confined conditions of the experiment.
Blood was sampled by jugular venipuncture before the first meal at ~0800 h on each sampling day (González-García et al., Reference González-García, Gozzo de Figuereido, Foulquie, Jousserand, Autran, Camous, Tesniere, Bocquier and Jouven2014, Reference González-García, Tesniere, Camous, Bocquier, Barillet and Hassoun2015). Two 9 ml blood samples were drawn from each ewe; one tube with 18 IU of lithium heparin per 1 ml blood, and one tube with 1.2 to 2 mg of potassium EDTA per 1 ml blood (Vacuette® Specimen Collection System; Greiner Bio-One GmbH, Austria). Samples were immediately placed on ice before centrifugation at 3600×g for 20 min at 4°C. The plasma was collected and stored at −20°C in individually identified aliquots of 3 µl for metabolite and hormone analyses.
Plasma non-esterified fatty acids (NEFA) concentration was measured in duplicate using the commercially available Wako NEFA-HR(2) R1 and R2 kit (Wako Chemicals GmbH, Neuss, Germany) adapted for 96-well microplates. Intra- and inter-assay variation averaged 6.7% and 4.1%, respectively. Plasma glucose concentration was measured in triplicate using a commercially available glucose GOD-PAP kit (reference LP87809; Biolabo SAS, Maizy, France) adapted for 96-well microplates. Intra- and inter-assay variation averaged 2.1% and 2.1%, respectively. Plasma insulin concentration was measured in duplicate using a commercially available RIA kit (Insulin-CT; MP Biomedicals, Solon, OH, USA). Intra- and inter-assay variation averaged 7.3% and 4.7%, respectively.
Statistical analyses
Data were analyzed using the mixed-effects model PROC MIXED; means were calculated using least squares means (LSMeans), and the Bonferroni adjustment for multiple comparisons using SAS® statistical package (version 9.4; SAS Institute Inc.; Cary, NC, USA).
Two statistical models were used. The first model, for analyzing effects on BW, BCS, plasma profiles and the daily hay intake (H intake24), included the parity, the date of measurement and their first order interactions, as fixed effects.
The general statistical model was:
 $$Y_{{ijkl}} \,{\equals}\,\mu {\plus}{\rm Parity}_{i} {\plus}{\rm Dates}_{j} {\plus}{\rm Ewe}_{{ijk}} {\plus}\left( {{\rm Parity}{\times}{\rm Dates}} \right)_{{ij}} {\plus}{\epsilon}_{{ijkl}} $$
where Y ijkl is BW, BCS, plasma metabolite or hormone, or H intake24 at Dates j on Ewe k in Parity i, µ is the overall mean, Parity i is a fixed effect of parity i (i=1 or 2), Dates j is a fixed effect of dates j (j=1 to 8), Ewe ijk is a random effect of ewe k at Dates j in Parity i (Parity×Dates) ij is a fixed interaction effect of Parity i with Dates j, and ε ijkl is random error at Dates j on Ewe k in Parity i.
The second statistical model was used for analyzing effects on H intake or ∆BW (estimated around the two meals, i.e. morning and afternoon) and included the parity, the dates of measurement, the time of feeding and their first order interactions, as fixed effects.
The statistical model was:
 $$\eqalignno{ Y_{{ijklm}} \,{\equals}\, & \mu {\plus}{\rm Parity}_{i} {\plus}{\rm Dates}_{j} {\plus}{\rm Ewe}_{{ijk}} {\plus}{\rm Time}\,{\rm of}\,{\rm feeding}_{l} \cr & {\plus}\left( {{\rm Parity}{\times}{\rm Dates}} \right)_{{ij}} {\plus}\left( {{\rm Parity}{\times}{\rm Time}\,{\rm of}\,{\rm feeding}} \right)_{{il}} \cr & {\plus}\left( {{\rm Dates}{\times}{\rm Time}\,{\rm of}\,{\rm feeding}} \right)_{{jl}} {\plus}{\epsilon}_{{ijklm}} $$
where Y ijklm is BW, BCS, plasma metabolite or hormone, or intake at Dates j (and/or Time of feeding) on ewe k in Parity i, µ is the overall mean, Parity i is a fixed effect of parity i (i=1 or 2), Dates j is a fixed effect of Dates j (j=1 to 8), Ewe ijk is a random effect of ewe k at Dates j in parity i, Time of feeding l is a fixed effect of the time of feeding (l=AM or PM), (Parity×Dates) ij is a fixed interaction effect of Parity i with Dates j, (Parity×Time of feeding) il is a fixed interaction effect of Parity i with Time of feeding l (Dates×Time of feeding) jl is a fixed interaction effect of Dates j with Time of feeding l, and ε ijklm is random error at Dates j on Ewe k in parity i.
In both models, the day of the experiment (Dates) were used as repeated measurements, and the Ewe was included as a random term. The thresholds for significance and tendency toward significance were, respectively, P<0.05 and <0.10.
To analyze the suitability of the WoW system to predict feed intake during the first (AM) and second (PM) meals of the day, a mixed-effects linear regression model was also used. The model contained feed intake measured using the electronic feeders as the dependent variable. The independent variables considered were BW change between pre-feeding and post-feeding (∆BW) as a continuous (linear) variable, and the categorical variables of date, time of feeding within date and parity, with all possible first order interactions between the continuous and categorical variables. Ewe was considered a random effect and correlated measures on each ewe were modeled through double repeated measures of date and of time of feeding within date. The denominator degrees of freedom were determined using the Kenward-Roger method. All non-significant factors (P>0.05) were removed from the model. Observed intake was regressed against predicted intake from the above model using linear least squared regression to determine the accuracy of the proposed method through the intercept, regression coefficient and the coefficient of determination. The intercept and regression coefficient were tested with the null hypothesis of a perfect fit between model-predicted and observed values (intercept=0 and regression coefficient=1; Tedeschi, Reference Tedeschi2006).
The suitability of the covariance structures of repeated measures (compound symmetry, CS; unstructured, UN; and first order autoregressive plus random effect, AR(1)+RE) were objectively compared using the goodness of fit criteria produced by PROC MIXED, including the REML log likelihood (REML logL), Akaike information criterion (AIC), and Schwarz Bayesian criterion (SBC). The covariance structures yielding the lowest AIC value were chosen for each variable under study in order to evaluate the variances at individual Dates, and the correlations between measurements at different times on the same ewe. According to those criteria, the AR(1) yielded the best results and was used.
Results
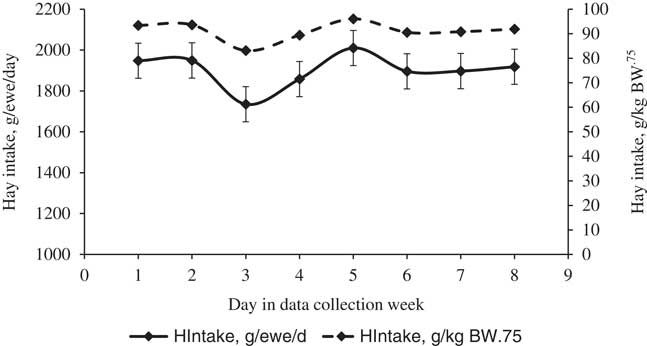
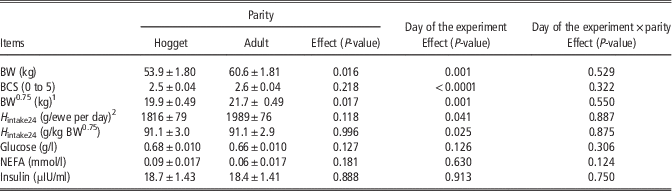
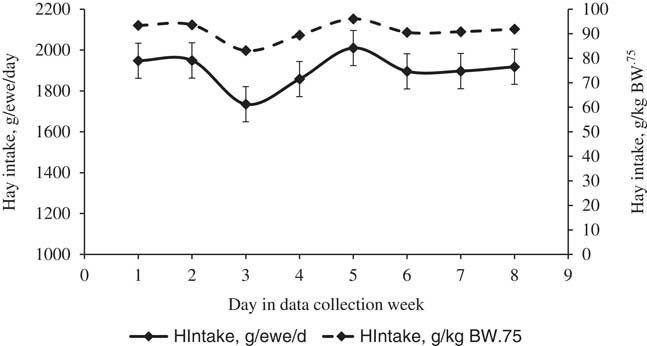
Results for the feed intake measurement period are presented in Table 2. The BW was higher (P<0.016) in ADU compared with HOG ewes, but no differences in BCS were evident due to parity (P=0.218). Actual daily hay intake (H intake24) was not different (P=0.118) between ADU and HOG ewes or when assessed relative to metabolic BW (BW0.75, P=0.996). The H intake24 was affected by the day of the experiment, but this was a consequence of a decline in water intake on one specific day (day 3, see Figure 3) due to a change in the watering system for ewes, that also resulted in reduced hay intake on that day.
Average daily hay intake (H intake24) during the week of data collection. A decline in intake on the 3rd day of measurements was due to a change in the drinking water point within the pen.
Body weight, body condition score, intake and metabolic characteristics (LSmean±SEM) of hogget and adult Romane ewes individually fed hay

BCS=body condition score; NEFA=non-esterified fatty acids
1 Metabolic BW.
2 Hay intake measured in the automatic electronic feeder during 24 h.
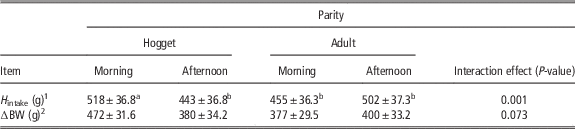
Plasma metabolic profiles of glucose, NEFA and insulin were not affected by parity or day of the experiment (all P⩾0.126, Table 2). In all cases, the first order interactions between parity and day of the experiment of data collection were not significant (all P⩾0.124). Interactions between parity and time of feeding on H intake or ∆BW are shown in Table 3. There was a parity×time of feeding interaction for H intake and there tended to be an interaction between these factors for ∆BW (Table 3). The H Intake was higher (P<0.001) and ∆BW tended (P=0.073) to be higher in the morning in the HOG group whereas in ADU no differences were observed in H intake between morning and afternoon but ∆BW tended to be higher (P=0.07) for the afternoon meal (Table 3). Similarly to H intake24, day of the experiment significantly affected H intake (P=0.013) although an effect of day of the experiment on ∆BW was not evident (P>0.05). There were interactions between day of the experiment and feeding time for H intake (P<0.0001) and ∆BW (P<0.0014; results not shown).
Interactions between parity and time of feeding (morning or afternoon) on actual 1 h meal size and BW change (LSmean±SEM) of hogget and adult Romane ewes fed hay in confinement

a,bMeans within the row with different superscripts differ (P<0.05).
1 Hay intake measured in the automatic electronic feeder during the 1 h period from commencement of feeding: H intake (g)=H before (quantity of hay available before the big meal, kg) – Hafter (quantity of hay available after the big meal, kg).
2 Hay intake estimated as the difference in BW using the indirect Walk-over-Weighing (WoW) method: ∆BW (g)=BWafter (individual BW of the ewe after the 1 h period of the meal, kg) – BWbefore (individual BW of the ewe before the 1 h period of the meal, kg).
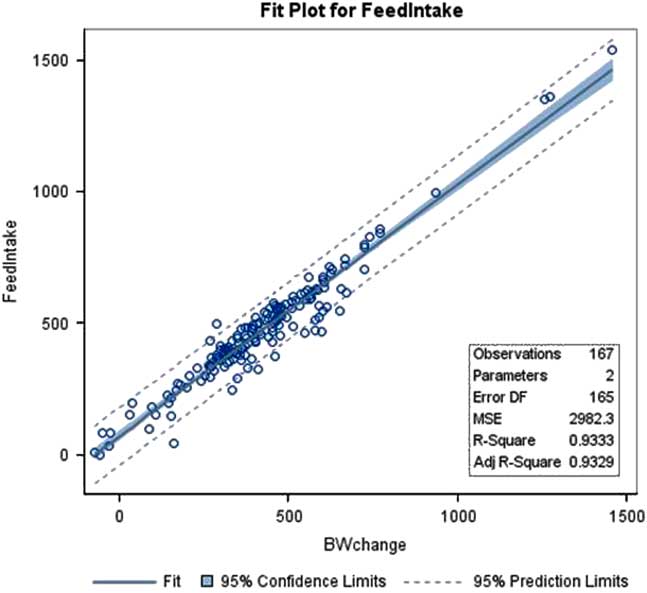
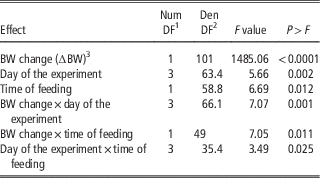
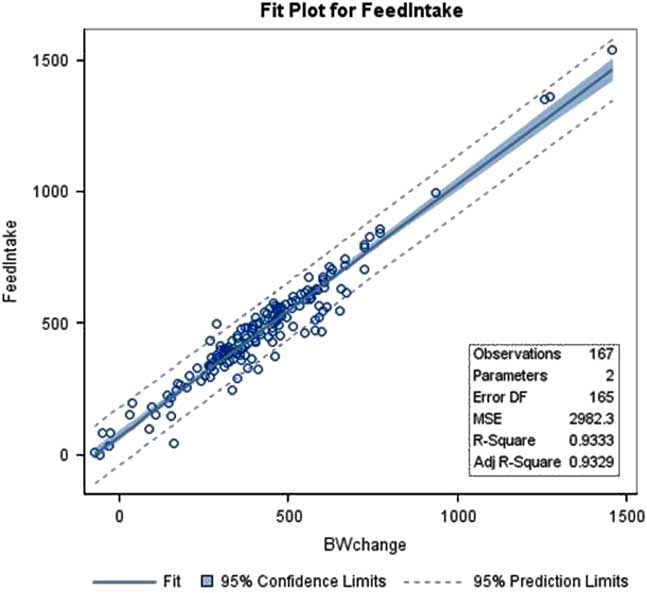
The main outcome of this experiment is presented in Figure 4 (and Table 4). When using the mixed-effects regression model to analyze the suitability of the WoW system to predict feed intake, the results showed that ∆BW, day of the experiment, time of feeding, and ∆BW×day of the experiment, ∆BW×time of feeding, day of the experiment×time of feeding interactions, were all significantly related or affected observed feed intake (P<0.05, Table 4). However, the size of the F-values showed that the largest proportion of the variation in observed feed intake was explained by ∆BW (F-value 1485 for ∆BW v. ⩽7.07 for the remaining factors in the model; Table 4).
Relationship between the actual hay intake (horizontal axis; average of the two meals per day measured in the automatic feeders) and estimated hay intake (vertical axis; calculated as the difference in individual BW before and after each meal).
Tests of fixed effects when determining the relationship between observed feed intake (H intake) and predicted feed intake using a weighing system for sheep (∆BW)

1 Num DF: the degrees of freedom (DF; number of valid observations minus 1) of the numerator (the sample with larger variance in SAS).
2 Den DF: the degrees of freedom of the denominator (the sample with smaller variance in SAS) obtained from mixed-effects models considering random effects and the appropriate covariance structure for the repeated measures (day of the experiment and time of feeding).
3 ∆BW: difference between BW before and 1 h after feed distribution.
Both the intercept (P=0.020) and the slope (P=0.011) differed from a perfect fit (0 and 1, respectively), however, the RMSE was only 40.9 g. A simple regression (rather than a mixed-effects model) with actual intake as the dependent variable and ∆BW as the independent variable resulted in a prediction equation (SE in parentheses) with an r 2 of 0.93% and an RMSE of 54.6 g:
 $$H_{{{\rm intake}}} ,g{\equals}67.04\ {\rm }\left(\!{\pm\,{\rm }9.410} \right){\plus}0.96\ {\rm }\left( \!{\pm\,0.020} \right){\times}\Delta {\rm BW}$$
Similar to the mixed-effects model, both the intercept (P<0.001) and the slope (P=0.036) differed from a perfect fit (0 and 1, respectively).
Discussion
The objective of this study was to investigate the use and performance of a non-invasive method for estimating individual forage intake in sheep. We confirmed our hypothesis that the method based on changes in BW can be used to assess short-term feed intake using Romane ewes fed under controlled conditions.
Plasma glucose (0.67 g/l), plasma NEFA (0.08 mmol/l) and plasma insulin (18.5 µIU/ml) profiles were found to be in the physiological ranges reported by González-García et al. (Reference González-García, Gozzo de Figuereido, Foulquie, Jousserand, Autran, Camous, Tesniere, Bocquier and Jouven2014) for the same breed, parities and physiological state (before mating). The NEFA values obtained in this experiment were lower (<0.2 mmol/l) meaning that ewes were in a good nutritional status and without mobilizing body reserves.
The average daily intake (H intake24; as fed) of the hay on offer, adjusted for metabolic BW, did not differ due to parity [91 g/kg BW0.75 on average; Table 2] and was higher than the fill value reported by Jarrige et al. (Reference Jarrige, Demarquilly, Dulphy, Hoden, Robelin, Beranger, Geay, Journet, Malterre, Micol and Petit1986) for sheep consuming a reference young grass pasture (75 g/kg BW0.75). A factor that contributed to the lack of difference in H intake24 in absolute terms between parity groups in the present study was probably the high variability in intake within the parity groups (SD=506 and 523 g/ewe per day for hogget and adult ewes, respectively). It is noteworthy that there was a significant (P<0.001) interaction between parity and time of feeding. The young ewes consumed 70 g more hay during the morning meal compared with adult ewes, whereas in the adult group no significant differences were observed (Table 3).
Actual daily intake was affected by the day of study as a consequence of decline in water intake on 1 day (Figure 3). This was due to a change in the watering system for the ewes to a device that automatically registered individual water consumption at each visit (data not shown). The day after this perturbation, intake of water and hay returned to previous levels (Figure 3), with adaptation to the new water drinking system being better for adult ewes. It’s important to note that this variation in intake was also detected by using the intake estimate based on BW.
Several factors may have contributed to the very high correlation between measured intake of hay and estimated intake using WoW. First, the experiment was carried out in a confined facility under very controlled conditions over a short time frame (1 h after each of two meals per day). Second, rather than relying on the voluntary passage of the ewes through the WoW device, as would occur during grazing, to determine BWbefore and BWafter at each meal we induced these measurements around fixed feeding times which enhanced precision of the intake estimates. Further, we fed ewes a dry diet (hay) which would have increased the thirst of the ewes and enhanced the effectiveness of water as an attractant to encourage ewes to pass through the WoW device. However, the use of hay also meant that the quantity of feed ingested was relatively low and more difficult to detect using BW variation, whereas in the field green forage higher in moisture could result in kilograms of feed consumed at each meal rather than grams.
More traditional methods of estimating pasture intake by grazing ruminants have limitations (Greenwood et al., Reference Greenwood, Bishop-Hurley, González and Ingham2014). Use of chemical markers in individuals within groups of animals can include various marker delivery methods, fecal collections and processing, may require extraction or digestion of markers from feces, and include laboratory analyses of feces, digests or extracts. Biomass disappearance for individuals within grazing plots requires reliable estimates of biomass over time including calibrations, accounting for regrowth, trampling and/or fecal contamination, and are not suitable for individual intake estimates within groups of animals grazing together within plots or paddocks. Sensor estimates of intake are only in the early stages of development during which time they are dependent on the quality of benchmark intake data generated using the methods above to establish sensor-based algorithms for pasture intake (Greenwood et al., Reference Greenwood, Bishop-Hurley, González and Ingham2014 and Reference Greenwood, Valencia, Overs, Paull and Purvis2017). Correlating the measurements obtained using the method evaluated here with information derived from other sensor devices to estimate time spent grazing, bite rate measurements and location (González et al., Reference González, Bishop-Hurley, Henry and Charmley2014; Greenwood et al., Reference Greenwood, Bishop-Hurley, González and Ingham2014, Reference Greenwood, Paull, McNally, Kalinowsky, Ebert, Little, Smith, Rahman, Valencia, Ingham and Bishop-Hurley2016 and Reference Greenwood, Valencia, Overs, Paull and Purvis2017) also provides options for increasing the breadth of information generated by remote systems, increasing the richness of data available for interpretation of grazing behavior and intake characteristics.
Perspectives on strengths and weaknesses of the indirect methodology for estimating intake
The results of the present study support continued work to refine the calibration and validation of this WoW method of estimating intake of forage including pasture. The use of the WoW device also allows for frequent automatic recording of BW of each individual without increasing labor and livestock handling making it an attractive proposition for livestock farmers (Brown et al., Reference Brown, Savage, Hinch and Hatcher2015). The low weight of the equipment which was constructed using stainless steel makes it suitable for easy relocation and outdoor use in variable climatic conditions and within grazing management systems. Power is also an important issue for the success of in-field WoW, and our autonomous system that uses solar power is critical to its successful use within grazing systems.
The greatest challenge for the WoW approach to estimating pasture intake will be validation under grazing conditions. A sound, strategic and practical approach that encourages animals to pass through the device at a high frequency is required. This will require the use of attractants other than feedstuffs that may bias BW data at weighing, and may include the use of water drinking points and mineral salts as successfully used in the present experiment, or shade trees during hot weather, for example. Another critical issue to the success of WoW is potential for more than one animal on the WoW platform. We are currently assessing other alternatives including electronic entrance and exit gates equipped with a programmable timing device to control the flow of ewes across the platform.
A further issue in the development and refinement of this methodology will be adjustments for inputs or outputs not directly related to ingested biomass. The volumes of solid (feces) and liquid (urine) excreted would affect BW and thus would result in impaired feed intake estimation; whereas water consumption may increase BW resulting in overestimates the ingested biomass. These adjustments will require understanding of the daily patterns of fecal and urinary excretions, as well as the water consumption patterns during the day, which may be affected by breed, physiological state, behavior, farming and feeding system, and the environment.
As discussed above, in the present experiment we offered a dry feed which stimulated water intake and encouraged the sheep to pass through the WoW system. This kind of feeding system results in ingestion of smaller volumes of feed compared with green forage, increasing the difficulty of precisely detecting expected BW differences before and after a meal. Within grazing conditions this is likely to be less problematic, and we speculate that because grazing animals will consume higher volumes of fresh biomass the change in BW between two successive points will be greater (as may be the excretion or urine). However, by another hand, thirst (depending on temperature) would also be reduced and therefore the motivation to cross the WoW would decrease.
Conclusions
There was a very high correlation between the actual hay intake measured in automatic feed bins and intake estimated from differences in BW using measurements before and after feeding. These findings confirm that our indirect method of estimating individual feed intake based on differences in BW within a fixed short-term time frame was a valid option to estimate short-term intake under the controlled conditions of this experiment. The method appears suitable as a low labor input method for estimating intake in intensive, group feeding studies where individual feeders are not available. The results also suggest a potential new approach in the search for a more practical and reliable method to estimate individual feed intake in free grazing ruminants. However, further research is required before the method can be evolved for use under grazing conditions, which is our ultimate objective.
Acknowledgments
This study was funded by a research grant of INRA PHASE Division (Physiologie Animal et Systèmes d’Elevage). Authors give thanks to the staff of the Experimental Farm Unit La Fage for assisting with animal care and data collection and for their responsible engagement in fulfilling the challenges of this ‘atypical’ protocol in their facilities. Special thanks to David Portes for his practical help during the setting work of the experimental dispositive and collaboration with the internship student Paula Golini; to Fabien Carrière and Sebastien Douls for their help with animal handling during weighing, BCS and blood sampling sessions; to Sara Parisot, the director of La Fage, for her fully support during the planning and execution of this study. The authors also acknowledge Anne Tesniere from SELMET for her efficient work in plasma analyses, and to Edmond Ricard, Jean-Louis Weisbecker and Jean-Francois Bompa from the ‘Electronic team’ of INRA Toulouse, for their support and constructive discussions during the design phase of this experiment. We also deeply acknowledge colleagues Denis Bastianelli, Laurent Bonal and Elodie Baby (SELMET Cirad Montpellier) for their collaboration in the feed samples analyses.