INTRODUCTION
Schistosomiasis is a widespread but still neglected tropical disease in need of more accurate diagnostic techniques. There is an increased awareness that interruption of transmission and elimination of the disease in settings that were previously considered as highly endemic is not a ‘mission impossible’ (World Health Organization, 2012). As perfect gold standard diagnostic techniques in general are sparse, a panel of various techniques to address the different challenges in control programmes and individual diagnosis will have to be used (Bergquist et al. Reference Bergquist, Johansen and Utzinger2009). First of all, an accurate diagnosis of an active infection should be made in order to effectively treat and control the disease. Furthermore, other relevant facets specific to the infection and disease may also require a targeted or tailored approach, including various community-integrated programmes that work together in order to successfully stop the transmission of the disease in endemic regions (Knopp et al. Reference Knopp, Becker, Ingram, Keiser and Utzinger2013). To obtain a good overview, it is necessary to have more information on the evaluation of effective chemotherapy, interaction with (and immunological effects of) other parasites and pathogens, development of active and passive immunity as well as anti-fecundity mechanisms, and resurgence of infections. All these issues are important when targeting effective (regional or local) interruption of transmission and elimination.
The detection of eggs in stool (Schistosoma mansoni, Schistosoma japonicum) or in urine (Schistosoma haematobium), although laborious, is still the most common method to determine schistosome infections and the only tool formally recommended by the World Health Organization (WHO) in low-resource settings. Antibody serology based assays have some use in non-endemic regions and for specific groups such as travellers. One of these assays, based on the detection of antibodies against S. mansoni cercarial transformational fluid (BioGlab Ltd, Nottingham, UK) is currently being evaluated in the field (Coulibaly et al. Reference Coulibaly, N'Goran, Utzinger, Doenhoff and Dawson2013a; Dawson et al. Reference Dawson, Sousa-Figueiredo, Kabatereine, Doenhoff and Stothard2013). In China, a rapid dipstick dye immunoassay for the detection of antibodies against S. japonicum has been widely evaluated in low endemic areas with good results (Xu et al. Reference Xu, Feng, Lin, Wang, Tang, Wu, Guo, Peeling and Zhou2011). However, in endemic regions this type of assay has only limited value in determining active infections (Smith et al. Reference Smith, Doenhoff, Aitken, Bailey, Ji, Dawson, Gilis, Spence, Alexander and van Gool2012). A recent approach focusing on the presumed protein backbone of the CCA-carbohydrate as a target of the antibody response might address applicability in low endemic regions (Grenfell et al. Reference Grenfell, Harn, Tundup, Da'dara, Siqueira and Coelho2013), but the assay is not available in a rapid field-friendly format and requires a relatively large serum sample (0·1 mL).
Alternatively, detection of Schistosoma circulating antigens is becoming an important tool for the diagnosis of active infections. For field applications, the preferred sample is fingerstick blood, or less invasive samples such as urine or saliva. Recently, lab-based immuno-assays for schistosomiasis diagnostics have been translated to a lateral flow (LF) based assay format for rapid point-of-care (POC) testing. The detection of CCA in urine was given highest priority as it allowed rapid identification of active infections using non-invasive techniques (van Dam et al. Reference van Dam, Wichers, Ferreira, Ghati, van Amerongen and Deelder2004). The currently available rapid POC-CCA test (Rapid Medical Diagnostics, Pretoria, South Africa) for direct detection of CCA in urine samples is not yet approved by WHO, but has been extensively studied and is usually well accepted (van Dam et al. Reference van Dam, Wichers, Ferreira, Ghati, van Amerongen and Deelder2004; Standley et al. Reference Standley, Lwambo, Lange, Kariuki, Adriko and Stothard2010; Shane et al. Reference Shane, Verani, Abudho, Montgomery, Blackstock, Mwinzi, Butler, Karanja and Secor2011; Deelder et al. Reference Deelder, van Dam and van Lieshout2012; Colley et al. Reference Colley, Binder, Campbell, King, Tchuem Tchuente, N'Goran, Erko, Karanja, Kabatereine, van Lieshout and Rathbun2013; Coulibaly et al. Reference Coulibaly, N'Gbesso, Knopp, N'Guessan, Silue, van Dam, N'Goran and Utzinger2013b; Erko et al. Reference Erko, Medhin, Teklehaymanot, Degarege and Legesse2013). The test has also been evaluated in a Schistosomiasis Consortium for Operational Research and Evaluation (SCORE) supported five country evaluation, and was found to be sufficiently sensitive and specific to be recommended as a mapping tool for determining S. mansoni prevalence in school-aged children (Colley et al. Reference Colley, Binder, Campbell, King, Tchuem Tchuente, N'Goran, Erko, Karanja, Kabatereine, van Lieshout and Rathbun2013). Detection of S. haematobium infections by this test showed large variations among different studies and will need further investigation (Stothard et al. Reference Stothard, Kabatereine, Tukahebwa, Kazibwe, Rollinson, Mathieson, Webster and Fenwick2006; Ayele et al. Reference Ayele, Erko, Legesse, Hailu and Medhin2008; Obeng et al. Reference Obeng, Aryeetey, de Dood, Amoah, Larbi, Deelder, Yazdanbakhsh, Hartgers, Boakye, Verweij, van Dam and van Lieshout2008; Midzi et al. Reference Midzi, Butterworth, Mduluza, Munyati, Deelder and van Dam2009). Studies using the CCA-ELISA (Deelder et al. Reference Deelder, Qian, Kremsner, Acosta, Rabello, Enyong, Simarro, Vanetten, Krijger, Rotmans, Fillie, de Jonge, Agnew and van Lieshout1994; Agnew et al. Reference Agnew, Fulford, de Jonge, Krijger, Rodriguezchacon, Gutsmann and Deelder1995) indicate that the POC-CCA is applicable for S. japonicum as well.
Circulating anodic antigen (CAA) is another well-described schistosomal circulating antigen present in serum and urine of patients with active infections. Diagnostic assays built on targeting this antigen require extraction of the sample with trichloroacetic acid (TCA) followed by centrifugation, which leaves the carbohydrate components in the TCA-supernatant and precipitated protein material in a pellet. The advantage of the TCA extraction is an improvement of the analytical sensitivity that makes this assay eligible for applications in low endemic regions to detect active infections with a low worm burden (Agnew et al. Reference Agnew, Fulford, de Jonge, Krijger, Rodriguezchacon, Gutsmann and Deelder1995; van Lieshout et al. Reference van Lieshout, Polderman, de Vlas, de Caluwe, Krijger, Gryseels and Deelder1995; van Dam et al. Reference van Dam, Stelma, Gryseels, Falcao Ferreira, Talla, Niang, Rotmans and Deelder1996c; Leutscher et al. Reference Leutscher, van Dam, Reimert, Ramarakoto, Deelder and Ornbjerg2008). Moreover, the CAA test is a genus-specific test detecting various Schistosoma species including the veterinarian ones (De Bont et al. Reference de Bont, van Lieshout, Deelder, Ysebaert and Vercruysse1996; Flowers et al. Reference Flowers, Hammerberg, Wood, Malarkey, van Dam, Levy and McLawhorn2002; Gabriel et al. Reference Gabriel, de Bont, Phiri, Masuku, Riveau, Schacht, Deelder, van Dam and Vercruysse2002). Assay sensitivity was further improved with the introduction of the up-converting phosphor (UCP) technology and switch from an ELISA-based platform to a LF-based platform (Corstjens et al. Reference Corstjens, van Lieshout, Zuiderwijk, Kornelis, Tanke, Deelder and van Dam2008). The UCP-LF assay for CAA detection was recently adapted to a dry reagent format that allows convenient storage at ambient temperature and worldwide shipping without the need for a cold chain (van Dam et al. Reference van Dam, de Dood, Lewis, Deelder, van Lieshout, Tanke, van Rooyen and Corstjens2013).
The introduction of the UCP reporter technology was an important factor for the increase in sensitivity (Corstjens et al. Reference Corstjens, Li, Zuiderwijk, Kardos, Abrams, Niedbala and Tanke2005). The applied 400 nm Y2O2S :Yb3+,Tm3 fluorescent reporter particles are excited with infrared light (IR, 980 nm) and emit higher energy green light (550 nm) in a process called upconversion. This process is completely restricted to the particle lattice and thus free of autofluorescence from other assay components (Zarling et al. Reference Zarling, Rossi, Peppers, Kane, Faris, Dyer, Ng and Schneider1997; Zijlmans et al. Reference Zijlmans, Bonnet, Burton, Kardos, Vail, Niedbala and Tanke1999). UCP-LF assays depend on the use of a specific antibody pair to capture the desired target; for CAA, carrying multiple repeating carbohydrate epitopes, the same monoclonal antibody is used to bind (sandwich) the antigen to both the UCP reporter as well as the specific capture area of the test (T) line on the LF strip. The stability of the target antigen can also affect the assay sensitivity and the CAA carbohydrate fraction has been shown to be a stable component in urine and blood; it is detectable after multiple freeze-thawing steps, or after storage of the clinical samples at ambient temperature for prolonged periods of time (unpublished observations). Extraction of the carbohydrate with TCA allows further concentration of the sample with commensurate improved analytical sensitivity. Results presented here demonstrate the potential of the UCP-LF CAA assay to be developed into an assay with ultimate sensitivity, i.e. the detection of a single worm.
At present, the UCP-LF assay platform available in our laboratory comprises two assay formats, one with a major application in antibody detection and one with a major application in antigen detection. The antigen format includes a liquid phase, an incubation step of the clinical sample with the target-specific UCP label, which leads to improved sensitivity. This assay format has also been applied for the detection of cytokines (Corstjens et al. Reference Corstjens, de Dood, van der Ploeg-van Schip, Wiesmeijer, Riuttamaki, van Meijgaarden, Spencer, Tanke, Ottenhoff and Geluk2011) and nucleic acids (Corstjens et al. Reference Corstjens, Zuiderwijk, Brink, Li, Feindt, Neidbala and Tanke2001). The antibody format is referred to as consecutive flow (CF) and comprises three sequential flow steps: firstly, the flow of the diluted clinical sample, immediately followed by a wash flow and finally the flow with the UCP label. It was initially developed as a rapid assay for the simultaneous detection of multiple antibodies in serum with a UCP label specific for immunoglobulin (Ig). The sequential flow strategy allowed enrichment of the targeted antibodies at their respective Test (T) line before interaction with an Ig-specific UCP reporter (Corstjens et al. Reference Corstjens, Chen, Zuiderwijk, Bau, Abrams, Malamud, Niedbala and Tanke2007). Applications of the CF format however are not limited to antibody detection but also allow detection of other types of targets in other biological fluids (Chen et al. Reference Chen, Abrams, Geva, de Dood, Gonzalez, Tanke, Niedbala, Zhou, Malamud and Corstjens2013). In this report, we summarize recent progress in development of different UCP-LF based assays for the diagnosis of schistosomiasis and exploration of various unsolved questions regarding host-parasite relationships and biological processes related to schistosome infections.
MATERIALS AND METHODS
Parasites and antigens
As a reference standard for the quantitative determination of CAA and CCA, a TCA-soluble fraction of S. mansoni adult worm antigen, AWA-TCA (Deelder et al. Reference Deelder, Kornelis, Makbin, Noordpool, Codfried, Rotmans and Oostburg1980), was used in a similar manner as described by Polman et al. (Reference Polman, Diakhate, Engels, Nahimana, van Dam, Ferreira, Deelder and Gryseels2000). Soluble egg antigen (SEA) was prepared following similar protocols as for AWA, using S. mansoni eggs recovered from the livers of infected hamsters. Soluble crude cercarial antigen preparation (SCAP) was prepared from freshly shed cercariae, collected after precipitation under gravity in ice-cooled water, and subsequently treated similarly to SEA or AWA.
LF strips and UCP reporter conjugates
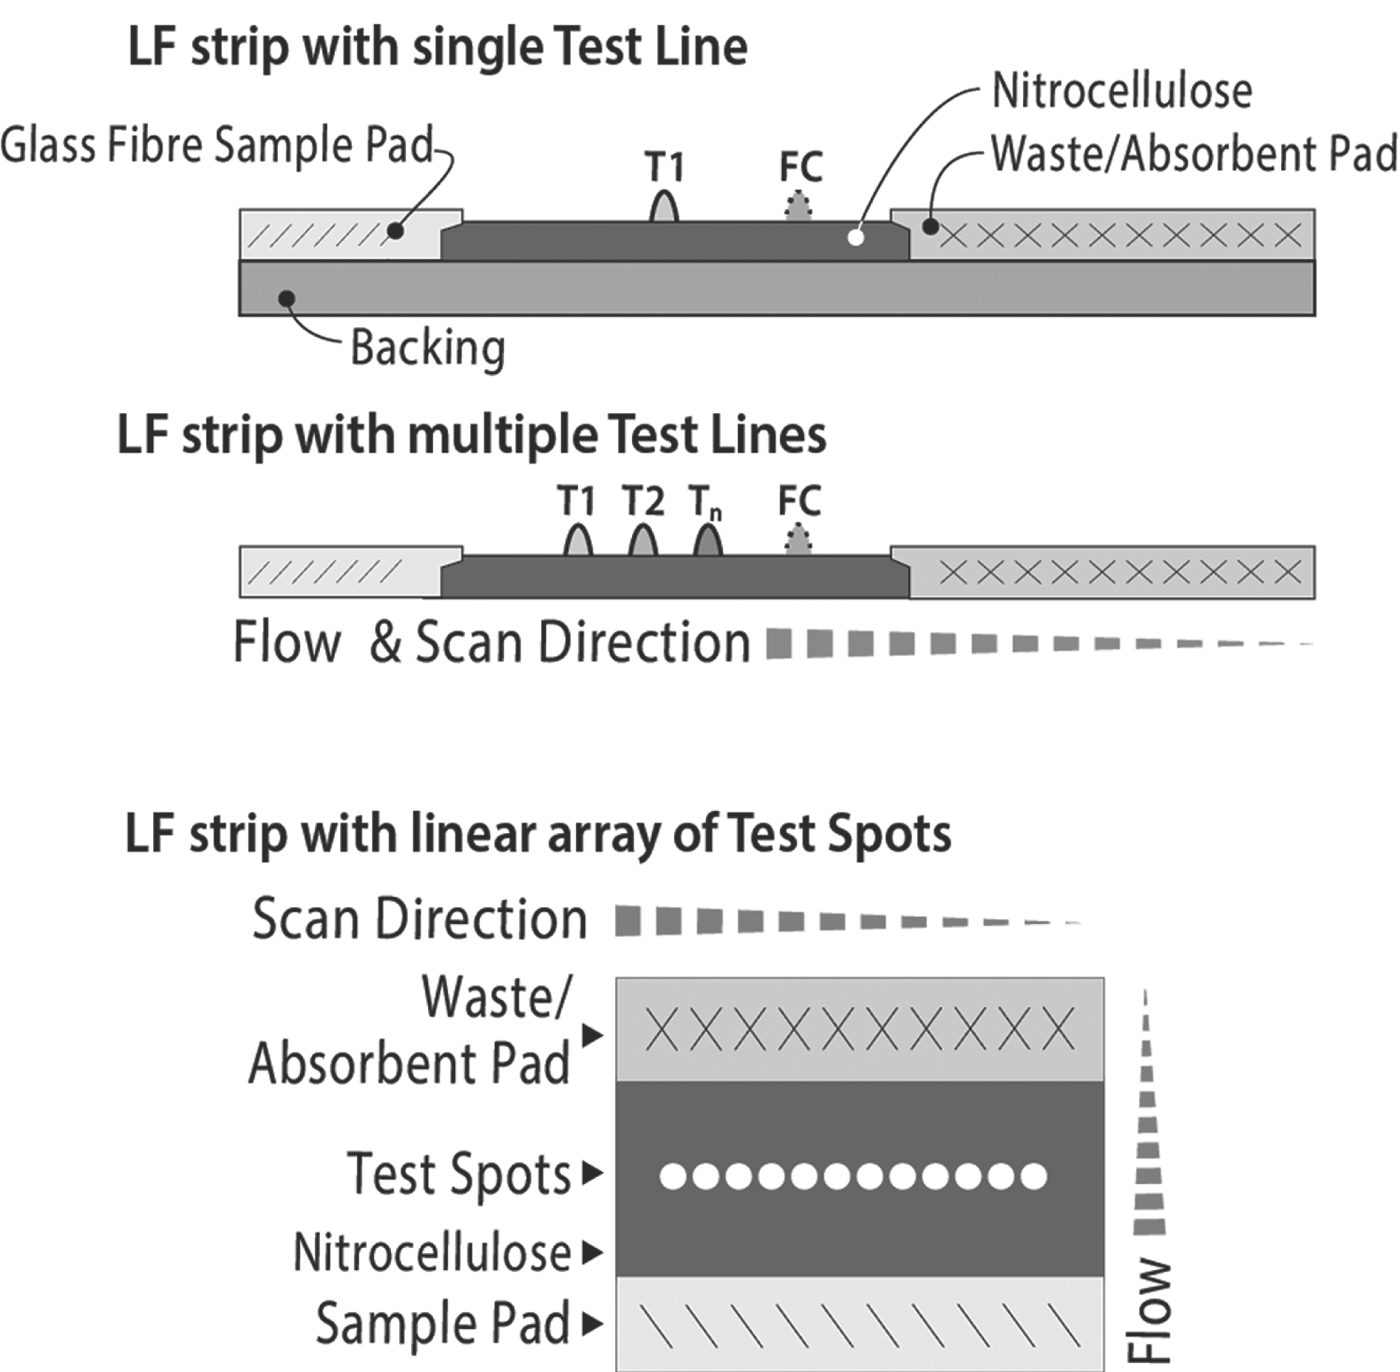
LF strips (Fig. 1A) were prepared following protocols described earlier (Corstjens et al. Reference Corstjens, Zuiderwijk, Brink, Li, Feindt, Neidbala and Tanke2001) using a nitrocellulose membrane (High Flow Plus 90, Millipore) for immunochromatography with a glass fibre sample pad (Surewick, Millipore). LF strips for the UCP-LF antigen assays (CAA and CCA) contained a test line (T) comprised of 200 ng mouse monoclonal anti-CAA antibody (#147-3G4, Dept. of Parasitology, LUMC) or anti-CCA antibody (#54-4C2, Dept. of Parasitology, LUMC), respectively (Deelder et al. Reference Deelder, van Dam, Kornelis, Fillie and van Zeyl1996). UCP reporter conjugates were prepared with the same antibodies at a density of 25 μg antibody per mg UCP. LF strips for antibody detection were provided with a test line (T) comprised of 200 ng SEA or the cercarial extract SCAP. The UCP conjugate used in the SEA and SCAP UCP-CF antibody detection assay contained 25 μg protein-A (recombinant, #RPA-50; Repligen Corp., Waltham, MA, USA) per mg UCP particles. Experiments were performed using previously described 400 nm Y2O2S:Yb3+,Tm3+ particles (OraSure Technologies Inc., Bethlehem, PA; Corstjens et al. Reference Corstjens, Zuiderwijk, Brink, Li, Feindt, Neidbala and Tanke2001, Reference Corstjens, Li, Zuiderwijk, Kardos, Abrams, Niedbala and Tanke2005). A detailed description of LF strip manufacturing and UCP conjugate production is given by Tjon Kon Fat et al. (Reference Tjon Kon Fat, Abrams, Niedbala, Corstjens and Conn2012).
Different type of lateral flow strips. The upper strip is a side view of a LF strip with a single test (T) line and a flow-control (FC) line. The T-line is the target-specific (disease/pathogen-specific) capture zone. The FC-line is the control area that captures UCP reporter particles that have flowed past the T-line and indicate that the flow (chromatography) was successful. The LF strip with multiple T-lines can detect a limited number of different targets simultaneously in a single sample; sample and UCP reporter have to pass all capture zones. The lower strip, referred to as TransDot (Malamud et al. Reference Malamud, Bau, Niedbala and Corstjens2005; Corstjens et al. Reference Corstjens, Kardos, Niedbala, Tanke, Zuiderwijk, Feindt, Mokkapati and Kimball2010), is a top view of a LF strip with a linear array of T-spots; all spots are localized at the same distance from the sample pad and interact with part of the sample and UCP reporter that did not have interaction with the other capture zones. TransDot is well suited for comprehensive multiplexing when it allows the use of a generic UCP conjugate (as UCP particles coated with protein A for antibody detection).

Conventional UCP-LF antigen assay for CAA and CCA
The UCP-LF antigen assay utilizes 20 μL TCA supernatant (after centrifugation) of a serum/urine sample mixed with an equal volume of 4% TCA (w/v). Note that TCA extraction effectively removes interfering proteins and dissociates potential immune complexes (de Jonge et al. Reference de Jonge, Fillie and Deelder1987). In previously described assays, the TCA supernatants were neutralized (in analogy with the CAA- and CCA-ELISAs), but this was not necessary for the UCP-LF assay. Omission of the neutralization step and a two-fold increase of the sample input (20 μL TCA supernatant instead of 10 μL) increased analytical sensitivity of the method by a factor of four as compared with the method used in previous studies (Corstjens et al. Reference Corstjens, van Lieshout, Zuiderwijk, Kornelis, Tanke, Deelder and van Dam2008; van Dam et al. Reference van Dam, de Dood, Lewis, Deelder, van Lieshout, Tanke, van Rooyen and Corstjens2013). Quality control (QC) and standard dilution series were prepared spiking AWA-TCA in PBS or high salt lateral flow assay buffer (HSLF: 100 mm HEPES pH 7·5, 270 mm NaCl, 0·5% v/v Tween-20, 1% w/v BSA), or in negative human serum (NHS) or urine. QC and standards received the same TCA treatment as the clinical samples. In the antigen assay 20 μL TCA-supernatant is mixed with 100 μL HSLF containing 100 ng UCP coated with the appropriate antibody (anti-CAA or antiCCA) and incubated for 1 h, 37 °C at 900 rpm. LF strips with the appropriate capture zones (T lines) are then applied to the tubes or microtitre plate wells with the UCP mixture and immunochromatography is allowed to proceed for at least 20 min. After drying, the LF strips are scanned as described below for the UCP-CF antibody format.
The above described assay format is ‘available’ in a wet and dry format. In the dry format the UCP reporter is provided as a dry material, 100 ng per tube. The dry material is simply hydrated by adding 100 μL HSLF assay buffer. The wet assay format includes a sonication step of the UCP stock solution. The UCP stock is provided as a 1 mg/mL suspension in UCP storage buffer (50 mm glycine, 0·03% v/v Triton X-100, 0·1% w/v NaN3, pH 8·0); after homogenization the desired amount is sonicated (1 min, water bath sonicator, 100 W) in HSLF assay buffer at a concentration of 1 μg per 100 μL (enough for 10 assays). After sonication the UCP mixture is further diluted to 100 ng per 100 μL HSLF.
Concentration-based UCP-LF CAA assay
To increase the analytical sensitivity, a concentration based UCP-LF CAA assay was developed: the clear TCA supernatant of clinical samples or standard series extracted with equal volumes of 4% TCA (w/v) is loaded into the filter unit of the 0·5 mL 10 kDa cut-off centrifugal device (Amicon Ultra-0·5 mL Centrifugal Filters, Millipore Corp.) and centrifuged 20 min which reduces the volume to ~20 μL. The concentrate and flow-through are further tested as described for the conventional assay format. Note that centrifugal filter devices are available as 0·5, 4 and 15 mL and with different molecular weight cut-off (3, 10, 50 and 100 kDa). In the pilot study described here we have used 0·5 mL devices with a 10 kDa filter.
UCP-CF assay for antibody detection
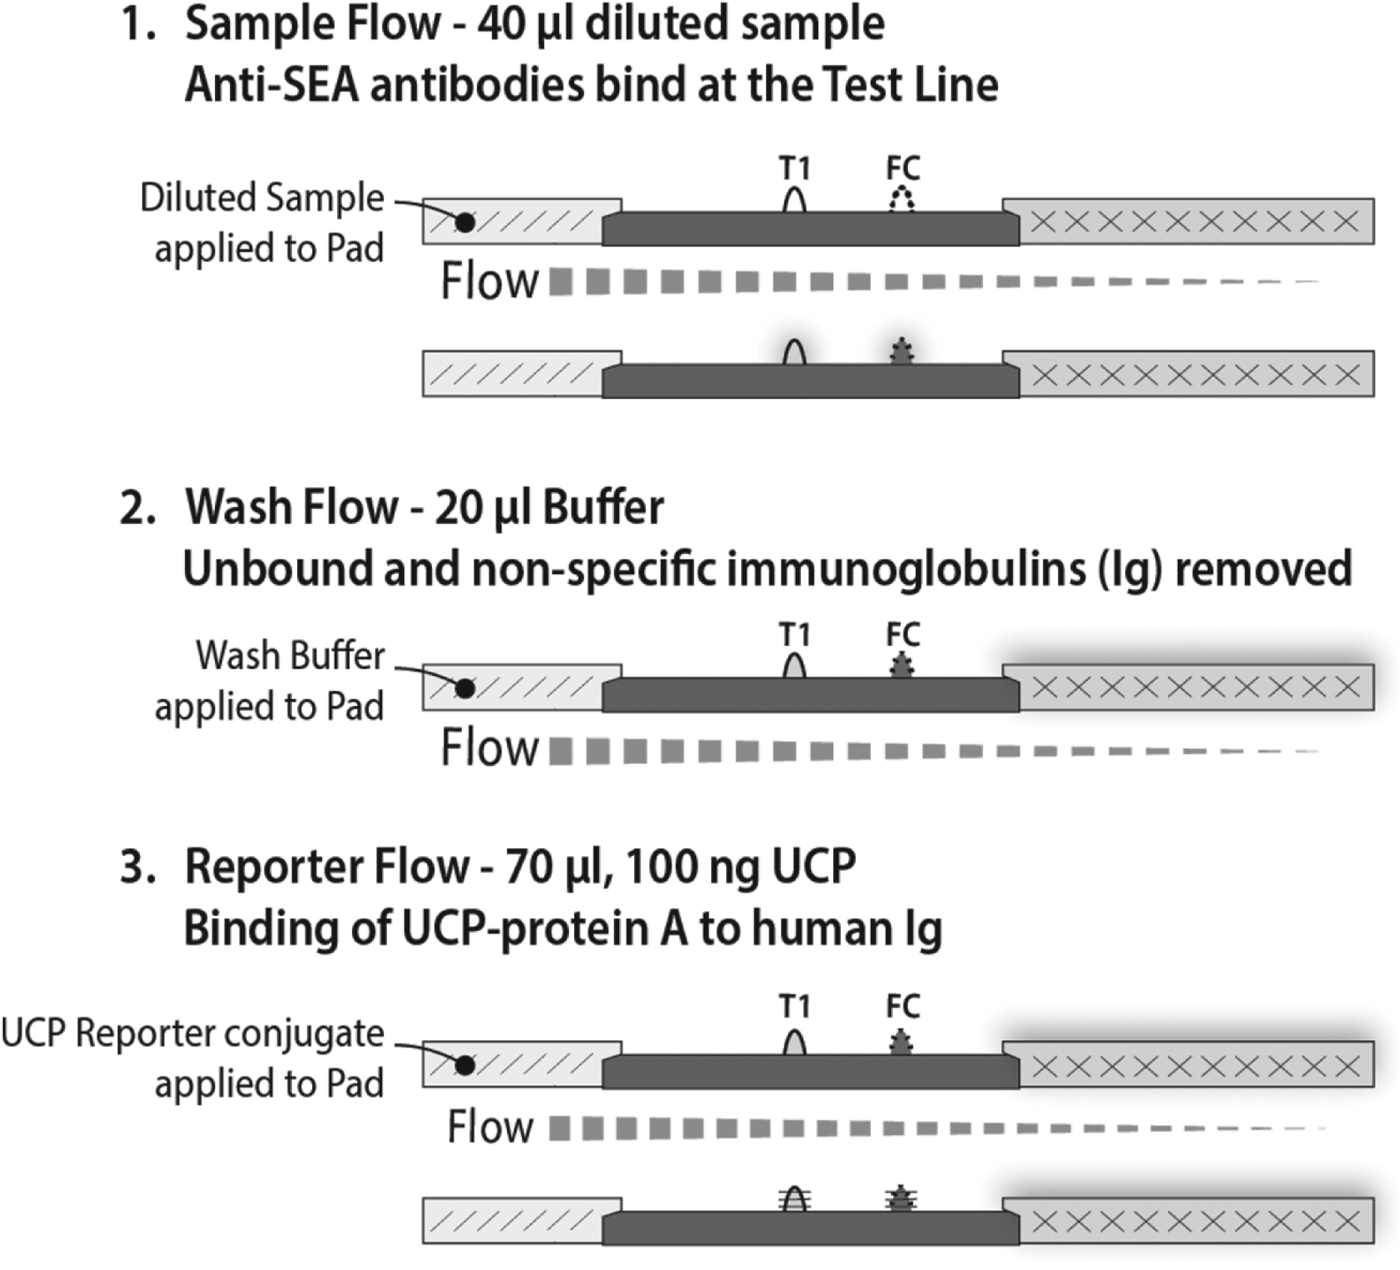
The UCP antibody detection assay consists of three sequential flow steps (consecutive flow, CF). First (sample application): 40 μL 100-fold diluted serum in HSLF assay buffer is added to the LF strip. Second (wash): 20 μL HSLF is added immediately after the 40-μl sample has been absorbed by the sample pad. Third (reporter): 5 min after initiation of the wash step, 100 ng of the UCP protein-A in 70 μL HSLF buffer is added. Immunochromatography is allowed to continue for at least an additional 15 min. LF strips can be scanned after a total assay time of 20 min. Longer incubations allow complete drying of the LF strips which results in higher signal strength measured at both the Test (T) and Flow Control (FC) lines, but it does not change the ratio value that is calculated by dividing the T signal by the FC signal. Signals are measured as relative fluorescent units (RFUs) representing the intensity of the emitted green light upon excitation of the UCP reporter particles captured at the T and FC line. Scanning of the LF strips was performed with a Packard FluoroCount microtitre plate reader adapted with an IR laser (980 nm) modified to scan LF strips (Niedbala et al. Reference Niedbala, Feindt, Kardos, Vail, Burton, Bielska, Li, Milunic, Bourdelle and Vallejo2001), or with dedicated UPlink (Mokkapati et al. Reference Mokkapati, Sam, Kardos, Perez, Guo, Tanke and Corstjens2007) or UCP-Quant (van Dam et al. Reference van Dam, de Dood, Lewis, Deelder, van Lieshout, Tanke, van Rooyen and Corstjens2013) LF strip readers also applied with an IR excitation source.
RESULTS AND DISCUSSION
Analysis of UCP-LF test result
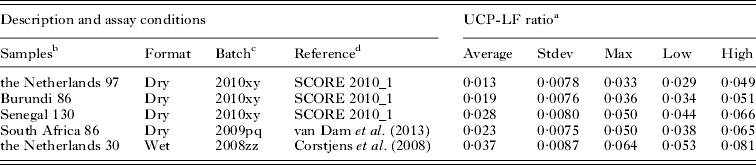
For standardization and quantitative expression of the results UCP-LF assay data are presented as ratio values (Corstjens et al. Reference Corstjens, Zuiderwijk, Brink, Li, Feindt, Neidbala and Tanke2001), i.e. the UCP signal measured at the Test (T) line divided by the UCP signal measured at the Flow Control (FC) line (Fig. 1). The cut-off threshold value is then defined as the ratio T/FC value above which a sample is designated reactive or positive. These threshold values may be influenced by technical factors such as batch-to-batch variations, as well as (immuno-)epidemiological settings (e.g. co-infections, age and geography). Table 1 shows the minimal level of variation that is observed in a cut-off threshold when testing different populations with UCP-CAA LF strip batches prepared from the same set of material following a strict quality control protocol. In practice, when studying prevalence and clinical sensitivity, a low- and high-sensitivity cut-off threshold are applied. These values are usually defined, respectively, as the average and the highest value both plus two s.d. of a series of samples from a set of confirmed negative controls. If proper control samples are not available, cut-off thresholds are determined from a standard series of AWA-TCA (containing approximately 3% w/v of CAA and CCA) spiked in NHS or negative urine. Ratio values can also be adjusted by varying the amount of capture antibodies on the T and FC line. In general the composition of the T line is optimized for analytical sensitivity, such that the optimal load of capture antibody still results in a detectable specific T line signal with the lowest concentration of target antigen. The FC line can be adapted to give the desired ratio either at the low or high end of the antigen concentration curve. These conditions are directly linked to the sensitivity of the UCP reader used. CAA or CCA concentrations are determined by fitting ratio T/FC values to the standard curve obtained with the AWA-TCA series (Corstjens et al. Reference Corstjens, van Lieshout, Zuiderwijk, Kornelis, Tanke, Deelder and van Dam2008).
Variation in the UCP-LF CAA cut-off threshold when testing different populations
a Average, average ratio of the negatives; Stdev, s.d.; Max, largest ratio value determined in the selection; Low and High represent low- and high-specificity cut-off threshold. In contrast to the high specificity threshold, the low specificity threshold may not lead to 100% clinical specificity. Results obtained utilizing the 20 μL assay for CAA detection in serum (SCAA20).
b the Netherlands, Burundi, Senegal: sera were also used in previous studies developing the CAA- and CCA-ELISA (Krijger et al. Reference Krijger, van Lieshout and Deelder1994; Polman et al. Reference Polman, Diakhate, Engels, Nahimana, van Dam, Ferreira, Deelder and Gryseels2000). South Africa: as described in Van Dam et al. (Reference van Dam, de Dood, Lewis, Deelder, van Lieshout, Tanke, van Rooyen and Corstjens2013). the Netherlands, as described in Corstjens et al. (Reference Corstjens, van Lieshout, Zuiderwijk, Kornelis, Tanke, Deelder and van Dam2008). Digits indicate the number of sera tested.
c Different batches of LF strips and UCP conjugate may influence the UCP-LF ratio value. Batches are identified by production year and two letters indicating the LF strip and UCP batch, respectively.
d Results from Burundi, the Netherlands and Senegal group for the UCP-CAA LF assay (unpublished) were reported to SCORE for the 2010 annual progress report.
Antigen – towards single worm detection with the UCP-LF CAA assay
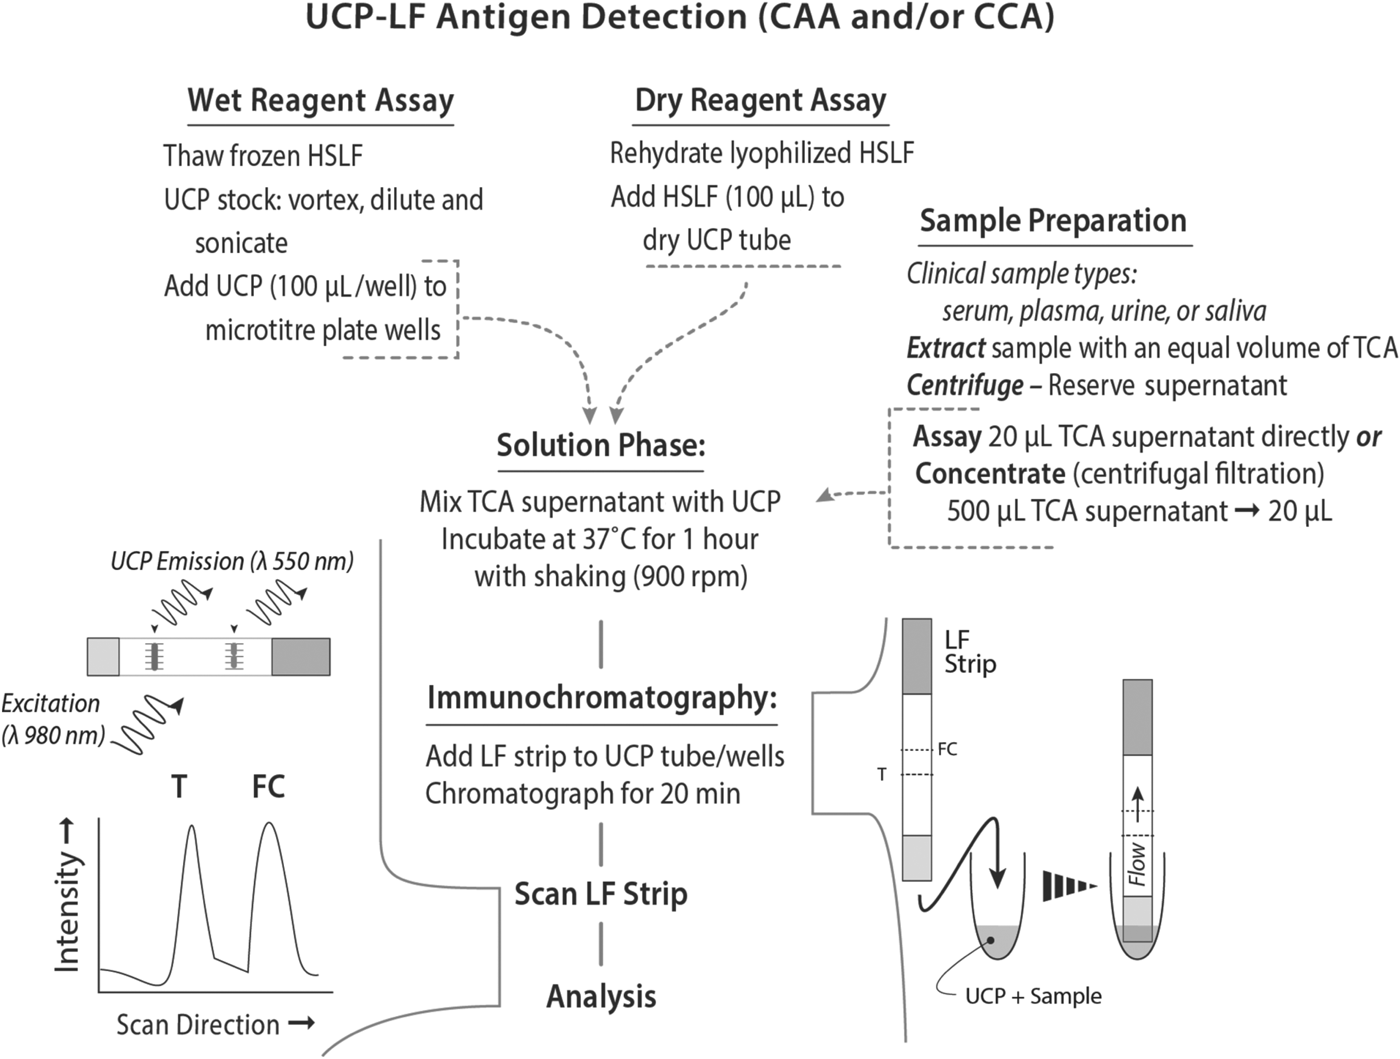
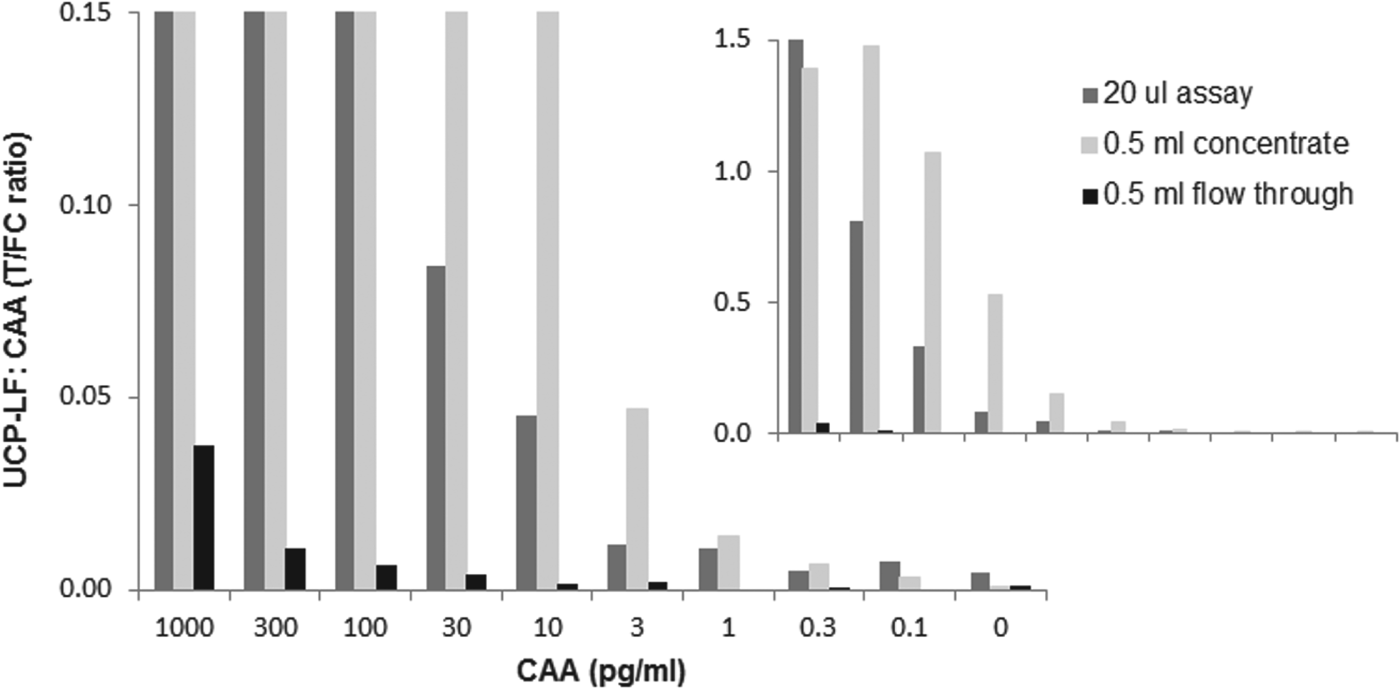
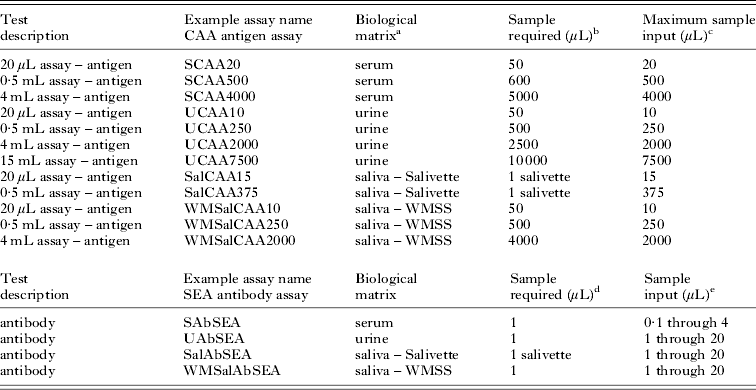
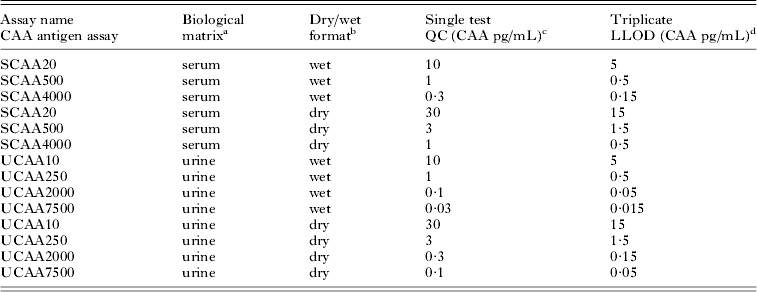
The UCP-LF format for antigen testing was extensively studied for the detection of CAA. Previous studies indicated the potential of the UCP-LF assay to detect low-grade infections (Corstjens et al. Reference Corstjens, van Lieshout, Zuiderwijk, Kornelis, Tanke, Deelder and van Dam2008) and showed the development and application of a convenient and robust dry reagent format (Fig. 2). In the dry format a sonication step of the UCP conjugate could be omitted and further adjustments allowed worldwide shipping and storage at ambient temperature and improved shelf life (van Dam et al. Reference van Dam, de Dood, Lewis, Deelder, van Lieshout, Tanke, van Rooyen and Corstjens2013). The dry reagent format requires basic laboratory equipment (a microcentrifuge and a thermoshaker) for the TCA sample pre-treatment step and the 37 °C incubation step. The assay was developed for use with serum or plasma samples and requires an input of 20 μL TCA extract; in practice for efficient testing of a larger series, a 50 μL serum/plasma sample is requested as it enables fast and easy recovery of sufficient clear TCA supernatant (Table 2) and leaves enough material for a duplicate result if required. The lower limit of detection (LLOD) for the wet and dry reagent can be batch-dependent (batches, with a maximum of 2000 LF strips, are manually produced). The maintained quality control (QC) standard demands a LLOD of 10 and 30 pg CAA per ml for the standard 50 μL serum test (SCAA20) in the wet and dry format, respectively (Table 3). The clinical specificity of the assay is 100% based on sets of negative controls both from endemic and non-endemic countries. Recently the assay was also successfully applied for detection of CAA levels in urine. Moreover, the introduction of a concentration step after TCA extraction utilizing disposable centrifugal concentration devices provided further improvement of the sensitivity. Depending on the amount of sample and capacity of the applied concentration device, either 0·5, 4 or even 15 mL, theoretical improvements of the LLOD with a factor of 25, 200 or even 750 can be achieved. In practice the gain will be less, but development of a robust reproducible assay that can achieve levels well below 1 pg/mL (Fig. 3) is certainly feasible. Note that generally the sample volume will be restricted when testing clinical serum samples; therefore, centrifugal devices larger than 0·5 mL are not likely to be applied in blood-based assays. The 1 pg/mL level in serum is expected to allow identification of single worm infections, as in vitro worm culture studies and studies with experimentally infected baboons indicate steady state serum CAA levels of ~5 pg/mL (van Dam et al. Reference van Dam, Bogitsh, van Zeyl, Rotmans and Deelder1996a; Wilson et al. Reference Wilson, van Dam, Kariuki, Farah, Deelder and Coulson2006). For serum analysis, the sample volume is restricted, therefore limiting the increase in sensitivity that can be reached with concentrating, but for urine samples large volume applications using 4 or even 15 mL concentration devices will not cause a significant problem. Obviously it would be useful if the filtrate from urine filtrations performed for egg microscopy could be used in the CAA concentration assay. This was tested recently using freshly collected urine (experiments performed at Public Health Laboratory-Ivo de Carneri (PHL-IdC), Pemba, Tanzania, courtesy of Dr Marco Albonico and Dr Beatrice Barda) as well as stored frozen urine samples (Kahama et al. Reference Kahama, Kremsner, van Dam and Deelder1998). CAA levels in the filtrates were equal to these in unfiltered urine (results not shown). The use of concentration devices usually resulted in a reduction of the background signal of the negative controls, which maintained or improved the accuracy of the assay. Figure 3 shows the results of a typical assay employing concentration of a TCA-extracted dilution series of CAA in buffer. Filter devices with a 10 kDa cut-off were used and only for samples containing high CAA levels a minor portion was detected in the flow-through (ultrafiltrate) after concentration. As the molecular mass of CAA in AWA-TCA preparations may be different from CAA material present in serum or urine, the optimal pore size of the filtration membrane for testing clinical samples (either serum or urine) still needs to be determined.
UCP-LF antigen detection assay format (CAA and CCA). The UCP-LF antigen test is available as a ‘wet reagent assay’ and a ‘dry reagent assay’. The ‘wet’ format is performed in well-equipped laboratories by qualified staff and has a 3-fold better analytical sensitivity than the ‘dry’ format assay. The ‘dry’ format allows convenient shipping and storage at ambient temperature and is less demanding in equipment and training. Sample preparation is identical for both formats and requires a TCA extraction. The TCA supernatant can be concentrated to increase sensitivity.
Concentration devices to improve LLOD. Analysis of an AWA-TCA (containing 3% w/w CAA) standard series and comparison of the 20 μL assay and the 500 μL concentration assay. The standard series was prepared in 1×PBS with 0·5% Tween-20, and extracted with an equal volume of 4% (w/v) TCA; 20 μL of TCA supernatant was analysed with the UCP-LF assay without concentration, and 500 μL TCA-sup was analysed after 25-fold concentration with the Amicon 0·5 mL centrifugal device (10 kDa molecular weight cut-off membrane).
Required clinical sample size for the various UCP-LF assay formats
a Serum and urine collection is standardized. Saliva collection, however, is quite variable; different saliva collectors are available (Malamud et al. Reference Malamud, Bau, Niedbala and Corstjens2005; Corstjens and Malamud, Reference Corstjens, van Lieshout, Zuiderwijk, Kornelis, Tanke, Deelder and van Dam2008) and also saliva can be collected from different parts of the mouth. Currently assays are evaluated using either whole mouth-stimulated saliva (clarified by centrifugation) or saliva collected using Salivette collectors (SARSTEDT AG & Co.).
b The required sample amount is the volume needed to ensure maximum sample input. The minimum requested sample volume is 50 μL; this allows convenient sample handling (transport and storage) and extraction of the sample with TCA.
c The maximum sample input translates to the maximum volume of the biological matrix (relating to the CAA concentration) that is actually used in the assay. Lower amounts are feasible but will affect the lower limit of detection (note: high infection grades may require 10- or 100-fold dilution of the sample). Higher amounts are possible when using the 500, 4000 and 15 000 concentration devices; this requires reloading of the devices which can be done multiple times. Note that for urine the actual sample input is only half that of serum; a consequence of the fact that TCA extraction of serum samples generates a large pellet (about 50% of the total volume), whereas urine commonly generates only a small pellet. The composition of saliva is quite variable and TCA extractions in general generate a larger pellet than observed for urine samples, but significantly less than the serum samples.
d In the foreseen combined testing approach, supplying 50 μL for the antigen assays would also allow testing for antibodies.
e For antibody testing the sample input is flexible, however the volume and dilution will affect the cut-off threshold. Cut-off levels are best determined from a group representing the same ethnicity and geography.
Quality control and lower limit of detection levels of the different UCP-LF CAA assay formats
a Results achieved in the saliva-based matrix are not included. The saliva-based assay is not fully explored and determined levels are still considered tentative; clinical saliva-based samples from Schistosoma infected individuals were not yet tested.
b The dry assay format is developed for use by third parties (allows convenient transport of dry reagents without a cold chain). The wet assay format is used at LUMC to achieve maximum sensitivity.
c The QC (quality control) values present the detection values that need to be achieved when testing normal human sera or urine spiked with AWA-TCA (containing 3% w/w CAA). The CAA-20 level is the most stringent; UCP conjugates that do not pass the CAA-20 QC will not be used for preparation of dry reagents.
d The LLOD (lower limit of detection) is the level achievable when testing under ideal laboratory conditions or when performing multiple (triplicate or more) experiments.
Antigen – development of the UCP-LF CCA assay
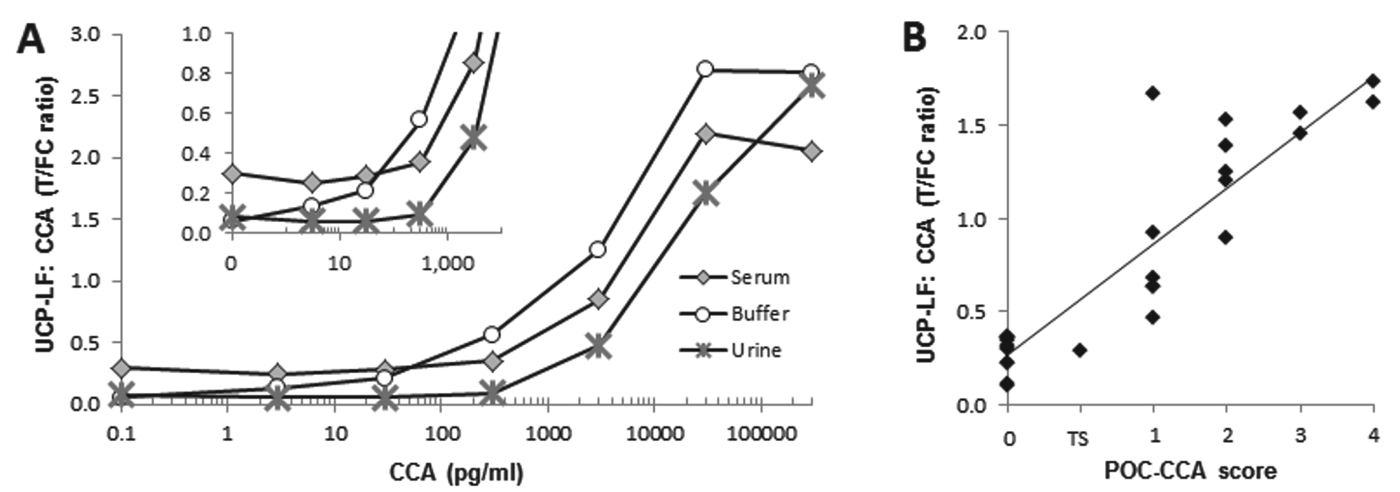
A UCP-LF assay for detection of CCA is being explored following similar protocols as utilized for CAA (Fig. 2). In the assay, CCA first binds to the UCP reporter (liquid phase) and the resulting UCP-CCA complex is then captured on the T line of the LF strip (solid matrix phase). The T line contains the same CCA-specific antibody as present on the UCP reporter particles, and thereby differs from the antibodies as used in the POC-CCA (van Dam et al. Reference van Dam, Wichers, Ferreira, Ghati, van Amerongen and Deelder2004). It recognizes the repeated structure of multiple Lewis x fragments from CCA (van Dam et al. Reference van Dam, Bergwerff, Thomas-Oates, Rotmans, Kamerling, Vliegenthart and Deelder1994). Because the Lewis x determinant and its repeats are also found in host-derived glycans that could be present in serum and urine (van Dam et al. Reference van Dam, Claas, Yazdanbakhsh, Kruize, van Keulen, Ferreira, Rotmans and Deelder1996b), these compounds may generate a biological background level below which a CCA-specific signal cannot be distinguished. Because of the observed natural background signals it was previously decided to maintain cut-off levels of, respectively, 2460 and 1140 pg CCA per ml urine and serum (with TCA extraction), in order to obtain a specificity of 98% (Polman et al. Reference Polman, Diakhate, Engels, Nahimana, van Dam, Ferreira, Deelder and Gryseels2000). Note that for CAA, this is completely different because of the unique polysaccharide structure, consisting of repeating disaccharide units of GlcA and GalNAc (Bergwerff et al. Reference Bergwerff, van Dam, Rotmans, Deelder, Kamerling and Vliegenthart1994), which up to now has not shown any homology to other polysaccharide structures found in nature. Initial experiments with a standard series of CCA (AWA-TCA) in buffer, urine and serum (from non-endemic controls) indicate the feasibility of the UCP-LF CCA assay (Fig. 4). Proper assay cut-off thresholds need to be determined with larger sets of urine and serum samples. The current LLOD in urine and serum is approximately 300 pg mL−1, with a somewhat higher background signal for the serum assay, but further optimization of the T and FC line of the LF strip and/or assay buffer conditions will probably increase the analytical sensitivity (performance of the assay without biological matrix) to the same level as the UCP-LF CAA assay. Filtration devices with varying molecular weight limits are being explored for removal of the above-mentioned natural background. The goal is to find a protocol that allows removal of the background to such an extent that CCA levels may be used to provide additional information. It is known from past ELISA results that the different schistosome species excrete CAA and CCA in varying quantities and that the antigens may exhibit different clearance patterns from the circulation (de Jonge et al. Reference de Jonge, Fillie, Hilberath, Krijger, Lengeler, de Savigny, van Vliet and Deelder1989; Agnew et al. Reference Agnew, Fulford, de Jonge, Krijger, Rodriguezchacon, Gutsmann and Deelder1995). For this reason, development of a multiplex assay allowing simultaneous and quantitative detection of both antigens on a single LF strip will be started. This assay will also contribute to the clarification of the clearance mechanism of the two antigens from the body, which is relevant for determination of treatment efficacy and the need for (rapid) retreatment. We suggest that such an approach would also be able to indicate species specificity (of S. mansoni and S. haematobium as well as other species, including the veterinarian species) and potentially allow identification of mixed infections.
Performance of the UCP-CCA assay. In the UCP-CCA assay the anti-CCA antibody #54-4C2 is immobilized at 200 ng per 4 mm on the T line of the LF strip (capture) and covalently coupled to the UCP reporter particle 25 μg per mg UCP reporter (detection). (Panel A) Ratio values determined with the UCP-CCA assay; analysis is of an AWA-TCA (3% w/w CCA) standard series in buffer, urine and serum. (Panel B) The UCP-CCA ratio value of 29 urine reference samples (various origins) compared with the visually recorded semi-quantitative POC-CCA test. The POC-CCA (RMD) scores are semi-quantified as: 0, trace, 1, 2, 3 or 4; 1 indicates the assay threshold below which samples are classified as no response (0) or a trace signal (TS), 1–4 indicate a low, medium, medium-high and high response, respectively.
Applications – quantitative genus-specific assays to measure response vs. infection intensity
Detection of CAA in serum or urine identifies infections by (probably) all known Schistosoma species. In addition to the major human species, CAA detection has also been demonstrated in Schistosoma intercalatum, Schistosoma matthei, Schistosoma bovis, Schistosoma curassoni, Heterobilharzia americana (Kremsner et al. Reference Kremsner, De, Simarro, Muhlschlegel, Mir, Sima, Feldmeier, Bienzle and Deelder1993; Agnew et al. Reference Agnew, Fulford, de Jonge, Krijger, Rodriguezchacon, Gutsmann and Deelder1995; Flowers et al. Reference Flowers, Hammerberg, Wood, Malarkey, van Dam, Levy and McLawhorn2002; Gabriel et al. Reference Gabriel, de Bont, Phiri, Masuku, Riveau, Schacht, Deelder, van Dam and Vercruysse2002) as well as Schistosoma mekongi, Schistosoma nasale, Schistosoma spindale and Schistosoma indicum (unpublished). Microscopy for schistosome eggs is generally only performed on either stool or urine depending on the expected Schistosoma species. It has been reported that in endemic areas with mixed infections, only one will be identified (usually S. haematobium as urine microhaematuria dipsticks allow easier detection of infections than stool microscopy necessary for S. mansoni) and large groups of infected patients could go undetected and untreated (Gutman et al. Reference Gutman, Fagbemi, Alphonsus, Eigege, Miri and Richards2008; Tchuem Tchuenté et al. Reference Tchuem Tchuenté, Momo, Stothard and Rollinson2013). With the recent demonstration of schistosomes being capable of forming hybrids between species that allows infection of both humans and ruminants, there will be a greater need for control programmes to identify these hybrid schistosome infections (Huyse et al. Reference Huyse, Webster, Geldof, Stothard, Diaw, Polman and Rollinson2009; Webster et al. Reference Webster, Diaw, Seye, Webster and Rollinson2013). Moreover, only standardized microscopy techniques for counting schistosome eggs provide a measure for the intensity of infection being linked with morbidity (King et al. Reference King, Dickman and Tisch2005). Obviously for these reasons a quantitative and genus-specific assay is preferred over a qualitative species-specific assay. It is also more useful for evaluating drug efficacy and studying (community) levels of associated morbidity, transmission pressure, anti-fecundity effects, as well as validation of elimination approaches. Previously CAA and CCA ELISAs have been shown to indicate infection intensities by significant correlations with egg counts as well as worm burdens in experimental infections (Deelder et al. Reference Deelder, Qian, Kremsner, Acosta, Rabello, Enyong, Simarro, Vanetten, Krijger, Rotmans, Fillie, de Jonge, Agnew and van Lieshout1994; Agnew et al. Reference Agnew, Fulford, de Jonge, Krijger, Rodriguezchacon, Gutsmann and Deelder1995; Wilson et al. Reference Wilson, van Dam, Kariuki, Farah, Deelder and Coulson2006). They were applied to, for example, analysis of worm burden variations (van Lieshout et al. Reference van Lieshout, Polderman, de Vlas, de Caluwe, Krijger, Gryseels and Deelder1995), determining different schemes of treatment (van Lieshout et al. Reference Deelder, Qian, Kremsner, Acosta, Rabello, Enyong, Simarro, Vanetten, Krijger, Rotmans, Fillie, de Jonge, Agnew and van Lieshout1994) or studying relations with different clinical appearances of the disease (de Jonge et al. Reference de Jonge, Rabello, Krijger, Kremsner, Rocha, Katz and Deelder1991).
Association between CAA levels, egg and worm counts
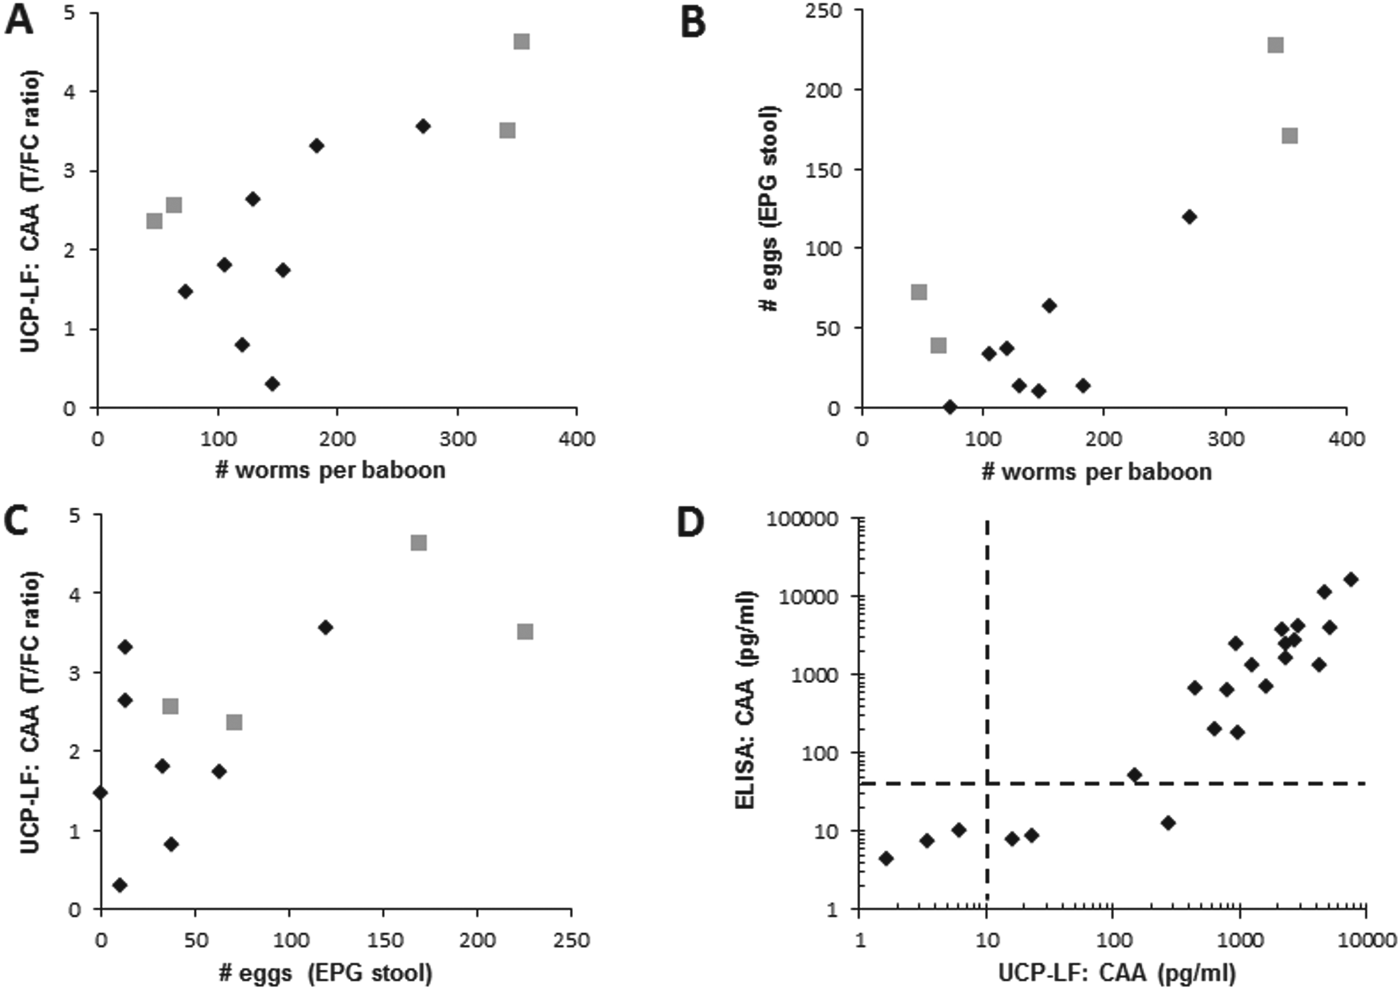
Using the more recently developed UCP-LF assays, previous ELISA data were confirmed with an improved resolution in the lower infection range (i.e. low worm burden). Figure 5 shows the relationship between CAA levels, worm counts and stool egg counts for a series of eight samples from previous vaccinated baboon studies (Kariuki et al. Reference Kariuki, Farah, Yole, Mwenda, van Dam, Deelder, Wilson and Coulson2004, Reference Kariuki, Farah, Wilson and Coulson2008; Wilson et al. Reference Wilson, van Dam, Kariuki, Farah, Deelder and Coulson2006), and four samples from a recent graded infection experiment (IPR, Nairobi, Dr Thomas Kariuki and Dr Philip LoVerde). Serum CAA levels (UCP-LF ratio value, Fig. 5A) and worm counts correlate well, similarly to (or slightly better than) egg and worm counts (Fig. 5B) or egg counts and CAA levels (Fig. 5C). This shows that the UCP-LF CAA assay can adequately estimate worm burdens especially at low egg counts; the UCP-LF CAA assay identified the baboon that had no eggs but 74 worms upon perfusion. Moreover, the fact that the UCP-LF CAA assay performed on a set of stored serum samples from almost 15 years ago still showed an excellent correlation with the previously determined CAA-ELISA (Fig. 5D) not only indicates the high stability of the polysaccharide analyte (CAA), but also the robustness of the immunodiagnostic assay even though testing was performed with a different mouse monoclonal anti-CAA antibody preparation and two different detection platforms.
CAA serum levels versus egg and worm count. (Panel A–C) The relation between the number of eggs per gram stool, serum CAA levels expressed as UCP-LF ratio values and the total number of worms counted after perfusion of 8 baboons from previous vaccination studies (diamonds) and 4 baboons from a graded infection experiment (squares, Kariuki and LoVerde, unpublished). (Panel D) Comparison of ELISA CAA concentrations as determined in baboon serum samples from previous vaccinations studies (Kariuki et al. Reference Kariuki, Farah, Yole, Mwenda, van Dam, Deelder, Wilson and Coulson2004, Reference Kariuki, van Dam, Deelder, Farah, Yole, Wilson and Coulson2006) vs. UCP-LF CAA concentrations determined during a visit in 2012 to IPR (Nairobi, Kenya) using the same stored serum samples (n = 24). The dotted lines indicate the assay value above which an exponential increase in signal is measured for both assays (van Dam et al. Reference van Dam, de Dood, Lewis, Deelder, van Lieshout, Tanke, van Rooyen and Corstjens2013).
Evaluating drug efficiency by changes in the CAA levels
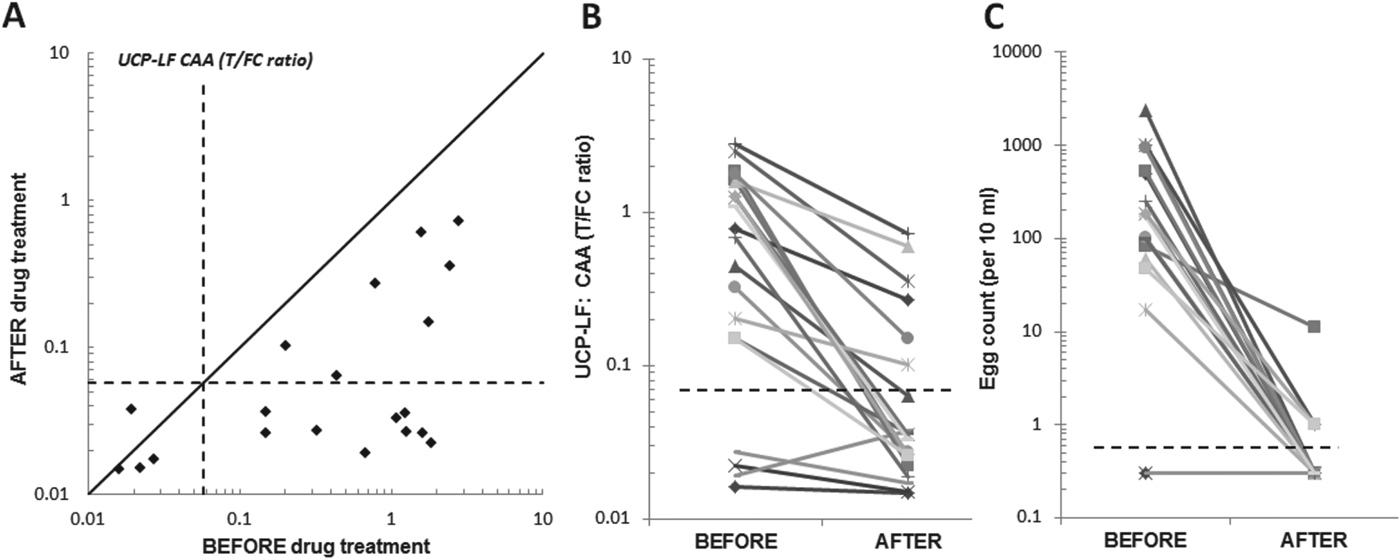
Analysis of the effect of drug administration by quantitation of CAA levels rather than monitoring egg production may provide more accurate results. Drug administration may only temporarily affect egg production and recapture later: not all worms may die, some worms may for a period of time suffer from the drug and not produce eggs, but eventually recover and again produce eggs. Determination of CAA levels immediately before and shortly after drug administration may be a better indicator for monitoring drug efficiency; CAA production will persist as long as there are live worms around, but probably at a lower level as compared with healthy worms. Factors regarding the antigen turnover time (clearance from the body; what is the optimal time point after drug administration to determine CAA levels?) and potential variation in concentration when analysing for example urine rather than blood, are still questions to be solved. Figure 6 shows the result of a study with a stored collection of urine samples from individuals with S. haematobium infections (Kahama et al. Reference Kahama, Kremsner, van Dam and Deelder1998); the set comprised four individuals without eggs in the urine and 16 with egg counts varying from 17 to 2380 eggs. CAA levels were determined before and 2 months after administration of the drug praziquantel. Panel A indicates that in all egg-positives the level of CAA decreases; however, the CAA concentration of seven individuals remains well above the cut-off threshold indicating a persistent active infection. Egg counts at 2 months post-drug treatment indicate three individuals with only 1 egg and one individual with 10 eggs. The decrease in urine CAA level indicates the effectiveness of the drug, but it also indicates that especially individuals with high egg counts may require a larger or multiple drug dose(s). Note that the UCP-LF CAA assay easily identified individuals with a low egg count.
CAA levels before and after drug treatment. A set of urine samples from 20 individuals before and 2 months after praziquantel treatment (Kahama et al. Reference Kahama, Kremsner, van Dam and Deelder1998) were analysed with the 20 μL urine UCP-LF CAA assay (UCAA10, wet reagents). (Panel A) Scatter plot of the UCP-LF ratio values measured in the UCAA10 before and after treatment with praziquantel. Dashed lines indicate the UCP-LF cut-off threshold (0·0571) determined for this particular set of samples. The solid line indicates the ‘no change in CAA concentration’ position; samples with values below this line indicate a decrease of the CAA concentration 2 months after treatment. (Panel B and C) The decrease in CAA concentration (UCP-LF ratio value) and number of eggs (10 mL urine filtrate) showing the respective values ‘before’ and 2 months ‘after’ treatment with praziquantel. Dashed lines indicate cut-off thresholds for the UCP-LF ratio value (0·0571, panel A) and the egg count (arbitrarily set at 0·5 eggs per 10 mL, 1 egg is the minimum number counted).
Saving cost – a pooling strategy
A so far unexplored but very appealing area is the use of pooled urine (or serum) samples as a realistic option for quantitative assays that allow simple and effective concentration of the sample. Using for instance a single 15 mL concentration device, a pool made up of 750 20-μL samples (TCA extracts from either blood or urine) can be analysed with a single UCP-LF test strip at an overall average analytical sensitivity of 10–30 pg mL−1. When targeting lower concentrations a larger sample volume (consequently fewer samples) should be used, or larger concentration devices or reloading of the device could be applied. This approach is also of interest when probing the overall effect of, for example, mass drug administration on larger groups of infected individuals. Pooling may turn out especially useful for the analysis of near-elimination settings (expected very low prevalence); the number of pooled samples should then be adapted to prevalence level, in fact similar to the pooling methodology applied by blood banks for nucleic acid-based blood screening.
Antibody – UCP-LF assay platform for antibody detection
The presence of antibodies against Schistosoma is a clear marker of (past) exposure to the pathogen and as such is most useful for diagnosis, for example, of people originating from non-endemic regions (Bergquist, Reference Bergquist1992). Although a limited correlation with infection intensity is sometimes observed (van Dam et al. Reference van Dam, Stelma, Gryseels, Falcao Ferreira, Talla, Niang, Rotmans and Deelder1996c), the presence of specific antibodies cannot be considered as an accurate marker for active Schistosoma infections. The absence of specific antibodies in most cases would indicate that no exposure has taken place in the past, although this may also be a consequence of chronic infection and/or indicate an immunocompromised individual or other unknown issue. It was shown (Whitty et al. Reference Whitty, Mabey, Armstrong, Wright and Chiodini2000) that about 30% of egg-positive cases had negative SEA serology, a phenomenon which was confirmed by others (unpublished).
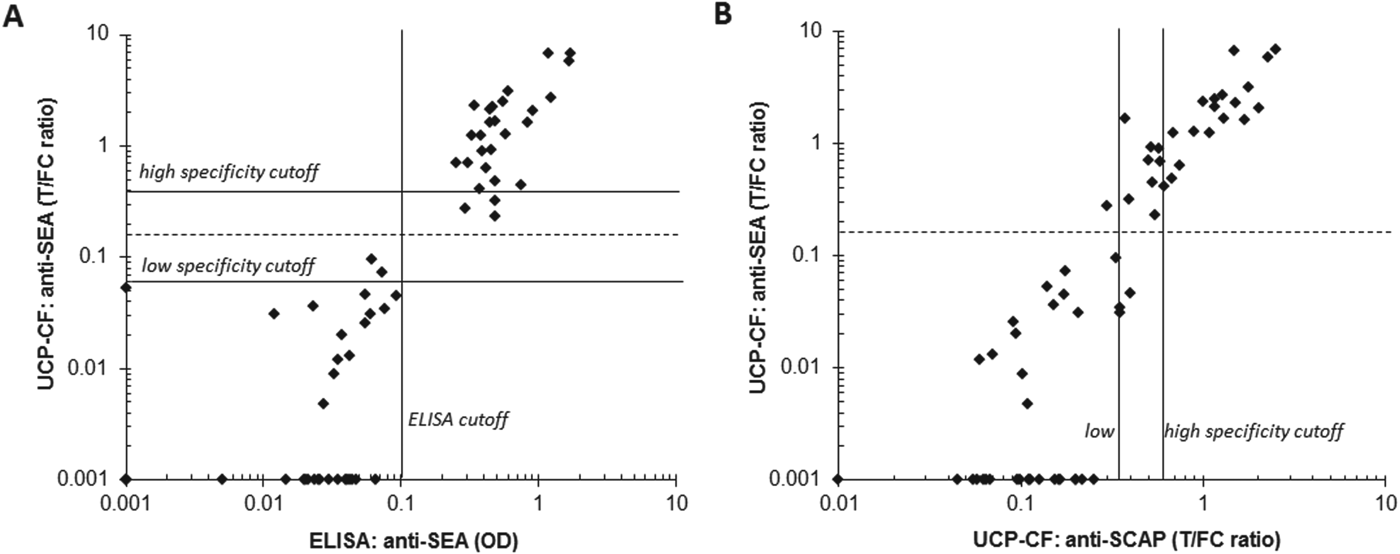
Results obtained with an in-house ELISA (Deelder and Kornelis, Reference Deelder and Kornelis1981) detecting IgG antibodies against Schistosoma SEA were used to evaluate two new UCP-LF based antibody assays. The assays, both developed by applying the consecutive flow (CF) format, use a generic Ig-specific protein-coated UCP label (Fig. 7). The CF consists of three rapid sequential flow steps that allow unrestricted enrichment of the targeted antibodies at their respective test lines before interaction with the generic Ig specific reporter. A set of samples from a previous WHO serum bank was analysed with two types of LF strips, one containing a T line comprised of SEA antigen and one with a T line of SCAP. Figure 8 (panel A) shows the excellent correlation of the SEA antibody ELISA and UCP-CF assays. The results (Fig. 8B) further indicate that SCAP extract provides a potential alternative for the more difficult to isolate SEA; SCAP is a crude antigen preparation from freshly shed cercariae whereas SEA is prepared from eggs recovered from the liver. Further optimization and evaluation of this assay is required to obtain the same level of specificity and sensitivity as the UCP SEA antibody assay. The UCP-LF antibody assays (UCP-CF) will also be analysed for applications using non-invasive samples such as urine and saliva: the presence of antibodies in urine was recently demonstrated for S. mansoni and S. haematobium (Elhag et al. Reference Elhag, Abdelkareem, Yousif, Frah and Mohamed2011), earlier studies mentioned detection of anti-S. mansoni (Santos et al. Reference Santos, Garcia, Orsini, Disch, Katz and Rabello2000); and anti-S. japonicum antibodies (Wang et al. Reference Wang, Xue, Lou, Zhang, Zhang, Wu and Shen2002) in saliva.
UCP-LF antibody detection format (anti-SEA and anti-SCAP). UCP-LF assay utilizing three sequential flow steps, referred to as consecutive flow (CF). The assay utilizes an Ig-specific label (UCP particles coated with protein A); disease/pathogen specificity is only determined by the T-line (capture zone) on the LF strip. Multiple T-lines can be used as shown in Fig. 1.
Performance of two UCP-CF antibody assays. Comparison of the UCP-CF antibody assays with an in-house ELISA to detect anti-SEA antibodies using a set of sera from a previous WHO serum bank, comprised of 28 antibody negatives and 34 antibody positives. (Panel A) The ELISA and UCP-CF performed with SEA. (Panel B) The UCP-CF assays performed with SEA and SCAP. The high and low specificity cut-off thresholds for this experiment are determined according to the protocol described for the antigen assay. The dotted line indicates a threshold for the UCP-CF SEA antibody assay such that the UCP-CF test results match the SEA antibody ELISA. The indicated ELISA cut-off is defined as the average value of the negatives plus 3 s.d.
SUMMARY
ASSURED assays (affordable, sensitive, specific, user friendly, rapid and robust, equipment free and deliverable for those who need them) are demanded for real-field applications. No single test is currently available for efficient and accurate screening of schistosomiasis over the full range of endemic and non-endemic situations. Only for intestinal schistosomiasis is an ASSURED test available, the POC-CCA test, applicable to detect active infections of S. mansoni in infected individuals with medium to high worm burdens. Assays applicable for intestinal as well as urogenital schistosomiasis with improved sensitivity and specificity are needed for the detection of the low infection grades (low worm burden and low or negative in egg count). The quantitative UCP-LF CAA assay has the capacity to determine active infections of various Schistosoma species with excellent clinical sensitivity and specificity, although it does not fulfil ASSURED requirements at the present time. The main focus in the development of this test was achieving the best possible, absolute sensitivity. The implementation of the concentration devices indicates that the UCP-LF CAA assay indeed may be able to detect active infections of a single worm. Moreover, the test can be used on blood-derived samples as well as non-invasively obtained samples such as urine and saliva. It is also important to realize that ultimate sensitivity (achieved using concentration devices) is not needed for most proposed field applications. We therefore note that the development/introduction of a simplified TCA-extraction step (in particular one omitting centrifugation) would be an important step forward in moving towards a low complexity UCP-LF field assay. The UCP-LF antigen assay also allows convenient multiplexing of CAA and CCA (and any other TCA-extracted antigen of which detection is sufficiently schistosome-specific). A parallel UCP-LF format is available for detection of antibodies (in various bodily fluids) to provide additional information on exposure. The applied rapid assay format seems well suited for multiplexing, allowing simultaneous detection of antibodies against other diseases in a format appropriate for field application as it does not require sample pre-treatment other than dilution in assay buffer.
Implications and outlook
The UCP-LF based antigen assays for human (as well as veterinary) schistosomiasis approach ultimate sensitivity for detection of active infections and are presented as robust low complexity (user-friendly) assay formats for screening and detection of low-grade infection in endemic areas. In combination with the (multiplex) rapid UCP-LF based antibody assays to indicate exposure and/or previous infections with Schistosoma as well as other pathogens, a complete set of assays using a similar platform is available. The assays can be performed on serum and plasma, as well as non-invasive sample fluids such as urine or possibly saliva; further research is required to clarify whether urine or saliva are full alternatives to blood-based testing.
ACKNOWLEDGEMENT
The British Society for Parasitology is acknowledged for the BSP autumn symposium (Liverpool, September 2013) where Dr Govert J. van Dam presented part of this work in a poster presentation. The invitation to contribute to this special issue of Parasitology was a result of the BSP meeting, for which we gratefully acknowledge Professor J. Russell Stothard (Liverpool School of Tropical Medicine).
FINANCIAL SUPPORT
Part of this development work received financial support from the University of Georgia Research Foundation, Inc., which was funded by the Bill & Melinda Gates Foundation for the SCORE project. The study was also funded in part by a grant [AI18867] from the National Institutes of Health (to Dr Philip T. LoVerde). The funders had no role in study design, data collection and analysis, decision to publish, or preparation of the manuscript.