Introduction
The determinants of electoral turnout and other aspects of political participation are classic questions in political science and continues to be at the forefront of the political science research agenda (Wolfinger and Rosenstone, Reference Wolfinger and Rosenstone1980; Blais, Reference Blais2006; Cox, Reference Cox2015) as well as normative discussions about democratic politics (Lijphart, Reference Lijphart1997). A recent revitalized both scholarly and normative discussion is whether constraints on government action reduce citizens' incentive and willingness to participate electorally and thus reduce electoral turnout (Steiner and Martin, Reference Steiner and Martin2012; Marshall and Fisher, Reference Marshall and Fisher2015; Steiner, Reference Steiner2016; Häusermann et al., Reference Häusermann, Kurer and Wüest2018). This paper deals with the subject of policy constraint and electoral turnout in the context of national fiscal rules.
National fiscal rules are of growing importance as governance institutions. National fiscal rules can be defined as rules or rulesets which by national law and/or regulation set numerical limits and/or guidelines for government debt, deficits and even revenue and expenditure (Schaechter et al., Reference Schaechter, Kinda, Budina and Weber2012, 5). Examples of national fiscal rules could be that the constitution states that the public budget should be in balance, that there exist expenditure ceilings for government expenditure, which the government needs to take into account when drafting the public budget, or the existence of a law which sets a maximum allowed level of public debt as a percentage of GDP. While an active research agenda in public economics assesses the potential effect of fiscal rules on government fiscal policy (Heinemann et al., Reference Heinemann, Moessinger and Yeter2018), the political effects of these types of formal constraints on government fiscal policy remain under-researched in political science. Which is, in contrast with the extensive research on the politics of central bank independence (Fernandez-Albertos, Reference Fernandez-Albertos2015), another potential constraint on government policy. Given that these types of rules deal specifically with a constraint on arguably one of the most important aspects of government policy—fiscal policy—and seem to be spreading fast among countries, confer Figure 1, this lack of scholarly interest is remarkable.
Share of the World's countries with national fiscal rules in place 1985–2014.
Note: Source is IMF's Fiscal Rules’ Database.

As these rules are increasingly being implemented nationally and are being increasingly promoted by international organizations such as the International Monetary Fund (IMF) and the European Union, they are also the subject of normative and public discussions, including their effects on the functioning of national democracy. As noted by the United Nations' and the International Labour Organization's staff members Anis Chowdhury and Iyanatul Islam in a critique of the increased tendency to implement fiscal rules, “If the intention is to remove discretion from politicians, then how can they implement their election manifestos? The national budget is an important instrument for fulfilling promises made by political parties. By removing this instrument, fiscal rules can potentially undermine accountable governance, especially in new democracies. Therefore, one may ask, “credibility for whom” – electorates or financial markets? Thus, by trying to enhance the credibility of governments in the eyes of financial markets, fiscal rules can undermine the credibility of a democratic polity.” (Chowdhury and Islam, Reference Chowhury and Islam2012).
However, these normative arguments about the potential impact of fiscal rules on national democracy are usually just based on assumptions rather than actual evaluations of the potential effects of these rules. While recent empirical and theoretical work indeed suggest that citizens' engagement with national politics can be negatively affected by formal constraints on government fiscal action (Hortala-Vallve and Larcinese, Reference Hortala-Vallve and Larcinese2017; Häusermann et al., Reference Häusermann, Kurer and Wüest2018), the democratic effects of the spread of fiscal rules have received no systematic empirical scrutiny. Unlike the issue of globalization and turnout (Steiner and Martin, Reference Steiner and Martin2012; Marshall and Fisher, Reference Marshall and Fisher2015; Steiner, Reference Steiner2016), no empirical research has been done on whether the introduction of fiscal rules will lower electoral turnout and whether these rules affect turnout inequality. This paper specifically addresses these issues.
Using parliamentary turnout data in a panel of 103 democracies, this paper tests the effect of both the existence and strength of national fiscal rules on electoral turnout. The use of fixed-effects estimation makes it possible to compare turnout levels within countries which experience changes in the fiscal rules framework and thus to better assess whether the enactment of fiscal rules actually reduces electoral turnout. The empirical results, however, lends little support for the argument that fiscal rules depress turnout levels. Only expenditure rules seem to have a clear negative association with the electoral turnout and even here the results are not particularly robust, especially when restricting the sample to the stable democracies of the OECD, where we should expect fiscal rules to be most effective.
Regarding inequality in turnout, further analysis of individual-level European data also suggests that fiscal rules do not increase inequality in electoral turnout between income groups either. Analysis of fiscal rules in Italian municipalities using a difference-in-discontinuity design provides further causal evidence that fiscal rules do not seem to matter for electoral turnout. While fiscal rules might under some circumstances constrain fiscal policy, they do not seem to affect electoral turnout.
Theory: fiscal rules as constraints
The basis for a relationship between fiscal rules and electoral turnout is that the incentive and willingness of citizens to turn out in elections are negatively affected by constraints on future government action and that fiscal rules can be seen as such a constraint. The general argument for a link between constraints on government action and electoral turnout rests on the classical assumption that one important aspect of citizens' choice of whether to turn out in elections is whether their vote actually matters for future government policy and societal outcomes (Downs, Reference Downs1957, 44). Constraints on the government's action should mean that the outcome of an election has a more limited chance of actually changing future policy and outcomes, even if the government has changed as a consequence of the election, which in turn reduce voters' propensity to vote in an election.
This argument follows the logic of a number of voting models. In a study of government constraint and electoral turnout, Marshall and Fisher (Reference Marshall and Fisher2015) model the constraining argument by using the classic calculus-of-voting equation (Riker and Ordeshook, Reference Riker and Ordeshook1968),Footnote 1 where increased government policy constraints lower the relative benefit from one's favorite candidate winning in an election which in turn reduces the incentive to vote. Similar results follow from applying other theoretical models of the voting action. Taking the view of the alternative calculus-of-voting model proposed by Franklin (Reference Franklin2004), increased formal policy constraints would lower the prospect for an election to bring about any substantive policy changes both positive and negative, which should decrease the substantive competition between the political parties running in the election which again would decrease citizens' incentive to vote (Franklin, Reference Franklin2004, 57).
The voting models and arguments mentioned above rest on a very instrumental view of the voting action, which has received substantial criticism in their failure to withhold empirical scrutiny.Footnote 2 However, also more non-instrumental arguments can be made in favor of policy constraints as having a negative effect on turnout. If citizens increasingly view the government as being unable to actually change policy and/or having less legitimacy due to being subject to different rules and external constraints, rather than the wishes of the voters, they could view the voting action as illegitimate and thus be more likely to abstain, see Birch (Reference Birch2010, 1602–1603) and Miles (Reference Miles2015) for discussions about legitimacy and turnout.Footnote 3 So for both instrumental and non-instrumental reasons, increased policy constraints in the political sphere should have a negative effect on turnout.
Most scholarship and normative discussions about the effect of policy constraint on electoral turnout has dealt with globalization and other types of international economic integration (Steiner and Martin, Reference Steiner and Martin2012; Marshall and Fisher, Reference Marshall and Fisher2015; Steiner, Reference Steiner2016). The central argument in these studies is that increasing economic interdependence and capital mobility will constrain national governments in the economic policies they are able to pursue and thus reduce voters' incentive to participate electorally since the scope of economic policy change has been narrowed.Footnote 4 Empirically, these studies have generally confirmed this negative relationship between globalization and electoral turnout and have thus provided evidence in favor of the argument that constraints on government action reduce turnout. Häusermann et al. (Reference Häusermann, Kurer and Wüest2018) take this perspective to the area of fiscal policy, and their results also suggest that constraints on government fiscal policy in the form of high government deficits and high government interest rates reduce turnout among citizens.Footnote 5
However, until recently the literature on constraints on government action and turnout ignored the potential effect of fiscal rules on turnout, even though these rules specifically acts as formal constraints on government fiscal policy, through the existence of expenditure ceilings, rules for when public debt can be issued and numerical limits on government deficit and debt levels. Taking the perspective from the government constraints literature, we should expect these rules to affect electoral turnout negatively in the countries they are enacted in.
A recent exception to the scholarly void regarding fiscal rules and turnout is a paper by Hortala-Vallve and Larcinese (Reference Hortala-Vallve and Larcinese2017) who has developed a theoretical model which deals with a formal constraint on government fiscal policy choices. Here, the argument is that as a government faces more policy restrictions, especially within fiscal policy, voters will have less incentive to acquire political information. This will in turn lower turnout, especially among relatively poorer voters.Footnote 6 Consequently, even fiscal policy constraints and rules specifically designed to increase the welfare of voters, including poorer voters, can increase turnout inequality and—under some circumstances—lower redistribution and consequently negatively affect poorer voter's welfare through the turnout channel.Footnote 7 According to these arguments, we should expect fiscal rules not only to decrease aggregate turnout but also to increase turnout inequality.Footnote 8 However, while building on a large theoretical and empirical literature within the turnout and redistribution research agenda (Hortala-Vallve and Larcinese, Reference Hortala-Vallve and Larcinese2017, 411–414), this paper is purely theoretical.
Thus, according to the theoretical and empirical literature on constraints on government action and turnout, fiscal rules should both decrease aggregate electoral turnout and increase turnout inequality. This paper puts these arguments to empirical testing.
Fiscal rules and aggregate turnout: data and estimation
To test the effect of fiscal rules on aggregate electoral turnout, I use a dataset of turnout in parliamentary elections in a wide variety of countries in the years 1985–2012. All countries—which regularly hold elections—hold parliamentary elections and most democratic legislative assemblies have substantial power over fiscal policy,Footnote 9 and the enactment of the public budget is usually the prerogative of the legislature. Given that turnout determinants seem to differ between democracies and non-democracies (i Coma, Reference i Coma2016), I restrict the study to democracies, which I define as countries having a score on the well-known polity2 index above 5. I also look at the relation between fiscal rules and turnout among in a more restricted sample consisting of the more economically developed and political stable countries of the OECD, where government efficiency is greater and fiscal rules, therefore, should be expected to be more effective (Bergman and Hutchison, Reference Bergman and Hutchison2015) and thus more likely to act as a de-facto constraint on government policy.
As the measure of electoral turnout, I use turnout as a percent of voting age population. This measure is a somewhat more uncertain measure of turnout than using turnout as a percent of registered votersFootnote 10 but it has the advantage of taking into account the incentive to even register as a voter, which could also be affected by fiscal rules and other policy constraints. Using turnout as a percent of registered voters yields largely similar results.Footnote 11 Turnout data are from the International Institute for Democracy and Electoral Assistance's Voter Turnout Dataset (IDEA, 2016).
The central independent variables are national fiscal rules. These rules thus exclude supranational fiscal rules such as those associated with currency unions such as the European Union's Economic and Monetary Union. The focus on national fiscal rules enables me to test the more pure effect of fiscal rules on electoral turnout, whereas potential effects of supranational fiscal rules might capture the turnout effects of closer political-economic integration rather than the effects of fiscal policy rules. National fiscal rules are measured by two types of variables for each type of fiscal rules as defined by the IMF (Schaechter et al., Reference Schaechter, Kinda, Budina and Weber2012, 7–9):
• Expenditure rule.
• Revenue rule.
• Deficit rule.
• Debt rule.
The main type of variable is a simple dummy which takes the value 1 if the country has a fiscal rule of the given type in place which has a statutory or constitutional basis. These types of fiscal rules should at least officially be legally binding for fiscal policymakers and thus act as a formal constraint on national fiscal policy.
The other type of fiscal rule variable is an index which measures the strength of each type of fiscal rule. A description of the construction of these indexes is found in the online Appendix D. The data for fiscal rules is from the IMF's Fiscal Rules' Database (Bova et al., Reference Bova, Kinda, Muthoora and Toscani2015).
As control variables,Footnote 12 I include a number of economic and political controls, which are generally viewed as influencing turnout level in the comparative turnout literature (Blais, Reference Blais2006). They include log of GDP per capita in constant dollars from the World Bank's Database to control for the economic development of the country, a dummy for whether the country has a proportional electoral systemFootnote 13 and a dummy for whether voting is compulsory,Footnote 14 which have all been found to be positively associated with the turnout. I also include the log of population from the World Bank's Database in order to control for changes in country population size, since turnout might be larger in smaller nations (Blais, Reference Blais2006, 117). Since the level of government debt might be endogenous to the enactment and strengthening of fiscal rules (Altunbas and Thornton, Reference Altunbas and Thornton2017) and might also constrain government fiscal policy,Footnote 15 general government gross debt as a percentage of GDP is also added as a control. Data from this variable are from the IMF's Economic Outlook database. Descriptive statistics can be found in the online Appendix A.
To estimate the effect of fiscal rules on turnout, I run a number of ordinary least squares models with country-fixed effects. Using country-fixed effects enable me to hold constant potential unobserved time-invariant factors which might confound both national fiscal rules as well as turnout level and general political culture. These include legal origin (Alt and Lassen, Reference Alt and Lassen2006) and the historical nature of fiscal relations between the executive and legislative branch (Wehner, Reference Wehner2006).Footnote 16 By using country-fixed effects, I analyze changes in turnout within countries, since I analyze deviations from the country mean. Year-fixed effects are included in order to take a time trend into account which might correlate both with a development in electoral turnout and the tendency for more countries to adopt fiscal rules and strengthen their existing fiscal rules' frameworks (Schaechter et al., Reference Schaechter, Kinda, Budina and Weber2012, 10–12).
Using this estimation method, I am thus able to compare turnout within a country in periods where the country had one or more fiscal rules in place to periods where the country did not have one or more fiscal rules in place. This approach resembles a difference-in-difference design and should identify the effect of fiscal rules on turnout assuming parallel trends (Angrist and Pischke, Reference Angrist and Pischke2009, 227–241). In order to address issues of autocorrelation, I cluster the standard errors at the country-level. The equation for the estimation can be seen below with countries index by i and years by t.

where Turnout is turnout in country i in an election at time t. Fiscal rule is either one of the dummies for a fiscal rule with statutory or constitutional basis or the index for the fiscal rule strength. X is a vector of control, while γ t and δ i is the year- and country-fixed effects respectively. ε is the error term.
Results: aggregate turnout
In Table 1, the results from the analysis of fiscal rules with statutory and/or constitutional basis on aggregate turnout are reported. Overall, the results do not support the argument that fiscal rules depress turnout as should be expected from the constraining argument. Only expenditure rule behaves as expected and seems to have a negative effect on turnout. An effect which is only statistically significant at the p < 0.10-level. However, its substantial size is non-trivial. The introduction of an expenditure rule with statutory and/or constitutional basis seem to lower turnout with about three percentage points on average. However, when running an F-test after the estimation in model five, we cannot reject the hypothesis that the effect of the expenditure rules dummy is equal to the other fiscal rules dummies. Government gross debt seems to have no statistically significant effect on turnout, although the coefficient is negative as expected.
Fiscal rules dummies and turnout

Note: Dependent variable is turnout as percent of voting age population. Country-clustered standard errors in parentheses.
*: p < 0.10, **: p < 0.05, ***: p < 0.01.
Of the other cross-national determinants of turnout, which are included as controls, they either show no statistically significant effect on turnout or for the proportional electoral system the opposite than expected effect. However, the majority of these variable exhibits very little to no within-country variation in the analyzed time period, and changes to electoral system type and compulsory voting only occur in very few countries.Footnote 17 When looking at democracies across time, there seems to be limited evidence in favor of the argument that fiscal rules, since they constrain government policy choices, depresses turnout. Only an expenditure rule seems to have a statistically significant negative effect on turnout. However, even there the effect is not strongly statistically significant and does not seem to be statistically different from the null effects of the other fiscal rules.
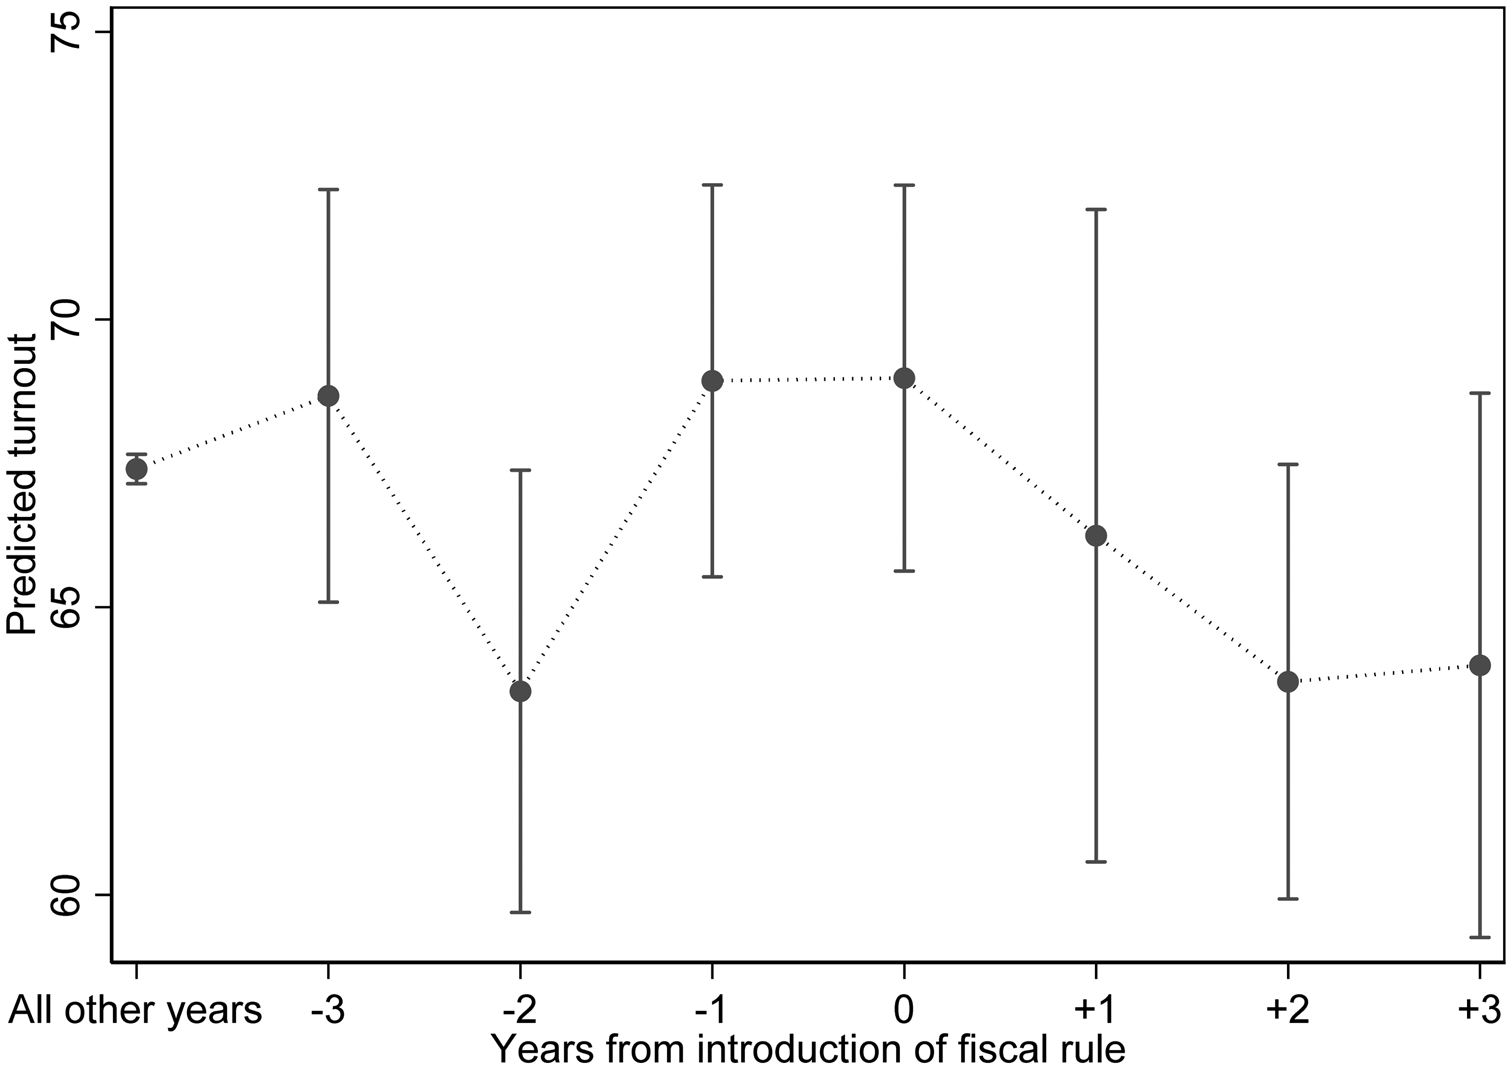
The introduction of a fiscal rule, with the possible exception of an expenditure rule, does not seem to have an effect on electoral turnout. However, a concern might be that the introduction of some sort of national fiscal rule was preceded by a general trend towards higher or lower electoral turnout, which might influence the interpretation of the above results and invalidate the model as a difference-in-difference estimate. In Figure 2, electoral turnout is therefore analyzed and plotted before and after the introduction of any fiscal rule with a statutory and/or constitutional basis.Footnote 18 Looking at Figure 2, there does not seem to be any statistically significant effect of the introduction of a fiscal rule. The results also suggest no systematic trend in electoral turnout before the introduction of a national fiscal rule with a statutory and/or constitutional basis.
Predicted turnout in the years before and after fiscal rule introduction.
Note: Vertical lines show 90 percent confidence intervals.

In a similar exercise in line with the difference-in-difference logic (Angrist and Pischke, Reference Angrist and Pischke2009, 237–241), country-specific time trends are added to the estimations in Table 1. The results are largely similar to the results from Table 1, only expenditure rule seems to have a statistically significant effect on turnout. However, this is no longer the case when the sample is restricted to OECD countries, where none of the fiscal rules dummies have any statistically significant impact on turnout once country-specific time trends are included.Footnote 19
The results above are largely similar when the fiscal rules dummies are replaced with the indexes for fiscal rule strength. Only the strength of fiscal rules related to public expenditure seems to decrease average level of electoral turnout which provides substantial evidence against the argument that the constraint imposed by fiscal rules should decrease electoral turnout. These results are also robust to controlling for the influence of international organizations. These analyses can be found in Appendix D.
In Appendix E, the sample is restricted to the general political stable and affluent countries of the OECD and the estimation from Table 1 and Appendix D are rerun. While the results are largely similar to the results from the wider panel of democracies, the negative effect of expenditure rule existence and expenditure rule strength decreases substantially, and expenditure rule strength is no longer a statistically significant predictor of turnout rates. The results suggest either a substantial difference in the effect of expenditure rule on turnout levels between OECD countries and other electoral democracies or more likely that the negative association between expenditure rule and turnout levels previously found might be a statistical fluke rather than a true effect. Especially, since expenditure rules are much more common in OECD countries compared to other democratic countries.Footnote 20 Furthermore, due to greater government efficiency in OECD countries, expenditure rules are probably more likely to be properly implemented and thus act as a de-facto constraint on government fiscal policy in OECD countries.
With the somewhat uncertain exception of expenditure rule, national fiscal rules do not seem to lower the aggregate level of electoral turnout in contrast to the argument that constraints on government action reduce turnout.
Fiscal rules and inequality in turnout: individual-level analysis
The results from the previous section suggest that fiscal rules do not seem to have a particular robust effect on aggregate electoral turnout. However, since the analysis relies on aggregate turnout data, this approach to analyzing the relationship between fiscal rules and electoral turnout does not take into account potential heterogeneous effects of fiscal rules on different types of citizens' propensity to turn out in elections. In line with the logic of Hortala-Vallve and Larcinese's (Reference Hortala-Vallve and Larcinese2017) model, the formal constraint on public policy—such as fiscal rules—might disproportionally decrease the incentive to turn out in elections among relatively poorer voters, while it might not decrease or even increase turnout propensity among more well-off voters.Footnote 21 Taking this perspective, fiscal rules might not have an impact on overall turnout levels but might increase inequality in electoral turnout.Footnote 22 To address this issue, I turn to analyze individual-level data on voter turnout and relative income and its interaction with fiscal rules.
The data for this part of the analysis is the first seven rounds of the European Social Survey (ESS), which consists of individual-level survey data for 32 European countriesFootnote 23 and has been collected every other year from 2002 to 2014. To estimate the effect of fiscal rules on individuals' propensity to turn out in elections, I run a number of linear probability models, where the dependent variables are dummy which takes the value 1 if the respondent voted in the last national election.Footnote 24 A linear probability model is used due to the difficulty of interpreting interaction terms in non-linear estimations (Ai and Norton, Reference Ai and Norton2003). However, the results are not substantially different when running the models with a logit estimator.Footnote 25 As the independent variable, I use an interaction between the existence of the different type of fiscal rules in the country of the respondent and the respondent's household's income decile, based on self-reporting in the ESS survey.Footnote 26 If fiscal rules would increase the inequality in turnout between individuals from high income versus low-income households, we should expect a positive and statistically significant effect of this interaction variable.
I also include a number of individual-level controls including marital status, whether the respondent is unemployed as well as the age and the square of age of the respondent. I also include the education level of the respondent.Footnote 27 These types of predictors of individual-level turnout are some of the most commonly used in the literature (Smets and van Ham, Reference Smets and van Ham2013, 348–350) and are also used in other studies, which relies on the ESS data to study turnout (Jensen and Jespersen, Reference Jensen and Jespersen2017). The regression equation can be seen in Equation 2, where each respondent is indexed by r, each round of the ESS survey by e and each country by i. Y is whether the respondent voted in the last national election, Fiscal rule is the existence of at fiscal rule with a statutory and/or constitutional basis in the relevant country at the time of the ESS round, and Income is the respondent's household's income decile. The constituting items of this interaction are also included in the estimation and are denoted by C. X is a vector of controls, γ e is the ESS round-fixed effects, δ i is the country-fixed effects,Footnote 28 while ε is the error term.

Since fiscal rules only exhibit variance at the country-level, standard errors are clustered by country.
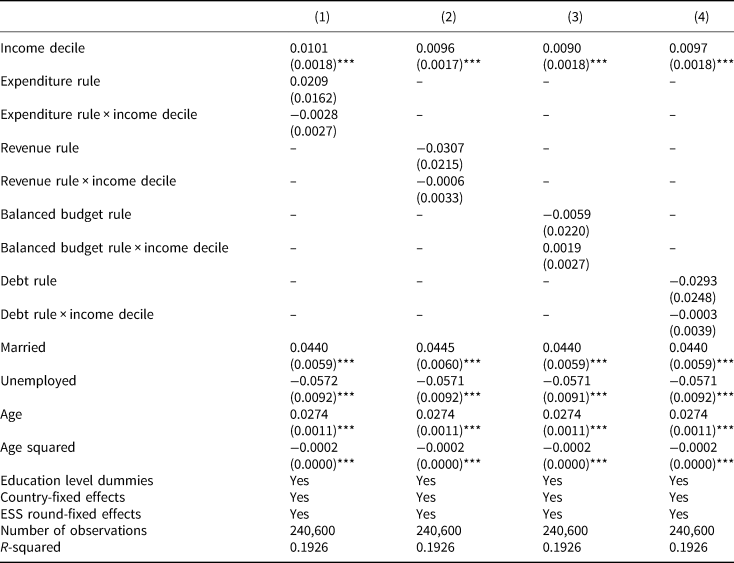
The results for the linear probability models can be found in Table 2. Contrary to the expectation that fiscal rules increase turnout inequality, the interactions between the income decile variable and the different fiscal rules are all clearly statistically insignificant and some even have a negative sign.Footnote 29 While relative income status does seem to increase the propensity to have voted in the last election, in all estimations, this effect is not magnified by the existence of fiscal rules with statutory and/or constitutional bases. The results are similar if the dummies for the different fiscal rules are replaced with the fiscal rules indexes. These results can be found in Appendix F. The results from the individual-level analysis thus suggest that national fiscal rules do not seem to increase inequality in turnout between high- and low-income individuals.
Fiscal rules and inequality in turnout with ESS data

Note: Dependent variable is whether the respondent voted in the last national election. Country-clustered standard errors in parentheses.
*: p < 0.10, **: p < 0.05, ***: p < 0.01.
Addressing causality: difference-in-discontinuity evidence from Italian municipalities
The results from the above analyses seem to suggest that the existence and strength of national fiscal rules have little to no robust effect on aggregate level turnout and do not seem to either increase or decrease inequality in electoral turnout. However, while Figure 2 suggest that the introduction of fiscal rules are not preceded by any noticeable trends in electoral turnout in the studied countries, issues of causal identification might still be raised. In order to address the causal identification of the null effect of fiscal rules on electoral turnout, I exploit a discontinuity among Italian municipalities previously used to study the pure fiscal policy effects of subnational fiscal rules (Grembi et al., Reference Grembi, Nannicini and Troiano2016). This enables me not only but also to investigate the effect on fiscal rules on electoral turnout in an additional empirical setting but also, through the use of a population-based regression-discontinuity design, to causally identify potential effects on turnout of being subject to a fiscal rule.
In 1999, Italian municipalities became subject to the so-called Domestic Stability Pact, which through the Italian annual budget law sought to restrain growth in the annual deficits of Italian municipalities. This deficit growth target was set to zero percent in the years 1999, 2000, 2003 and 2004, 3 percent in 2001 and 2.5 percent in 2002.Footnote 30 The sanction for non-compliance was severe cuts in central government transfers and reimbursements as well as a ban on municipal hiring, so this fiscal rules framework was both a substantial restraint on local fiscal policy and provided a large incentive to adhere by the rules locally. However, in 2001, the Italian central government relaxed these rules so that they did not cover municipalities below 5000 inhabitants (Grembi et al., Reference Grembi, Nannicini and Troiano2016, 6–7). In this way, this reform created a sharp discontinuity between municipalities subject to the fiscal rules and municipalities not subject to the fiscal rules, which makes this cut point ideal for identifying the causal effect of fiscal rules through a regression-discontinuity design including their potential effects on electoral turnout. If fiscal rules causally decrease electoral turnout, we should expect turnout in municipal elections to be higher in municipalities just below the 5000 inhabitant threshold compared to municipalities just above the 5000 inhabitant threshold.
However, since the 5000 population threshold also increases the local mayor's wage, which previous research has found to substantially increase electoral turnout in Italian municipalities (De Benedetto and De Paola, Reference De Benedetto and De Paola2017), a simple regression discontinuity design is invalidated since the threshold policy treatment is confounded by this other policy change (Eggers et al., Reference Eggers, Freier, Grembi and Nannicini2018). In order to address this issue, I follow the methodology of Grembi et al. (Reference Grembi, Nannicini and Troiano2016) and exploit the fact that the bump in the mayor's wage at 5000 inhabitants was in place throughout the entire period while the exemption of the fiscal rules only happened from 2001 and onwards. As shown by Grembi et al. (Reference Grembi, Nannicini and Troiano2016, 8–12), adequately controlling for both the population threshold and the period where the fiscal rules were relaxed can causally identify the effects of relaxing the fiscal rules which can be denoted as a difference-in-discontinuity research design. The estimation itself is done by a local linear regression, where the effect of simultaneously being below the 5000 threshold in the year 2001 and after is estimated for municipalities just below and just above the 5000 inhabitant threshold. I follow Grembi et al. (Reference Grembi, Nannicini and Troiano2016) and estimate the bandwidth lengths using the updated software package by Calonico et al. (Reference Calonico, Cattaneo, Farrell and Titiunik2017)Footnote 31 based on Calonico et al. (Reference Calonico, Cattaneo and Titiunik2014). I also report estimations from higher and lower bandwidths as a robustness check. The regression equation itself can be seen in Equation 3.

The variable of interest to estimate the effect of relaxing fiscal rules on turnout is the PR tT i interaction where PR i is a dummy for whether the municipality is below the 5000 inhabitant threshold and T i is a dummy for the 2001 and after a period. If being subject to fiscal rules would reduce electoral turnout, we should expect the coefficient for this interaction to be positive and statistically significant. PI it is a variable measuring the distance to the 5000 inhabitant threshold. The data for population size is from a version of the dataset used by Grembi et al. (Reference Grembi, Nannicini and Troiano2016) and is originally from the Italian Ministry of Interior,Footnote 32 which is merged with municipal turnout data which is from the Italian Home Office.Footnote 33 The dataset only contains Italian municipalities with between 3500 and 7000 inhabitants and excludes municipalities in regions with special autonomy.Footnote 34
The results for this difference-in-discontinuity design can be seen in Table 3. In column one, the estimation is done using a bandwidth length calculated using the Calonico et al. (Reference Calonico, Cattaneo, Farrell and Titiunik2017) algorithm. If fiscal rules indeed decrease electoral turnout, we should expect the effect of the relaxation of the fiscal rules to be positive and statistically significant. However, contrary to this expectation, the beta coefficient in column one is strongly statistically insignificant. It stays insignificant with both decreasing and increasing the bandwidth lengths in columns two to four, and even in one instance becomes negative.
Difference-in-discontinuity estimations

Note: Dependent variable is turnout in municipal elections. Column one reports bandwidths based on the algorithm of Calonico et al. (Reference Calonico, Cattaneo, Farrell and Titiunik2017). Municipal-clustered standard errors in parentheses.
*: p < 0.10, **: p < 0.05, ***: p < 0.01.
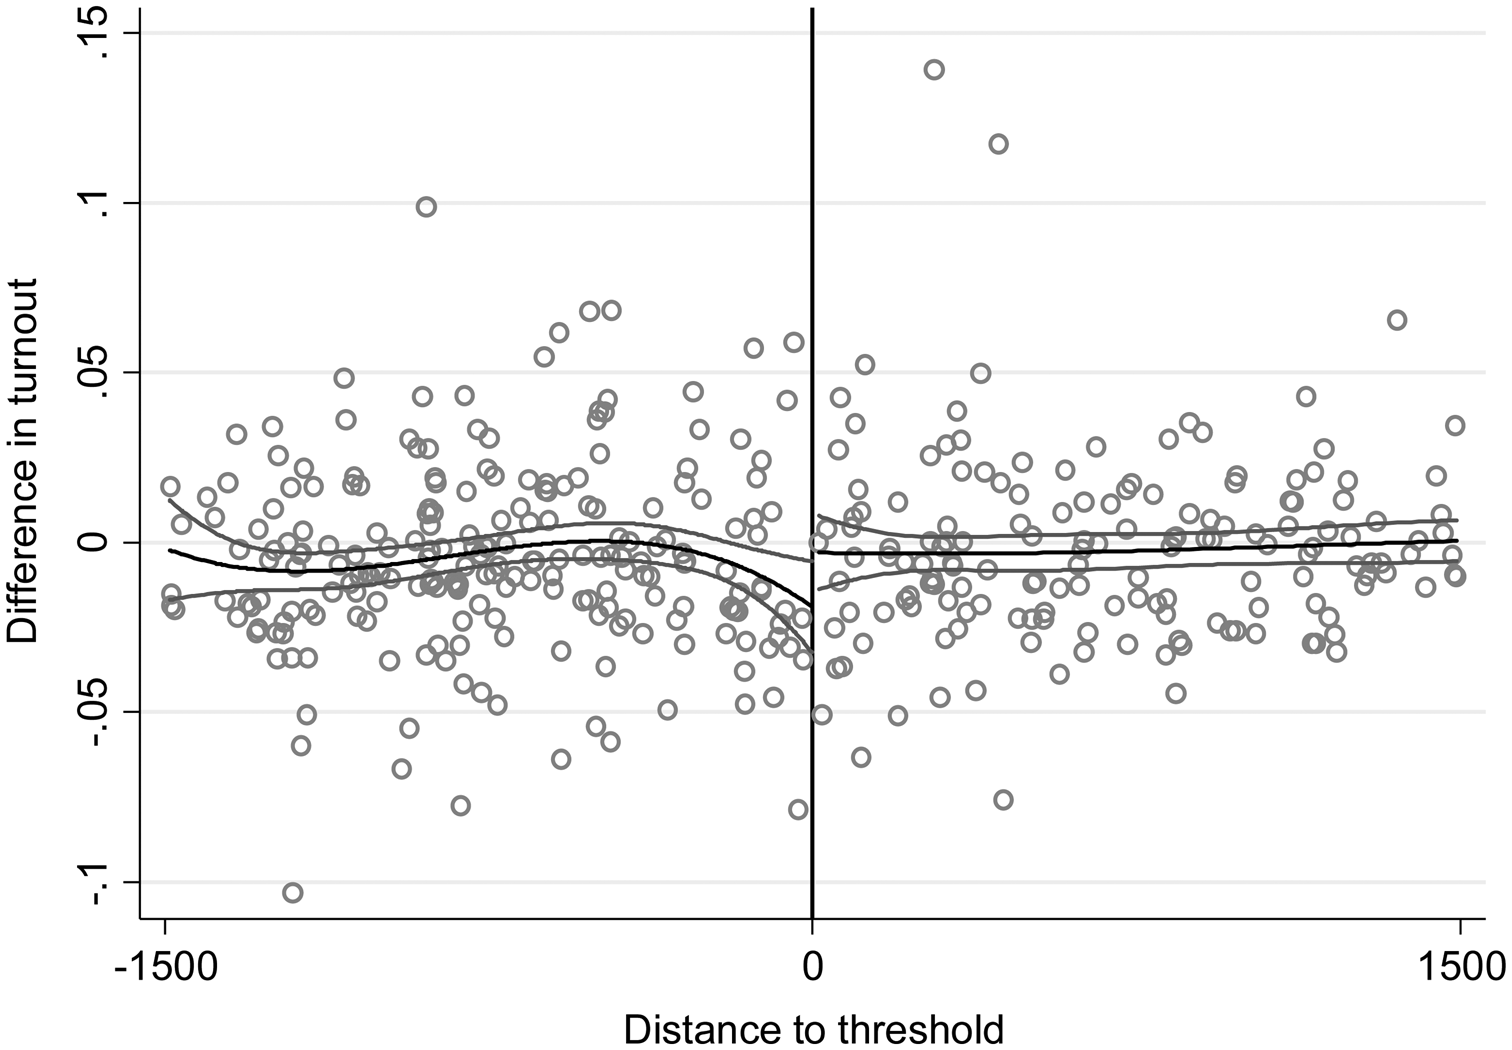
In Figure 3, the difference-in-discontinuity result is shown visually following the methods of Grembi et al. (2016, 16–17). Here, the y-axis represents the within-municipality difference in turnout between the years where the fiscal rules were relaxed (in the year 2001 and beyond) and the years where these rules were in place for all municipalities (1999 and 2000) and the x-axis the distance to the 5000 inhabitant threshold. Again, there is no evidence for a systematic increase in turnout below the 5000 inhabitant threshold, where the fiscal rules were not in place after 2000. These results suggest no effect of fiscal rules on electoral turnout in Italian municipalities. Even when the effects of fiscal rules are locally causally identified, fiscal rules do not seem to have any effect on electoral turnout.
Difference-in-discontinuity estimate.
Note: The inner line represents a third-order polynomial fit. Outer lines represent 90 percent confidence intervals.

Discussion and conclusion
A popular theoretical argument in the study of electoral turnout is that constraints on government action reduce electoral turnout. Within the area of government fiscal policy, fiscal rules, which are spreading fast among countries, could be an important constraint on government fiscal policy. This paper has investigated empirically whether the enactment of fiscal rules and the stringency of the fiscal rules' framework matter for electoral turnout and turnout inequality in democracies. Contrary to recent theoretical arguments (Hortala-Vallve and Larcinese, Reference Hortala-Vallve and Larcinese2017), however, there seems to be little statistically robust evidence in favor of fiscal rules having a negative effect on within-country electoral turnout levels. Only the existence and strength of fiscal rules related to public expenditures has a statistically significant negative association with turnout. An effect which is not robust to restricting the panel sample to OECD countries where the effect of fiscal rules on turnout should be expected to be the largest. An analysis of individual-level data from the European Social Survey also suggests that fiscal rules do not increase inequality in turnout propensity between individuals from low and high-income households. Further evidence from a difference-in-discontinuity design using Italian municipal data suggest that these null findings are plausible causally identified. While fiscal rules might matter for government fiscal policy they do not seem to matter much for voters' willingness to participate electorally.
The question remains for why we observe these general non-findings? The obvious explanation is of course that fiscal rules might not really be a constraint on government fiscal policy, in which case it makes sense that they do not lower aggregate turnout levels or affect inequality in electoral turnout. It is still an on-going scholarly debate whether fiscal rules actually have a causal effect on fiscal policies (Heinemann et al., Reference Heinemann, Moessinger and Yeter2018). Another possibility is that even if fiscal rules really constrain fiscal policy, voters might not be aware of the existence and effectiveness of fiscal rules. A crucial assumption in the argument of Hortala-Vallve and Larcinese (Reference Hortala-Vallve and Larcinese2017) is that the voters actually know that public policy is constrained by a policy rule which might not be a realistic assumption. Another possibility is that voters might know both the existence and potential effects of fiscal rules but that they do not factor it when making the decision to turn out to elections or not. Instead, non-instrumental drivers of turnout might be far more important than whether elected officials will be constrained in their fiscal policy choices. In this way, the paper contributes to the classic and continuing discussion in political science about the contributions and limitations of instrumental and/rational choice models of the voting action (Aldrich Reference Aldrich1993, Green and Shapiro, Reference Green and Shapiro1994, 47–71; Enos and Fowler, Reference Enos and Fowler2014).
However, even accepting that the eventual policy outcome of elections might matter for turnout, the results of this paper suggest that perhaps not all formal and informal constraints on government action are created equal with regards to their effect on turnout. Many types of structural and institutional constraints on government policies might affect turnout negatively (Steiner and Martin, Reference Steiner and Martin2012; Marshall and Fisher, Reference Marshall and Fisher2015; Steiner, Reference Steiner2016; Häusermann et al., Reference Häusermann, Kurer and Wüest2018) but the results of this paper show that the story of increased government constraints as inevitably leading to lower citizen political engagement might be too simplistic. Future research should keep this in mind and perhaps also be more open to pursuing and publishing null results within this research agenda. As the results from Italian municipalities show, increased use of causal identification in this research area might be a fruitful way to pursue better effect estimates and to supplement previous country-level regression studies.
The findings also speak to discussions about inequality in voting and related distributive issues. In the wealthy OECD countries, where we should expect turnout inequality to be highest (Kasara and Suryanarayan, Reference Kasara and Suryanarayan2015), the effects of fiscal rules on turnout were generally most statistically non-robust. Furthermore, the results from the European Social Survey data also suggest that fiscal rules might not increase the effect of relative income status on the propensity to turn out in elections, at least in European countries. These results cast some doubt on whether fiscal rules really matter for not only total electoral turnout but also turnout inequality and subsequent the welfare of poorer voters. If fiscal rules do not matter for aggregate turnout or inequality in turnout, the results of this paper speak to the wider scholarly and policy discussion about the distributional consequences of fiscal rules. At least the political participation channel suggested by Hortala-Vallve and Larcinese (Reference Hortala-Vallve and Larcinese2017) might not be the relevant channel for how fiscal rules affect redistribution and inequality.
The results of this paper thus suggest that perhaps the issue of electoral and other types of political participation, as well as the issue of inequality of political participation, are lesser concerns in the discussion on the desirability of fiscal rules. The enactment and strengthening of national fiscal rules might indeed have distributional consequences, but the results of this paper suggest that this might not happen through an electoral channel. In a time when fiscal rules are spreading fast among countries, policymakers and scholars should have these results in mind when discussing the pros and cons of fiscal rules.
Author ORCIDs
Lasse Aaskoven, https://orcid.org/0000-0001-5489-9785.
Supplementary material
The supplementary material for this article can be found at https://doi.org/10.1017/psrm.2019.27
Acknowledgments
I would like to thank Jonas Hedegaard Hansen, Benjamin C. K. Egerod, Carsten Jensen, Asmus Leth Olsen, Martin Vinæs Larsen, Johannes Lindvall, seminar participants at the London School of Economics and the University of Copenhagen, panel participants the annual conference of the European Political Science Association in 2017 as well as the editor of Political Science Research and Methods and two anonymous reviewers for helpful suggestions and advice. Special thanks go to Veronica Grembi and Nicola Mastrorocco for generously sharing their data on Italian municipalities. All errors and shortcomings remain my own.