




No CrossRef data available.
Article contents
- Abstract
- THE LEGACY OF INEQUALITY IN U.S. EDUCATION
- INEQUALITY AND SEGREGATION
- UNEQUAL ACCESS TO QUALIFIED TEACHERS
- ACCESS TO HIGH QUALITY CURRICULUM
- EDUCATIONAL OUTCOMES
- NEW STANDARDS AND OLD INEQUALITIES
- THE LEGAL BATTLE FOR EDUCATIONAL EQUITY
- POLICY FOR EQUALITY: TOWARD GENUINE SCHOOL REFORM
- References
THE COLOR LINE IN AMERICAN EDUCATION: Race, Resources, and Student Achievement
Published online by Cambridge University Press: 01 September 2004
Article contents
- Abstract
- THE LEGACY OF INEQUALITY IN U.S. EDUCATION
- INEQUALITY AND SEGREGATION
- UNEQUAL ACCESS TO QUALIFIED TEACHERS
- ACCESS TO HIGH QUALITY CURRICULUM
- EDUCATIONAL OUTCOMES
- NEW STANDARDS AND OLD INEQUALITIES
- THE LEGAL BATTLE FOR EDUCATIONAL EQUITY
- POLICY FOR EQUALITY: TOWARD GENUINE SCHOOL REFORM
- References
Abstract
Despite the rhetoric of American equality, the school experiences of African American and other “minority” students in the United States continue to be substantially separate and unequal. Dramatically different learning opportunities—especially disparities in access to well-qualified teachers, high quality curriculum, and small schools and classes—are strongly related to differences in student achievement. Standards-based reforms have been launched throughout the United States with promises of greater equity, but, while students are held to common standards—and increasingly experience serious sanctions if they fail to achieve them—few states have equalized funding and access to the key educational resources needed for learning. The result of this collision of new standards with old inequities is less access to education for many students of color, rather than more. This article outlines current disparities in educational access, illustrates the relationships among race, educational resources, and student achievement, and proposes reforms needed to equalize opportunities to learn.
Information
- Type
- STATE OF THE DISCIPLINE
- Information
- Du Bois Review: Social Science Research on Race , Volume 1 , Issue 2 , September 2004 , pp. 213 - 246
- Copyright
- © 2004 W.E.B. Du Bois Institute for African and African American Research
Of all the civil rights for which the world has struggled and fought for 5000 years, the right to learn is undoubtedly the most fundamental—The freedom to learn—has been bought by bitter sacrifice. And whatever we may think of the curtailment of other civil rights, we should fight to the last ditch to keep open the right to learn, the right to have examined in our schools not only what we believe, but what we do not believe; not only what our leaders say, but what the leaders of other groups and nations, and the leaders of other centuries have said. We must insist upon this to give our children the fairness of a start which will equip them with such an array of facts and such an attitude toward truth that they can have a real chance to judge what the world is and what its greater minds have thought it might be.
W. E. B. Du Bois ([1949], 1970, pp. 230–231)
W. E. B. Du Bois argued strenuously over many decades for investment in the education of African American students. Moreover, he outlined the critical importance of investing in a kind of education that would provide much more than minimal skills—the kind of education that would enable students to think critically and take control of the course of their own learning. His prediction that the central issue of the twentieth century would be the problem of the color line follows us into the twenty-first, especially with regard to education. The color line divides us still. In recent years, one visible evidence of this in the public policy arena has been the persistent attack on affirmative action in higher education and employment. A mere fifty years after Brown v. Board of Education many Americans who believe the vestiges of discrimination have disappeared take the position that affirmative action now provides an unfair advantage to minorities. From the perspective of others who daily experience the consequences of ongoing discrimination, affirmative action is needed to protect opportunities likely to evaporate if an affirmative obligation to act fairly does not exist. And for Americans of all backgrounds, the allocation of opportunity in a society that is becoming ever more dependent on knowledge and education is a source of great anxiety and concern, exacerbating debates about who is entitled to high quality educational opportunities at every level of schooling.
Interpretations of the gaps in educational achievement between White and non-Asian minority students as measured by standardized test scores are at the center of these debates. The presumption that guides much of the conversation is that equal educational opportunity now exists; therefore, continued low levels of achievement on the part of minority students must be a function of genes, culture, or a lack of effort and will. (See, for example, Herrnstein and Murray's, The Bell Curve, and the Thernstroms', America in Black and White).
The assumptions that undergird this debate miss an important reality: educational outcomes for students of color are much more a function of their unequal access to key educational resources, including skilled teachers and quality curriculum, than they are a function of race. In fact, the United States educational system is one of the most unequal in the industrialized world, and students routinely receive dramatically different learning opportunities based on their social status. In contrast to European and Asian nations that fund schools centrally and equally, the wealthiest 10% of school districts in the United States spend nearly ten times more than the poorest 10%, and spending ratios of three to one are common within states (Educational Testing Services (ETS) 1991; Kozol 1991). These disparities reinforce the wide inequalities in income among families, with the most resources being spent on children from the wealthiest communities, and the fewest on the children of the poor, especially in high-minority communities.
Nonetheless, despite stark differences in funding, teacher quality, curriculum, support services, and class sizes, the prevailing view is that if students do not achieve, it is their own fault. Until these inequalities are confronted and addressed, we will never get beyond the problem of the color line.
THE LEGACY OF INEQUALITY IN U.S. EDUCATION
Institutionally sanctioned discrimination in access to educational resources is older than the American nation itself. In his history of eighteenth-century colonial education, Lawrence Cremin (1970) wrote:
For all of its openness, provincial America, like all societies, distributed its educational resources unevenly, and to some groups, particularly those Indians and Afro-Americans who were enslaved and even those who were not, it was for all intents and purposes closed. For the slaves, there were few books, few libraries, [and] few schools … the doors of wisdom were not only not open, they were shut tight and designed to remain that way…. [B]y the end of the colonial period, there was a well-developed ideology of race inferiority to justify that situation and ensure that it would stand firm against all the heady rhetoric of the Revolution (pp. 411–412).
Indeed, the legacy of discrimination did persist: “While [19th-century] publicists glorified the unifying influence of common learning under the common roof of the common school, black Americans were rarely part of that design” (Tyack 1974, p. 110). From the time southern states made it illegal to teach an enslaved person to read, throughout the nineteenth century and into the twentieth, African Americans faced de facto and de jure exclusion from public schools throughout the nation, as did Native Americans and, frequently, Mexican Americans (Tyack, pp. 109–125; Kluger 1976; Meier et al., 1989).
These disparities have lingered on. Jonathan Kozol's 1991 Savage Inequalities described the striking differences between public schools in urban settings—schools whose population is between 95 and 99% non-White (Kozol 1991, p. 3)—and their suburban counterparts. While Chicago public schools spent just over $5,000 per student in 1989, nearby Niles Township High School spent $9,371 per student. While central city Camden, New Jersey schools spent $3,500 that year, affluent suburban Princeton spent $7,725 per student. Schools in New York City spent $7,300 in 1990, while those in nearby suburbs like Manhasset and Great Neck spent over $15,000 per student for a population with many fewer special needs (Kozol 1991, pp. 236–237). These differences predict dramatic disparities in teachers, courses, curriculum materials, and equipment. For example, Kozol described Goudy Elementary School, which served a predominantly African American student population in Chicago, and used “15-year-old textbooks in which Richard Nixon is still president” and had “no science labs, no art or music teachers … [and] two working bathrooms for some 700 children,” while the neighboring town of New Trier (more than 98% White) provided its high school students with “superior labs … up-to-date technology … seven gyms [and] an Olympic pool” (pp. 63–65).
More recent analyses of data prepared for school finance cases in Alabama, California, Massachusetts, New Jersey, New York, Louisiana, South Carolina, and Texas have found that on every tangible measure—from qualified teachers and class sizes to textbooks, computers, facilities, and curriculum offerings—schools serving large numbers of students of color have significantly fewer resources than schools serving mostly White students. This description of one San Francisco school serving African American and Latino students is typical of others in the California complaint:
At Luther Burbank, students cannot take textbooks home for homework in any core subject because their teachers have enough textbooks for use in class only…. For homework, students must take home photocopied pages, with no accompanying text for guidance or reference, when and if their teachers have enough paper to use to make homework copies…. Luther Burbank is infested with vermin and roaches and students routinely see mice in their classrooms. One dead rodent has remained, decomposing, in a corner in the gymnasium since the beginning of the school year. The school library is rarely open, has no librarian, and has not recently been updated. The latest version of the encyclopedia in the library was published in approximately 1988. Luther Burbank classrooms do not have computers. Computer instruction and research skills are not, therefore, part of Luther Burbank students' regular instruction. The school no longer offers any art classes for budgetary reasons…. Two of the three bathrooms at Luther Burbank are locked all day, every day…. Students have urinated or defecated on themselves at school because they could not get into an unlocked bathroom…. When the bathrooms are not locked, they often lack toilet paper, soap, and paper towels, and the toilets frequently are clogged and overflowing … ceilings tiles are missing and cracked in the school gym, and school children are afraid to play basketball and other games in the gym because they worry that more ceiling tiles will fall on them during their games…. The school has no air conditioning. On hot days classroom temperatures climb into the 90s. The school heating system does not work well. In winter, children often wear coats, hats, and gloves during class to keep warm…. Eleven of the 35 teachers at Luther Burbank have not yet obtained regular, nonemergency teaching credentials, and 17 of the 35 teachers only began teaching at Luther Burbank this school year (Williams et al. v. State of California, Superior Court of the State of California, Complaint, filed June, 2000, pp. 22–23).
Such disparities in resources are largely a function of how public education in the United States is funded. In most cases, education costs are supported by a system of general taxes—primarily local property taxes, along with state grants-in-aid. Because these funds are typically raised and spent locally, districts with higher property values have greater resources with which to fund their schools, even when poorer districts tax themselves at proportionally higher rates. In Texas, for instance, the 100 wealthiest districts taxed their local property at an average rate of 47 cents per $100.00 of assessed worth in 1989; at that level of effort, they were able to spend over $7000 per student. Meanwhile, the 100 poorest districts, taxing themselves at a rate of over seventy cents per $100.00, were able to raise only enough to spend some $3000 per student (Kozol 1991, p. 225).
These disparities translate into real differences in the services provided in schools: higher spending districts have smaller classes, higher paid and more experienced teachers, and greater instructional resources, as well as better facilities, more up-to-date equipment, and a wider range of course offerings. Districts serving large proportions of poor children generally have the fewest resources. Thus, those students least likely to encounter a wide array of educational resources at home are also least likely to encounter them at school (ETS, 1991). As Taylor and Piche (1991) demonstrate:
Inequitable systems of school finance inflict disproportionate harm on minority and economically disadvantaged students. On an inter-state basis, such students are concentrated in states, primarily in the South, that have the lowest capacities to finance public education. On an intra-state basis, many of the states with the widest disparities in educational expenditures are large industrial states. In these states, many minorities and economically disadvantaged students are located in property-poor urban districts which fare the worst in educational expenditures. In addition, in several states economically disadvantaged students, White and Black, are concentrated in rural districts which suffer from fiscal inequity (pp. xi–xii).
Not only do funding systems and other policies create a situation in which urban districts receive fewer resources than their suburban neighbors, but schools with high concentrations of “minority” students also receive fewer resources than other schools within these districts. And tracking systems exacerbate these inequalities by segregating many “minority” students within schools, allocating still fewer educational opportunities to them at the classroom level. As I describe below, these compounded inequalities explain much of the achievement gap that many have attributed to everything from genetic differences in intelligence to childrearing to a “culture of poverty.”
Serious policy attention to these ongoing, systemic inequalities is critical for improving educational outcomes. If Americans do not recognize that students experience very different educational realities, policies will continue to be based on the presumption that it is the students, not their schools or classroom circumstances, that are the source of unequal educational attainment.
INEQUALITY AND SEGREGATION
Luther Burbank, like the schools described by Kozol, represents a growing number of “apartheid” schools that serve racial/ethnic minority students exclusively—schools with little political clout where resources are extraordinarily impoverished. In California, for example, many such schools are so severely overcrowded that they run a multi-track schedule offering a shortened school day and school year, lack basic textbooks and materials, do not offer the courses students need to be eligible for college, and are staffed by a parade of untrained, inexperienced, and temporary teachers (Oakes 2003). Such profound inequalities in resource allocations are supported by the increasing re-segregation of schools over the decades of the 1980s and 1990s. In 1998–1999, 70% of the nation's Black students attended predominantly minority schools, up significantly from the low point of 63% in 1980. The proportion of students of color in intensely segregated schools also increased. More than a third of African American and Latino students (36.5% and 36.6%, respectively) attended schools with a minority enrollment of 90%–100%. Furthermore, for all groups except Whites, racially segregated schools are almost always schools with high concentrations of poverty (Orfield 2001).
African American and Hispanic American students continue to be concentrated in central city public schools, many of which have become majority “minority” over the past decade while their funding has fallen further behind that of their suburbs. As of 1997, students of color comprised more than 55% of those served by school districts of more than 15,000 students (National Center for Education Statistics, 2000, p. 99). Due to federal and state disinvestment in city schools that has worsened since 1980, these central city schools are typically funded at levels substantially below those of neighboring suburban districts serving fewer students with special needs. The continuing segregation of neighborhoods and communities intersects with funding formulas and school administration practices that create substantial differences in the educational resources made available in different communities. Together, these conditions produce ongoing inequalities in educational opportunity by race and ethnicity.
UNEQUAL ACCESS TO QUALIFIED TEACHERS
In many cities, increasing numbers of unqualified teachers have been hired since the late 1980s, when teacher demand began to increase while resources were declining. In 1990, for example, the Los Angeles City School District was sued by students in predominantly minority schools because their schools were not only overcrowded and less well funded than other schools, but also disproportionately staffed by inexperienced and unprepared teachers hired on emergency credentials. Unequal assignment of teachers creates ongoing differentials in expenditures and access to educational resources, including curriculum offerings requiring specialized expertise and the knowledge well-prepared teachers rely on in offering high-quality instruction. (Rodriguez et al. v. Los Angeles Unified School District, Superior Court of the County of Los Angeles #C611358. Consent decree filed August 12, 1992).
The disparities in access to well-qualified teachers are large and growing worse. In 2001, for example, students in California's most segregated minority schools were more than five times as likely to have uncertified teachers as those in predominantly White schools (Shields et al., 2001). (See Figure 1.) Similar inequalities have been documented in lawsuits challenging school funding in Massachusetts, South Carolina, New York, and Texas, among other states. (See Figure 2, for example.) By every measure of qualifications—state certification, content background for teaching, pedagogical training, selectivity of college attended, test scores, or experience—less qualified teachers are found disproportionately in schools serving greater numbers of low-income or minority students (NCES 1997; Lankford et al., 2002).

Distribution of Unqualified Teachers in California, 2001

Distribution of Unqualified Teachers in Massachusetts, 2001
Oakes's (1990) nationwide study of the distribution of mathematics and science opportunities confirmed these pervasive patterns. Based on teacher experience, certification status, preparation in the discipline, degrees, self-confidence, and teacher and principal perceptions of competence, low-income and minority students had less contact with the best-qualified science and mathematics teachers. Students in high-minority schools had less than a 50% chance of being taught by a math or science teacher holding a degree and a license in the field they taught. Oakes concluded:
Our evidence lends considerable support to the argument that low-income, minority, and inner-city students have fewer opportunities…. They have considerably less access to science and mathematics knowledge at school, fewer material resources, less-engaging learning activities in their classrooms, and less-qualified teachers…. The differences we have observed are likely to reflect more general patterns of educational inequality (pp. x–xi).
These disparities are most troubling given recent evidence about the influence of teacher quality on student achievement. A number of studies have found that teachers who lack preparation in either subject matter or teaching methods are significantly less effective in producing student learning gains than those who have a full program of teacher education and who are fully certified (see, e.g. Goldhaber and Brewer, 2000). The size of the effect can be quite large. For example, a well-controlled study of middle school mathematics teachers, matched by years of experience and school setting, found that students of fully certified mathematics teachers experienced significantly larger gains in achievement than those taught by teachers not certified in mathematics. The differences in student gains were even greater for algebra classes than general mathematics, with students experiencing gains almost five times as large if they had the benefit of a fully certified teacher (Hawk, Coble, and Swanson, 1985). (See Figure 3.)

Effects on Student Achievement of Teacher Certification in Mathematics
In an analysis of 900 Texas school districts, Ronald Ferguson (1991) found that the single most important measurable cause of increased student learning was teacher expertise, measured by teacher performance on a state certification exam, along with teacher experience and master's degrees. Together these variables accounted for about 40% of the measured variance in student test scores. Holding socioeconomic status constant, the wide variation in teachers' qualifications in Texas accounted for almost all of the variation in Black and White students' test scores. That is, after controlling for socioeconomic status (SES), Black students' achievement would have been closely comparable to that of Whites if they had been assigned equally qualified teachers.
Ferguson also found that class size, at the critical point of a one to eighteen teacher/student ratio, was a statistically significant determinant of student outcomes (Ferguson 1991), as was small school size. Other data also indicate that Black students are more likely to attend large schools than White students (Paterson Institute 1996) with much larger than average class sizes (NCES, 1997, p. A-119), and confirm that smaller schools and classes make a difference for student achievement (for a review, see Darling-Hammond 1997).
Ferguson and Helen Ladd repeated this analysis in Alabama, and again found sizable influences of teacher expertise and smaller class sizes on student achievement gains in reading and mathematics (Ferguson and Ladd, 1996). The researchers found that 31% of the predicted difference in mathematics achievement between districts in the top and bottom quartiles was explained by teacher qualifications and class sizes, while 29.5% was explained by poverty, race, and parent education.
These findings are confirmed by other studies (for a recent review, see Darling-Hammond 2000). Recent studies in California and Texas have pointed to significant relationships between measures of teacher qualifications and student achievement on required state tests, after controlling for student characteristics like poverty. Among school resources, the proportion of teachers who are fully certified (or, conversely, on emergency permits) has been found to be the most important predictor of school-level student achievement in mathematics and reading, along with teacher experience (Betts et al., 2000; Fetler 1999; Fuller 1998; Fuller 2000; Goe 2002).
Whether students have access to well-qualified teachers can be a critical determinant of whether they can be successful on the state tests often required for promotion from grade to grade, for placement into more academically challenging classes, and for graduation from high school. Strauss and Sawyer (1986) found that North Carolina's teachers' average scores on the National Teacher Examinations (NTE) (a licensing test measuring basic skills and teaching knowledge) had a strikingly large effect on students' failure rates on the state competency examinations: a 1% increase in teacher quality (as measured by NTE scores) was associated with a 3% to 5% decline in the percentage of students failing the exam. This influence remained after taking into account per-capita income, student race, district capital assets, student plans to attend college, and pupil/teacher ratios. The authors' conclusion was similar to Ferguson's:
Of the inputs which are potentially policy-controllable (teacher quality, teacher numbers via the pupil-teacher ratio and capital stock), our analysis indicates quite clearly that improving the quality of teachers in the classroom will do more for students who are most educationally at risk, those prone to fail, than reducing the class size or improving the capital stock by any reasonable margin which would be available to policy makers (p. 47).
Unequal access to well-qualified teachers, a major side effect of unequal expenditures, appears to be one of the most critical factors in the underachievement of African American and Latino/a students. In some districts, like Compton and Ravenswood, California, which serve exclusively students of color, the proportions of uncertified teachers have exceeded 50 percent, leaving most students without any access to teachers who know how to teach them to read, who have learned about up-to-date teaching methods or about how children grow, learn, and develop, and who have a repertoire of teaching skills to use if they are having difficulties (Futernick 2001).
Furthermore, recruits who are not prepared for teaching are much more likely to leave teaching quickly (Henke et al., 2000; National Commission on Teaching and America's Future, 2003), many staying only a year or less. This adds additional problems of staff instability to the already difficult circumstances in which central city youth attend school. Where these hiring practices dominate, many children are taught by a parade of short-term substitute teachers, inexperienced teachers without support, and underqualified teachers who know neither their subject matter nor effective teaching methods well.
In addition, when faced with shortages, districts often assign teachers outside their fields of qualification, expand class sizes, or cancel course offerings. These strategies are used most frequently in schools serving large numbers of minority students (NCES 1997; NCTAF 1997). No matter what strategies are adopted, the quality of instruction suffers. This sets up the school failure that society predicts for low-income and minority children—a failure created by lack of effective measures to deal with the issues of teacher supply and quality.
ACCESS TO HIGH QUALITY CURRICULUM
In addition to being taught by less qualified teachers than their White counterparts, students of color face dramatic differences in courses, curriculum materials, and equipment. Unequal access to high-level courses and challenging curriculum explains another substantial component of the difference in achievement between minority students and White students. Analyses of data from the “High School and Beyond” surveys demonstrate dramatic differences among students of various racial and ethnic groups in course taking in such areas as mathematics, science, and foreign languages (Pelavin and Kane, 1990). These data also demonstrate that, for students of all racial and ethnic groups, course taking is strongly related to achievement for students with similar course taking records, achievement test score differences by race or ethnicity narrow substantially (College Board 1985, p. 38; Jones 1984; Jones et al., 1984; Moore and Smith, 1985). While it is reasonable to question whether correlational data can disentangle the effects of prior achievement and course taking on later performance, there are also studies that have used random assignment of students to different educational experiences which have found achievement gaps narrowed by access to more challenging curriculum. For example, a study that randomly assigned seventh grade “at-risk” students to remedial, average, and honors mathematics classes found that at the end of the year, the at-risk students who took the honors class offering a pre-algebra curriculum outperformed all other students of similar backgrounds (Peterson 1989).
On a larger scale, a study of African American high school youth randomly placed in public housing in the Chicago suburbs rather than in the city found similar results. Compared to their comparable city-placed peers, who were of equivalent income and initial academic attainment, the students who were enabled to attend largely White and better-funded suburban schools with access to more challenging curriculum and more qualified teachers had better educational outcomes across many dimensions: they were substantially more likely to have the opportunity to take challenging courses, receive additional academic help, graduate on time, attend college, and secure good jobs (Kaufman and Rosenbaum, 1992).
A number of studies have documented how instructional disparities influence learning and achievement for students of color. For example, when Dreeben (1987) studied reading instruction and outcomes for 300 Black and White first graders across seven schools in the Chicago area, he found that differences in reading outcomes among students were almost entirely explained, not by socioeconomic status or race, but by the quality of instruction the students received:
Our evidence shows that the level of learning responds strongly to the quality of instruction: having and using enough time, covering a substantial amount of rich curricular material, and matching instruction appropriately to the ability levels of groups…. When Black and White children of comparable ability experience the same instruction, they do about equally well, and this is true when the instruction is excellent in quality and when it is inadequate (p. 34).
However, the study also found that the quality of instruction received by African American students was, on average, much lower than that received by White students, thus creating a racial gap in aggregate achievement at the end of first grade. In fact, the highest ability group in Dreeben's sample at the start of the study was in a school in a low-income African American neighborhood. These students, though, learned less during first grade than their White counterparts because their teacher was unable to provide the quality instruction this talented group deserved.
Curricular differences like these are widespread, and they explain much of the disparity between the achievement of White and minority students and between those of higher and lower-income levels (Barr and Dreeben, 1983; College Board 1985; Dreeben and Gamoran, 1986; Dreeben and Barr, 1987; Lee and Bryk, 1988; Oakes 1985, 1990). When students of similar backgrounds and initial achievement levels are exposed to more and less challenging curriculum material, those given the richer curriculum opportunities outperform those placed in less challenging classes (Alexander and McDill, 1976; Oakes 1985; Gamoran and Berends, 1987).
One source of inequality is the fact that high-minority schools are much less likely to offer advanced and college preparatory courses in mathematics and science than are schools that serve affluent and largely White populations of students (Matthews 1984; Oakes 1990). Schools serving predominantly minority and poor populations offer fewer advanced and more remedial courses in academic subjects, and they have smaller academic tracks and larger vocational programs (NCES 1985; Oakes 2003; Rock et al., 1985). As plaintiffs noted in the New Jersey school finance case, wealthy and predominantly White Montclair offers foreign languages at the preschool level while poor and predominantly Black Paterson does not offer any until high school—and then, relatively few. And while 20% of eleventh and twelfth graders in wealthy Moorestown participate in Advanced Placement courses, none is even offered in any school in poor and predominantly Black Camden and East Orange (ETS 1991, p. 9).
When high-minority, low-income schools offer any advanced or college preparatory courses, they offer them to only a very tiny fraction of students. Thus, at the high school level, African Americans, Hispanics, and American Indians have traditionally been underrepresented in academic programs and overrepresented in general education or vocational education programs, where they receive fewer courses in areas such as English, mathematics, and science (Oakes 1990). Even among the college bound, non-Asian minority students take fewer and less demanding mathematics, science, and foreign language courses (Pelavin and Kane, 1990).
The unavailability of teachers who could teach these upper level courses, or who can successfully teach heterogeneous groups of students, reinforces these inequalities in access to high quality curriculum. Tracking persists in the face of growing evidence that it does not substantially benefit high achievers and tends to put low achievers at a serious disadvantage (Oakes 1985, 1986; Hoffer 1992; Kulik and Kulik, 1982; Slavin 1990), in part because good teaching is a scarce resource, and thus must be allocated. Scarce resources tend to get allocated to the students whose parents, advocates, or representatives have the most political clout. This typically results in the most highly qualified teachers teaching the most enriched curricula to the most advantaged students. Evidence suggests that teachers themselves are tracked, with those judged to be the most competent, experienced, or with the highest status assigned to the top tracks (Oakes 1986; Davis 1986; Finley 1984; Rosenbaum 1976; Talbert 1990; NCTAF 1996).
Tracking exacerbates differential access to knowledge. Although test scores and prior educational opportunities may provide one reason for differential placements, race and socioeconomic status play a distinct role. Even after test scores are controlled, race and socioeconomic status determine assignments to high school honors courses (Gamoran 1992), as well as vocational and academic programs and more or less challenging courses within them (Oakes 1992; Useem 1990). Oakes's research in San Jose, California (1993) demonstrates vividly how students with the same standardized test scores are tracked “up” and “down” at dramatically different rates by race. Latino/a students, for example, who score near the 60th percentile on standardized tests are less than half as likely as White and Asian students to be placed in college preparatory classes. Even those Latino/a students who score above the 90th percentile on such tests have only about a 50% chance of being placed in a college preparatory class, while White and Asian students with similar scores have more than a 90% chance of such placements. (See Figure 4.)

Likelihood of Placement in a College Preparatory Course, Controlling for Standardized Test Scores (9th grade)
These patterns are in part a function of prior placements of students in “gifted and talented” programs vs. remedial tracks in earlier grades (also associated with race within equivalent test score groups), in part due to counselors' views that they should advise students in ways that are “realistic” about their futures, and in part because of the greater effectiveness of parent interventions in tracking decisions for higher-SES students (Moore and Davenport, 1988).
Tracking in U.S. schools starts much earlier and is much more extensive than in most other countries where sorting does not occur until high school. Starting in elementary schools with the designation of instructional groups and programs based on test scores and recommendations, it becomes highly formalized by junior high school. From “gifted and talented” programs at the elementary level through advanced courses in secondary schools, teachers who are generally the most skilled offer rich, challenging curricula to select groups of students, on the theory that only a few students can benefit from such curricula. Yet the distinguishing feature of such programs, particularly at the elementary level, is not their difficulty, but their quality. Students in these programs are given opportunities to integrate ideas across fields of study. They have opportunities to think, write, create, and develop projects. They are challenged to explore. Though virtually all students would benefit from being taught in this way, their opportunities remain acutely restricted. The result of this practice is that challenging curricula are rationed to a very small proportion of students, and far fewer U.S. students ever encounter the kinds of curriculum students in other countries typically experience (McKnight et al., 1987; Usiskin 1987; Useem 1990; Wheelock 1992).
In many instances, the reasons for restricting access to challenging courses is the scarcity of teachers who can teach in the fashion such curricula demand. In addition, schools continue to believe that few students need or will profit from such demanding instruction. Those beliefs are especially strong with respect to students of color. The disproportionately small enrollment of non-Asian minority students in gifted and talented programs is widespread. Meanwhile, students placed in lower tracks are exposed to a limited, rote-oriented curriculum and ultimately achieve less than students of similar aptitude who are placed in academic programs or untracked classes (Gamoran and Mare, 1989; Gamoran 1990; Oakes 1985, 1990). Teacher interaction with students in lower track classes is less motivating and less supportive, as well as less demanding of higher order reasoning and responses (Good and Brophy, 1987). These interactions are also less academically oriented, and more likely to focus on behavioral criticisms, especially for minority students (Eckstrom and Villegas, 1991; Oakes 1985).
In addition, many studies have found that students placed in the lowest tracks or in remedial programs are most apt to experience instruction geared only to rote skills, working at a low cognitive level on test-oriented tasks that are profoundly disconnected from the skills they need to learn. Rarely are they given the opportunity to talk about what they know, to read real books, to research and write, to construct and solve problems in mathematics, science, or other subjects (Cooper and Sherk, 1989; Davis 1986; Oakes 1985; Trimble and Sinclair, 1986). Yet, these are the practices essential to the development of higher order thinking skills and to sustained academic achievement. The most effective teachers provide active learning opportunities involving student collaboration and many uses of oral and written language, help students access prior knowledge which will frame for them the material to be learned, structure learning tasks so that students have a basis for interpreting the new experiences they encounter, provide hands-on learning opportunities, and engage students' higher order thought processes, including their capacities to hypothesize, predict, evaluate, integrate, and synthesize ideas (Bowman 1993; Braddock and McPartland, 1993; Garcia 1993; Resnick 1987; Wenglinsky 2002).
EDUCATIONAL OUTCOMES
Twentieth-century statistics reveal the long-term effects of these longstanding differences in access to key educational resources as well as the narrowing of the gap that has occurred when investments have periodically been made in greater equality, especially during the 1960s and 1970s. During the years following Brown v. Board of Education when desegregation and early efforts at school finance reform were launched, and when the Great Society's War on Poverty increased investments in urban and poor rural schools, substantial gains were made in equalizing both educational inputs and outcomes. Gaps in school spending, access to qualified teachers, and access to higher education were smaller in the mid- to late 1970s than they had been before and, in many states, than they have been since. These trends may be related to the growth in childhood poverty rates since 1980 as well as the fact that most targeted federal programs supporting investments in urban and poor rural schools were reduced or eliminated in the 1980s. Gaps in achievement began to widen again after the mid-1980s and have, in many areas, continued to grow in the decades since.
On national assessments in reading, writing, mathematics, and science, Black students' performance continues to lag behind that of White students, with uneven progress in closing the gap. In reading, (see Figure 4) large gains in Black students' performance throughout the 1970s and 1980s have reversed since 1988, with scores registering declines for thirteen and seventeen year olds since then. In 2000, the average Black seventeen year old read at the level of the average White thirteen year old. Scores in writing have also declined for eighth grade and eleventh grade Black students since 1988. Although there have been slight improvements in mathematics and science for nine and thirteen year olds, the achievement gap has stayed constant or widened since 1990 (NCES 2002). The lack of progress in student achievement during the 1990s is not entirely surprising, as the situation in many urban schools deteriorated over the decade. Drops in real per pupil expenditures accompanied tax cuts and growing enrollments. Meanwhile needs grew with immigration, growing poverty and homelessness, and increased numbers of students requiring second language instruction and special educational services.
The continuing segregation of neighborhoods and communities intersects with funding formulas and school administration practices that create substantial differences in the educational resources made available in different communities. Together, these conditions produce ongoing inequalities in educational opportunity by race and ethnicity.
Progress in educational attainment, which was substantial after 1950, has also slowed and begun to reverse. In 1940 only 7% of African Americans over twenty-five had graduated from high school, as compared to 24% of Americans generally (U.S. Bureau of the Census 1992). By 1998, 87% of White American adults had completed twelve or more years of school, compared to 76% of African Americans and 56% of Hispanics (NCES 2000, p. 17). While overall educational attainment for people of color in the United States increased between 1960 and 1990, this trend has begun to reverse as more states have imposed graduation exams, and resources to city schools have continued to decline since the early 1980s. By 1998, 88% of African Americans and 63% of Hispanics between the ages of twenty-five and twenty-nine had completed high school with a diploma or an equivalency (NCES 2000, p. 17), beginning to close the gap with White Americans. However, dropout rates for sixteen to twenty four-year-old Black male students, which declined steadily between 1975–1990, have been increasing since 1990, growing from 11.9% in 1990 to 15.5% in 1998 (NCES 2000, p. 127), while dropout rates for Hispanic males in this age group have remained above 30%. As I describe below, these trends are in part associated with high-stakes testing policies adopted by a number of states starting in the late 1980s and early 1990s.
With a more educationally demanding economy, the effects of dropping out are more negative than they have ever before been, and are much worse for African American young people than for Whites. In 1996, a recent school dropout who was Black had only a one in five chance of being employed, whereas the odds for his White counterpart were about 50% (NCES 1998, p. 100). Even recent high school graduates struggle to find jobs. Among African American high school graduates not enrolled in college, only 42% were employed in 1996, as compared to 69% of White graduates (NCES 1998, p. 100). Those who do not succeed in school are becoming part of a growing underclass, cut off from productive engagement in society.
Because the economy can no longer absorb many unskilled workers at decent wages, lack of education is increasingly linked to crime and welfare dependency. Women who have not finished high school are much more likely than others to be on welfare, while men are much more likely to be in prison. National investments in the last decade have tipped heavily toward incarceration rather education. Nationwide, during the 1980s, federal, state, and local expenditures for corrections grew by over 900%, and for prosecution and legal services by over 1000% (Miller 1997) while prison populations more than doubled (U.S. Bureau of the Census 1996, p. 219). During the same decade, per pupil expenditures for schools grew by only about 26% in real dollar terms, and much less in cities (NCES 1994).
In 1993, there were more African American citizens on probation, in jail, in prison, or on parole (1,985,000) than there were in college (1,412,000) (U.S. Bureau of the Census 1996, table numbers 281 and 354, pp. 181 and 221). Increased incarceration, and its disproportionate effects upon the African American community are a function of new criminal justice policies and ongoing police discrimination (see, e.g. Miller 1997) as well as lack of access to education that could lead to literacy, needed skills, and employment. More than half the adult prison population has literacy skills below those required by the labor market (Barton and Coley, 1996), and nearly 40% of adjudicated juvenile delinquents have learning disabilities that went undiagnosed and untreated in the schools (Gemignani 1994).
In short, the failure of many states to invest adequately in the education of children in central cities, to provide them with qualified teachers and the necessary curriculum and learning materials, results in many dropping out without the skills needed to become a part of the economy.
NEW STANDARDS AND OLD INEQUALITIES
While these inequalities in educational opportunity continue—and have actually grown worse in many states over the last two decades—the increasing importance of education to individual and societal well-being has spawned an education reform movement in the United States focused on the development of new standards for students. Virtually all states have created new standards for graduation, new curriculum frameworks to guide instruction, and new assessments to test students' knowledge. Many have put in place high-stakes testing systems that attach rewards and sanctions to students' scores on standardized tests. These include grade retention or promotion as well as graduation for students, merit pay awards, or threats of dismissal for teachers and administrators, and extra funds or loss of accreditation, reconstitution, or loss of funds for schools. The recently enacted federal No Child Left Behind Act reinforces these systems, requiring all schools receiving funding to test students annually, and enforcing penalties for those that do not meet specific test score targets both for students as a whole and for subgroups defined by race/ethnicity, language, socioeconomic status, and disability.
The rhetoric of “standards-based” reforms is appealing. Students cannot succeed in meeting the demands of the new economy if they do not encounter much more challenging work in school, many argue, and schools cannot be stimulated to improve unless the real accomplishments—or deficits—of their students are raised to public attention. These arguments certainly have some merit. But standards and tests alone will not improve schools or create educational opportunities where they do not now exist. The implications of standards-based reform for students who have not received an adequate education are suggested by long-standing data from Texas where more than a decade of high-stakes testing has contributed to four-year graduation rates for African American and Hispanic students that hover near 50% (Haney 2000), as well as more recent data from Massachusetts, which began to implement high-stakes testing in the late 1990s. As Massachusetts's accountability system was phased in, there was a 300% increase in middle school dropouts between 1997–1998 and 1999–2000 while greater proportions of students began disappearing from schools in ninth and tenth grades, most of them African American and Latino/a. (See Figure 5.) Furthermore, fewer dropouts have returned to school. In 1995–1996, when funding for dropout prevention was available, and before The Massachusetts Comprehensive Assessment System (MCAS) became a graduation requirement, 20.3% of 8177 dropouts from grades nine through twelve returned to school; by 2002–2003, only 12.0% of the reported 9389 dropouts from grades nine through twelve returned to school (Massachusetts Department of Education 2004).

Percentage of 9th Grade MA Students “Lost” Between 9th and 10th Grades
When the state's exit exam was first enforced in 2003, graduation rates for the group of ninth graders who had entered high school four years earlier decreased for all students, but most sharply for students of color. While state data showed a graduation rate of 71% for African American students in the class of 2002, among those who began ninth grade with the class of 2003, there were only 59.5% in line to graduate that year (the number still in school and having passed the exams in the spring of 2003). Graduation eligibility for Latino/a students who had begun ninth grade with this class went from 54% in 2002 to 45% in 2003.1
Numbers of students enrolled in Grade 9 are reported in the Massachusetts Department of Education annual “October 1 reports.” Numbers of graduates for Classes 1994–2002 were provided to Anne Wheelock, who tabulated these data, by the Massachusetts Department of Education in a table entitled, “High School Graduation Rates by Race: 1992–2002.” Numbers of graduates for 2003 had not yet been published as of this writing. Numbers of students in position to graduate were those who passed the MCAS in both English language arts and math and have thus received “competency determination” as reported in the Massachusetts Department of Education's report, “Progress Report on Students Attaining the Competency Determination Statewide and by District,” February 2004, at http://www.doe.mass.edu/mcas/2003/results/0204cdprogrpt.pdf.
These patterns raise the possibility that pressures to increase school average test scores may create incentives to hold students back or encourage them to leave school. Recent studies have found that systems that reward or sanction schools based on average student scores create incentives for pushing low-scorers into special education so that their scores will not count in school reports (Allington and McGill-Franzen, 1992; Figlio and Getzler, 2002), retaining students in grade so that their grade-level scores will look better (Jacob 2002; Haney 2000)—a practice that increases later dropout rates, excluding low-scoring students from admissions (Darling-Hammond 1991; Smith et al., 1986), and encouraging such students to leave schools or drop out (Haney 2000; Orfield and Ashkinaze, 1991; Smith et al., 1986). Studies have linked dropout rates in Georgia, Florida, Massachusetts, New York, and North Carolina to the effects of grade retention, student discouragement, and school exclusion policies stimulated by high stakes tests. Data from the National Center for Education Statistics indicate that four-year graduation rates2
Graduation rates are calculated as the number of students in a graduating class divided by the number of students in ninth grade 3½ years earlier.

State Graduation Rates, 1995–2001
Reform rhetoric notwithstanding, the key question for students, especially those of color, is whether investments in better teaching, curriculum, and schooling will follow the press for new standards, or whether standards built upon a foundation of continued inequality in education will simply certify student failure with greater certainty and reduce access to future education and employment. A related question, a half-century after Brown v. Board of Education, is what it will take to secure a constitutional right to equal educational opportunity for all children in the United States.
The advent of high-stakes testing reforms requiring students to achieve specific test score targets in order to advance in grade or graduate from school has occurred while educational experiences for “minority” students continue to be substantially separate and unequal. State efforts to set standards for all students for school progression and graduation while failing to offer equal opportunities to learn have stimulated a new spate of equity litigation in nearly twenty states across the country. These lawsuits—which may be said to constitute the next generation of efforts begun by Brown v. Board of Education—argue that if states require all students to meet the same educational standards, they must assume a responsibility to provide resources adequate to allow students a reasonable opportunity to achieve those standards, including well-qualified teachers, a curriculum that fully reflects the standards, and the materials, texts, supplies, and equipment needed to teach the curriculum. Though this would seem like an obvious proposition, in most states the suits have been defended by legal arguments that money “does not make a difference” in educational outcomes.
THE LEGAL BATTLE FOR EDUCATIONAL EQUITY
The relationship between educational funding and educational achievement was placed in question in 1966, when James Coleman and a team of researchers issued Equality of Educational Opportunity, which later came to be known as the “Coleman Report.” Although the report pointed out sources of inequality that it argued should be remedied, its statement that “[s]chools bring little influence to bear on a child's achievement that is independent of his background and general social context” (cited in Ferguson 1991, p. 468) became widely viewed as a claim that school funding does not affect school achievement. As later analyses pointed out, the strong correlation between students' backgrounds and their schools' resources complicates efforts in macro-analytic studies to identify an independent effect of schooling on achievement (see e.g. MacPhail-Wilcox and King, 1986), as the collinear relationships between race, socioeconomic status, and school resource levels are difficult to disentangle.
These debates about whether resources make a difference for the schooling of low-income and minority students have been reprised in recent school finance cases. In Williams v. California, for example, expert witnesses for the defendants argued that, despite large differences in access to qualified teachers, textbooks, and course offerings, such resources are largely unrelated to student achievement, and that the effects of poverty—not unequal resources—drive disparities in achievement. In a sweeping indictment of educational investments over the last half century, Eric Hanushek (2003) claimed that “there is no evidence that the added resources have improved student performance, at least for the most recent three decades” (p. 4), ignoring the expansion of populations of students served and large gains in educational attainment as well as studies that have found that additional resources have in fact improved student performance (e.g. Ferguson, 1991; Greenwald et al., 1996; Grissmer et al., 2000; Krueger 2000).
In this case and others, Hanushek's finding of “no effect” of resources on achievement has been based on methodological strategies that have been criticized for counting negative findings from the same studies multiple times and ignoring positive findings about the influences of resources on learning (Krueger 2000; Hedges et al., 1994). While Hanushek claimed in the Williams case that, “there is little systematic relationship between specific resources … of the kind highlighted by Plaintiffs … and student performance,” (p. 10), the analyses he cited did not include measures of teachers' actual preparation for teaching in terms of content and pedagogical knowledge, nor did they include the textbooks and other instructional materials to which students have access, or the nature of the curriculum they experience.
As noted above, however, recent studies have provided evidence that money does make a difference, especially for students of color and especially when it is used to purchase the key resources of well-qualified staff and the curriculum they can offer. Earlier, I noted a number of published studies that have found that teacher certification status and experience are significant predictors of student achievement in California schools, both before and after controlling for student socioeconomic status. New analyses of data in the South Carolina and Massachusetts lawsuits (see Tables 1, 2, and 3) demonstrate how the sizable effects of school resources can be demonstrated both in relation to race and income and independently from these factors.
South Carolina: Relationship among student achievement, race, and district resources Dependent variable: % of students scoring “below basic” on state tests

Massachusetts: Relationships among student achievement, race, and school resources Percent of students failing MCAS English language arts test, all grades

Massachusetts: Relationships among student achievement, race, and school resources Percent of students failing MCAS math test, all grades

In both of these states, plaintiff school districts—which are more heavily minority and low-income than the state as a whole—have lower levels of overall resources, lower teachers' salaries, and lower levels of teacher and other educators' qualifications than other districts as well as lower student performance. Both states have accountability systems based on the results of high-stakes testing, sanctioning students, teachers, and schools for low test scores with penalties like grade retention, denial of diplomas, state labeling of low-performing schools, and threats of intervention or reconstitution. The issue contended by defendants and plaintiffs is whether these disparities in achievement are related to students' meaningful opportunities to learn, and whether the state has an obligation to ensure that students have access to the resources that could enable them to meet the standards the state has set for progression in school and as a passport to employment and college.
These analyses look first at the effects of race and poverty on student achievement, then at the effects of key school resources, and then at the combined influences of student and school factors. In both states, the data were collected at the school district level, as districts are the plaintiffs in the lawsuits and are the units of analysis for allocations of state and local resources. Data in these cases and in other studies suggest that school resources like skillful teachers and small class sizes have the greatest effect on student performance for low-income and minority students and for other historically lower achieving students. Thus, we focus in these analyses on the effects of resources on the proportion of students meeting the minimum test score standards in the respective states. In South Carolina, the dependent variable is the proportion of students scoring “below basic” on the state tests—the benchmark determining whether students will be retained in their grade level, and ultimately graduated from high school, and the criterion for state school-level accountability determinations. In Massachusetts, the dependent variable is the proportion of students in a district receiving a “failing” score on the MCAS tests in English language arts and in mathematics.
In both cases, data on student achievement as well as on student characteristics and staff qualifications come from state data bases. Because the states keep different kinds of data, the independent variables differ. South Carolina maintains data that can be matched to districts on a wider range of teacher qualifications and labor market variables than Massachusetts, including selectivity of college attended, advanced degrees, out-of-state hires, and difficult-to-fill vacancies. Massachusetts published data on the qualifications of more categories of educators (e.g. administrators, teachers, and paraprofessionals) than did South Carolina at the time of the study. In both cases, however, we are able to examine the influences of teacher qualifications, teacher salaries, and student-teacher ratios (a rough proxy for class sizes) on student performance.
The results demonstrate several things that are markedly similar in both states (and that reflect findings from analyses in other states, including California and New York).
First, when considered alone, student poverty levels and minority status predict a large share of the variation across districts in the proportions of students not meeting minimum standards on the state tests, with poverty levels exerting an even stronger influence than minority status.3
In South Carolina, African American students are the overwhelming majority of students of color, so this variable is used. In Massachusetts, there are also relatively large proportions of Hispanic and Asian American students, who are included, along with Native American students, in the “minority” student category. In Massachusetts, we also included the proportion of students whose first language is not English, as there are a substantial number of non-native English speakers in some districts.
Second, these ostensible effects of student characteristics are not solely a function of the knowledge and skills students bring to school or the conditions in which they live. School resources, as we have already described, co-vary significantly with pupil characteristics. When we estimate the effects on student achievement of school resources alone (without including student characteristics), these also account for a very large proportion of the variance in student performance—well over half the explained variance. This is true despite the fact that the state data sets do not provide measures of many of the resources that might be expected to matter, such as course offerings and other measures of curriculum rigor, availability of materials and equipment, and support services, which also co-vary with student characteristics. The school resources we were able to include accounted for 65% of the total variance in students scoring “below basic” on the state tests in South Carolina and from 46% to 56% of the variance in students failing the MCAS in English and mathematics in Massachusetts, noticeably more than the influence of race.4
It is worth noting that the school resource data available in Massachusetts were much sparser than those available in South Carolina. It would be useful to evaluate whether even greater predictive power might be achieved with a more complete data set.
Third, as in many other studies, among school resources, measures of teacher qualifications are the strongest predictors of student achievement. In South Carolina, measures of teacher qualifications alone account for 64% of the total variance in student outcomes. Adding measures of teacher salaries, pupil teacher ratios, and classroom facilities increases the R2 only slightly, to 65%. The strongest predictors are teacher certification status—especially the proportion of teachers without any training or certification (in contrast to those with training, but teaching out of field)5
Teachers on substandard certificates include all of those in a variety of certification categories who lack a full standard certificate noting that they have the requisite subject matter background and teacher training. This variable has a strong positive correlation with students scoring below basic on the state tests. Teachers who are certified but teaching at least part of the time on an “out-of-field” permit are a subset of those on substandard certificates. These are the more qualified individuals in the substandard credential pool, as they have met teacher preparation requirements in one field, but not in every field that they teach. The negative coefficient on this variable means that fewer students score poorly in districts where a greater share of the substandard credentials are represented by this class of permits granted to already certified teachers.
In Massachusetts such fine-grained teacher quality variables are not collected. However, the certification status of both teachers and administrators, as well as a measure of the qualifications of paraprofessionals, are all significantly related to the proportions of students failing the MCAS tests in both English and mathematics, accounting for 39% of the total variance in failing scores on the English tests and 50% of the variance on the math tests. In mathematics, in addition to a measure of the overall proportion of teachers teaching either without any license or without a license in their field, we also had a measure of the proportion of high school teachers teaching mathematics or computer science who were not certified in these fields, which added to the predictive power of the estimates. Given that other dimensions of staff quality are not directly measured in the Massachusetts estimates, it is not surprising that an added measure of average teacher salary—which should capture other aspects of quality—is also significant. This measure, along with a measure of overall school spending6
The measure of school spending is at least partially adjusted for pupil needs by comparing the net school spending of each district to the foundation budget calculated by the state for each district, based on students in poverty and with special educational needs.
Finally, when we estimate district-level student performance using both student characteristics and these school resource measures, we see that, while poverty levels of students continue to exert a strong influence on student outcomes, race and language status are no longer significant predictors of performance. School resources matter strongly. In South Carolina, the combined effects of school resource variables account for as much of the variance as do measures of race and poverty, and teacher certification status continues to exert a strongly significant influence on student achievement. Together these factors explain 84% of the variance in student achievement. In Massachusetts, where we have less school resource information available to disentangle the effects of student status from unequally distributed school resources, school resources nonetheless continue to account for a large share (about 40%) of the total variance explained. (The overall R2 is a substantial 0.73 in English and 0.82 in math.) On the English tests, the strongest predictors are average teacher salary, which captures much of the measured and unmeasured variation in teacher quality, the proportion of teachers unlicensed in the field they teach, and overall school spending. In math, when student characteristics are controlled, the effects of the teacher qualifications' measures are substantially absorbed by the spending measures. Although the proportion of fully certified high school math teachers still exerts a strong effect, the statistically significant predictors are overall school spending, average teacher salaries, and the proportion of paraprofessionals not highly qualified.
These analyses, like previous studies (Betts et al., 2000; Ferguson 1991; Goe 2002; Strauss and Sawyer, 1986) make it clear that school resources matter, that key resources co-vary with the characteristics of students in public schools, and that more equitable allocations of school resources could substantially reduce the failure rates of students of color and low-income students on the high-stakes measures states have chosen to hold students and schools accountable for their performance. The issue is whether governments can be held accountable for their own performance in ensuring that all students have the conditions and resources necessary to support their right to learn.
POLICY FOR EQUALITY: TOWARD GENUINE SCHOOL REFORM
The common presumption about educational inequality is that it resides primarily in those students who come to school with inadequate capacities to benefit from what education the school has to offer. The fact that U.S. schools are structured such that students routinely receive dramatically unequal learning opportunities based on their race and social status is simply not widely recognized. If the academic outcomes for minority and low-income children are to change, reforms must alter the quality and quantity of learning opportunities they encounter. A school reform that could improve the achievement of students of color would assure students access to high quality teaching within the context of a rich and challenging curriculum supported by personalized schools and classes. Accomplishing such a goal would require equalization of financial resources, changes in curriculum and testing policies, and improvements in the supply of highly qualified teachers to all students.
Resource Equalization
Progress in equalizing resources to students will require attention to inequalities at all levels—between states, among districts, among schools within districts, and among students differentially placed in classrooms, courses, and tracks that offer substantially disparate opportunities to learn. As a consequence of systematic inequalities at each of these levels, minority and low-income students are frequently “at risk” from the major shortcomings of the schools they attend.
Special programs such as compensatory or bilingual education will never be effective at remedying underachievement as long as these services are layered on a system that poorly educates children from the start. The presumption that “the schools are fine, it's the children who need help” is flawed. The schools serving large concentrations of low-income and minority students are generally not fine, and many of their problems originate with district and state policies and practices that fund such schools inadequately, send them incompetent staff, require inordinate attention to arcane administrative requirements that fragment educational programs, drain resources from classrooms, and preclude the adoption of more promising curriculum and teaching strategies.
Current initiatives to create special labels and programs for “at-risk” children and youth—including mass summer school programs and mandatory Saturday classes for the hundreds of thousands of students who are threatened with grade retention under new promotion rules—are unlikely to succeed if they do not attend to the structural conditions of schools that place children at risk in the first place. In the pursuit of equity, useful strategies will improve the core practices of schooling rather than layering additional poorly constructed programs on foundations that are already faulty. The pressures to respond to special circumstances with special categorical programs are great, and the tradition of succumbing to those pressures in an add-on fashion is well established. But add-on programs, with all their accoutrements of new rules and procedures, separate budgets, and fragmented, pull-out programs will be counterproductive as long as the status quo remains unchanged in more significant ways.
As the 1992 interim report of an independent commission on Chapter 1 observed: “Given the inequitable distribution of state and local resources, the current notion that Chapter 1 provides supplemental aid to disadvantaged children added to a level playing field is a fiction” (Commission on Chapter 1, 1992, p. 4). The Commission proposed that each state be held accountable for assuring comparability in “vital services” among all its districts as well as in all schools within each district. Among these vital services, perhaps the most important is highly qualified teachers, not just for specific Chapter 1 services, but for all classrooms.
The evidence supports Ferguson's (1991) recommendation that equalization focus on districts' capacity to hire high-quality teachers. In addition to the weight of evidence indicating the central importance of qualified teachers to student learning, a real-world experience with the positive effects on teacher quality and distribution of such policies exists. When Connecticut raised and equalized beginning teacher salaries under its 1986 Education Enhancement Act, shortages of teachers (including those that had plagued urban areas) evaporated. By 1989, most teaching fields showed surpluses. The state raised standards for teacher education and licensing, initiated scholarships and forgivable loans to recruit high-need teachers into the profession (including teachers in shortage fields, those who would teach in high-need locations, and minority teachers), created a mentoring and assessment program for all beginning teachers, and invested money in high quality professional development, with special aid to low-achieving districts. The state also developed a low-stakes, performance oriented assessment program focused on higher-order thinking and performance skills, which is used to provide information to schools and districts, but not to punish children or teachers. By 1998, Connecticut had surpassed all other states in fourth grade reading and mathematics achievement on the National Assessment of Educational Progress (NAEP), and scored at or near the top of the rankings in eighth grade mathematics, science, and writing. Although Connecticut still has an achievement gap it is working to close, Black students in Connecticut score significantly higher than their counterparts elsewhere in the county (Wilson et al., 2001).
The new wave of school finance lawsuits that are challenging both within-state and within-district resource allocation disparities are also promising. These suits are increasingly able to demonstrate how access to concrete learning opportunities is impaired by differential access to resources, and how these learning opportunities translate into academic achievement for students. As standards are used to articulate clearer conceptions of what students need to learn to function in today's society and what schools need to do to support these levels of learning, lawsuits like ones recently won in Alabama and New York may be linked to definitions of the quality of education that is “adequate” to meet the state's expectations for student achievement. Such cases require remedies that link levels of funding to minimum standards of learning and teaching. As suits brought on the adequacy theory establish that learning experiences depend on resources and influence outcomes, they establish a principle of “opportunity to learn” that could allow states to define a curriculum entitlement that becomes the basis for both funding and review of school practices.
Opportunity to Learn Standards
The idea of an opportunity to learn standards was first developed by the National Council on Education Standards and Testing (NCEST), which argued for student performance standards but acknowledged they would result in greater inequality if they were not accompanied by policies ensuring access to resources, including appropriate instructional materials and well-prepared teachers (NCEST 1992, E12–E13). The Commission's Assessment Task Force proposed that states collect evidence on the extent to which schools and districts provide opportunity to learn the curriculum implied by standards as a prerequisite to using tests for school graduation or other decisions (NCEST 1992, F17–F18).
Opportunity-to-learn standards would establish, for example, that if a state's curriculum frameworks and assessments outlined standards for science learning that require laboratory work and computers, certain kinds of coursework, and particular knowledge for teaching, resources must be allocated and policies must be fashioned to provide for these entitlements. Such a strategy would leverage both school improvement and school equity reform, providing a basis for state legislation or litigation where opportunities to learn were not adequately funded.
Such standards would define a floor of core resources, coupled with incentives for schools to work toward professional standards of practice that support high-quality learning opportunities. Enacted through a combination of funding commitments, educational indicators, and school review practices, opportunity-to-learn standards would provide a basis for:
- State legislation and, if necessary, litigation that supports greater equity in funding, and in the distribution of qualified teachers;
- Information about the nature of the teaching and learning opportunities made available to students in different districts and schools across the state;
- Incentives for states and school districts to create policies that ensure adequate and equitable resources, curriculum opportunities, and teaching to all schools;
- A school review process that helps schools and districts engage in self-assessments and peer review of practice in light of standards; and
- Identification of schools that need additional support or intervention to achieve adequate opportunities to learn for their students.
Curriculum and Assessment Reform
The curriculum offered to most African American and other students of color in U.S. schools is geared primarily toward lower order “rote” skills—memorizing pieces of information and conducting simple operations based on formulas or rules—that are not sufficient for the demands of modern life or for the new standards being proposed and enacted by states and national associations. These new standards will require students to be able to engage in independent analysis and problem solving, extensive research and writing, use of new technologies, and various strategies for accessing and using resources in new situations. Major changes in curriculum and resources will be needed to ensure that these kinds of activities are commonplace in the classrooms of students of color.
These efforts to create a “thinking curriculum” for all students are important to individual futures and our national welfare. They are unlikely to pay off, however, unless other critical changes are made in curriculum, in the ways students are tracked for instruction, and the ways teachers are prepared and supported. Although mounting evidence indicates that low-tracked students are disadvantaged by current practices and that high-ability students do not necessarily benefit more from homogeneous classrooms than from heterogeneous grouping (Slavin 1990), the long-established American tracking system will be difficult to reform until there is an adequate supply of well-trained teachers—teachers who are both prepared to teach the more advanced curriculum that U.S. schools now fail to offer most students and to assume the challenging task of teaching many kinds of students with diverse needs, interests, aptitudes, and learning styles in integrated classroom settings. This, in turn, requires reforms of teacher preparation to enable teachers to become effective in using a wide repertoire of strategies suited to different learning needs.
Other important changes concern the types and uses of achievement tests in U.S. schools. As a 1990 study of the implementation of California's new mathematics curriculum framework pointed out, when a curriculum reform aimed at problem-solving and the development of higher-order thinking skills encounters an already mandated, rote-oriented, basic skills testing program, the tests win out (Cohen et al., 1990; Darling-Hammond 1990b). As one teacher put it:
Teaching for understanding is what we are supposed to be doing … (but) the bottom line here is that all they really want to know is how are these kids doing on the tests…. They want me to teach in a way that they can't test, except that I'm held accountable to the test. It's a Catch 22…. (Wilson 1990, p. 318).
Students in schools that organize most of their efforts around the kinds of low-level learning represented by commercially developed, multiple-choice tests will be profoundly disadvantaged when they encounter more rigorous evaluations like those being developed by states, the College Board, and the federal government that require greater analysis, writing, and production of elaborated answers. Initiatives to develop richer curriculum and more performance-oriented assessments that develop higher order skills have begun to address this problem in states like Connecticut, Vermont, Nebraska, Maine, and Kentucky, and in cities such as New York and Los Angeles. Unfortunately, most cities continue to rely heavily on multiple-choice tests used for many purposes like promotion and track or program placement for which they were not designed and are not valid.
The issue of how tests are used is as important as the nature of the tests themselves. The professional organizations that set standards for test use—the American Psychological Association, American Educational Research Association, and the National Council on Measurement in Education—state that no high-stakes decision should ever be made only on the basis of a test score, and that other indicators of performance such as class work and teacher observations should always be factored in. This is because no test is a foolproof predictor of ability or future performance. Most predict much less than 50% of the variance in future performance in real life settings, misleading those who would rely on tests alone as the indicators for major decisions.
Thus, the outcomes of the current wave of curriculum and assessment reforms will depend in large measure on the extent to which developers and users of new standards and tests use them to improve teaching and learning rather than merely reinforcing our tendencies to sort and select those who will get high-quality education from those who will not (Watson 1996). Policymakers will also need to pursue broader reforms to improve and equalize access to educational resources and support the professional development of teachers, so that new standards and tests are used to inform more skillful and adaptive teaching that enables more successful learning for all students (Darling-Hammond 1997). The highest achieving states in the U.S., both before and after controlling for student poverty and language background, are distinguished by the fact that they have the most well-qualified teaching forces. Most use state assessments for instructional improvement, rather than for labeling and punishing students and schools (Darling-Hammond 2000).
Investments in Quality Teaching
A key corollary to this analysis of inequality is that improved opportunities for students of color will rest, in large part, on policies that strengthen the teaching profession by boosting attractions to teaching while increasing teachers' knowledge and skills. This means providing all teachers with a stronger understanding of how children learn and develop, how a variety of curricular and instructional strategies can address their needs, and how changes in school and classroom practices can support their growth and achievement.
There are two major reasons for this approach. First, professionalizing an occupation raises the floor below which no entrants will be admitted to practice. It eliminates practices of substandard licensure that allow untrained entrants to practice disproportionately on underserved and poorly protected clients. Second, professionalization increases the overall knowledge base for the occupation, thus improving the quality of services for all clients, especially those most in need of high-quality teaching (Darling-Hammond 1990a).
The students who typically have the poorest opportunities to learn—those attending the inner-city schools that are compelled by the current incentive structure to hire disproportionate numbers of substitute teachers, uncertified teachers, and inexperienced teachers, and that lack resources for mitigating the uneven distribution of good teaching—are the students who will benefit most from measures that raise the standards of practice for all teachers. They will also benefit from targeted policies that provide quality preparation programs and financial aid for highly qualified prospective teachers who will teach in central cities and poor rural areas, including teachers of color and teachers in shortage fields. Providing equity in the distribution of teacher quality requires changing policies and long-standing incentive structures in education so that shortages of trained teachers are overcome, and schools serving low-income and minority students are not disadvantaged by lower salaries and poorer working conditions in the bidding war for good teachers.
Building and sustaining a well-prepared teaching force will require local, state, and federal initiatives. To recruit an adequate supply of teachers, states and localities will need to upgrade teachers' salaries to levels competitive with those of college graduates in other occupations, who currently earn 25% to 50% more, depending on the field. This should occur as part of a general restructuring effort, which places more resources at the school level and allocates a greater share of education dollars to classrooms, rather than to large bureaucracies who oversee them (see e.g., Darling-Hammond 1997).
Incentive structures must be reshaped to encourage the provision of highly qualified teachers to low-income and minority students. Some models are emerging. North Carolina's Teaching Fellows Program has encouraged thousands of high-ability college students—a disproportionate number of them male and minority—to enter teaching by underwriting their entire teacher preparation program in state universities. More than 75% have stayed in teaching and a large share have gone on to leadership positions in the public education system (Berry 1995). In New York City, dynamic groups of teachers and principals were invited by Chancellor Joe Fernandez to develop proposals to launch new schools. More than 200 new small schools were started since 1990, with significantly better outcomes for students (Darling-Hammond 1997; Darling-Hammond et al., 2002). One part of the hope for equalizing opportunities to learn sits in such experiments and in the policy changes they incorporate.
States must also strengthen teacher education. In almost all states, teacher education is more poorly funded than other university departments (Howard et al., 1997). It has long been used as a revenue producer for programs that train engineers, accountants, lawyers, and future doctors. Rather than bemoaning the quality of teacher training, policy makers should invest in its improvement; require schools of education to become accredited, and create assessments that allow teachers to demonstrate they can teach diverse students well. As in Connecticut's successful reforms, shortages must be met by enhanced incentives to teach rather than by lowering standards, especially for those who teach children in central cities and poor rural schools.
The federal government can play a leadership role in providing an adequate supply of well-qualified teachers just as it has in providing an adequate supply of well-qualified physicians for the nation. When shortages of physicians were a major problem more than twenty-five years ago, Congress passed the 1963 Health Professions Education Assistance Act to support and improve the caliber of medical training, to create and strengthen teaching hospitals, to provide scholarships and loans to medical students, and to create incentives for physicians to train in shortage specialties and to locate in underserved areas. Similarly, federal initiatives in education should seek to:
- Recruit new teachers, especially in shortage fields and in shortage locations, through scholarships and forgivable loans for high quality teacher education.
- Strengthen and improve teachers' preparation through improvement incentive grants to schools of education and supports for certification reform.
- Improve teacher retention and effectiveness by improving clinical training and support during the beginning teaching stage when 30% of teachers drop out. This would include funding internship programs for new teachers in which they receive structured coaching and mentoring, preferably in urban schools that are supported to provide state-of-the-art practice. (For a more complete discussion of the federal role in addressing teacher shortages, see Darling-Hammond and Sykes, 2003.)
If the interaction between teachers and students is the most important aspect of effective schooling, then reducing inequality in learning has to rely on policies that provide equal access to competent, well-supported teachers. The public education system ought to be able to guarantee that every child who is forced to go to school by public law is taught by someone who is prepared, knowledgeable, competent, and caring. As Carl Grant (1989) puts it:
Teachers who perform high-quality work in urban schools know that, despite reform efforts and endless debates, it is meaningful curricula and dedicated and knowledgeable teachers that make the difference in the education of urban students (p. 770).
Real accountability must start with ensuring all students the right to learn.
References
REFERENCES
Alexander, K. L. and
E. L. McDill
(1976)
Selection and allocation within schools: Some causes and
consequences of curriculum placement.
American Sociological Review,
41:
963–980.Google Scholar
Allington, R. and
A. McGill-Franzen
(1992)
Unintended effects of educational reform in New York.
Educational Policy,
6:
397–414.Google Scholar
Ashton, P. and
L. Crocker
(1987)
Systematic study of planned variations: The essential focus of
teacher education reform.
Journal of Teacher Education,
38:
2–8.Google Scholar
Barr, R. and
R. Dreeben
(1983).
How schools work.
Chicago, IL:
University of Chicago Press.
Barton, P. E. and
R. J. Coley
(1996).
Captive Students: Education and Training in America's Prisons.
Princeton, NJ:
Educational Testing Service.
Berry, B.
(1995).
Keeping Talented Teachers: Lessons Learned from the North Carolina
Teaching Fellows.
Commissioned by The North Carolina Teaching Fellows Commission,
Raleigh, NC:
Public School Forum.
Betts, J. R.,
K. S. Rueben, and
A. Danenberg
(2000).
Equal Resources, Equal Outcomes? The Distribution of School
Resources and Student Achievement in California.
San Francisco:
Public Policy Institute of California.
Bowman, B.
(1993).
Early childhood education. In
L. Darling-Hammond (Ed.),
Review of Research in Education, 19: pp.
101–134
Washington, DC:
American Educational Research Association.
Braddock, J. and
J. M. McPartland
(1993).
Education of early adolescents. In
L. Darling-Hammond (Ed.),
Review of Research in Education, 19: pp.
135–170.
Washington, DC:
American Educational Research Association.
Cohen, D. et al.
(1990).
Case studies of curriculum implementation.
Educational Evaluation and Policy Analysis,
12:
3.Google Scholar
College Board
(1985).
Equality and Excellence: The Educational Status of Black Americans.
New York:
College Entrance Examination Board.
Coleman, J. S.,
E. Q. Campbell,
C. J. Hobson,
J. McPartland,
A. M. Mood,
F. D. Weinfeld, and
R. L. York
(1966).
Equality of Educational Opportunity.
Washington, DC:
U.S. Government Printing Office.
Commission on Chapter 1
(1992).
High Performance Schools: No Exceptions, No Excuses.
Washington, DC:
Author.
Cooper, E. and
J. Sherk
(1989)
Addressing urban school reform: Issues and alliances.
Journal of Negro Education,
58:
315–331.Google Scholar
Cremin, L.
(1970).
American Education: The Colonial Experience 1607–1783.
New York:
Harper & Row.
Darling-Hammond, L.
(1990a).
Teacher quality and equality. In
J. Goodlad &
P. Keating (Eds.),
Access to Knowledge: An Agenda for Our Nation's Schools.
New York:
College Entrance Examination Board.
237–258.
Darling-Hammond, L.
(1990b)
Instructional policy into practice: “The power of the bottom
over the top.”
Educational Evaluation and Policy Analysis,
12:
233–242.Google Scholar
Darling-Hammond, L.
(1991).
The Implications of Testing Policy for Quality and Equality.
Phi Delta Kappan,
November 1991:
220–225.Google Scholar
Darling-Hammond, L.
(1997).
The Right to Learn: A Blueprint for Creating Schools that Work.
San Francisco:
Jossey Bass.
Darling-Hammond, L.
(2000, January).
Teacher quality and student achievement: A review of state policy
evidence.
Educational Policy Analysis Archives,
8 (1):
http://epaa.asu.edu/epaa/v8n1.Google Scholar
Darling-Hammond, L.,
J. Ancess, and
S. Ort
(2002)
Reinventing high school: outcomes of the coalition campus school
project.
American Educational Research Journal,
39(3):
639–673.Google Scholar
Darling-Hammond, L. and
G. Sykes
(2003).
Wanted: A national teacher supply policy for education: The right way
to meet the ‘highly qualified teacher’ challenge.
Educational Policy Analysis Archives,
11, (3).
http://epaa.asu.edu/epaa/v11n33/.Google Scholar
Davis, D. G.
(1986).
A Pilot Study to Assess Equity in Selected Curricular Offerings
across Three Diverse Schools in a Large Urban School District.
Paper presented at the Annual Meeting of the American Educational
Research Association, San Francisco.
Dreeben, R.
(1987, Winter).
Closing the Divide: What Teachers and Administrators Can Do To Help
Black Students Reach Their Reading Potential.
American Educator,
11:
28–35.Google Scholar
Dreeben, R. and
A. Gamoran
(1986)
Race, instruction, and learning.
American Sociological Review,
51:
660–669.Google Scholar
Dreeben, R. and
R. Barr
(1987).
Class Composition and the Design of Instruction.
Paper presented at the Annual Meeting of the American Education
Research Association, Washington, DC.
Du Bois, W. E. B.
(1970).
The freedom to learn. In
Dr. P. S. Foner (Ed.)
W. E. B. Du Bois Speaks.
New York:
Pathfinder,
230–231.
Ebmeier, H.,
S. Twombly, and
D. Teeter
(1990).
The comparability and adequacy of financial support for schools of
education.
Journal of Teacher Education,
42:
226–235.Google Scholar
Eckstrom, R. and
A. M. Villegas
(1991)
Ability grouping in middle grade mathematics: Process and
consequences.
Research in Middle Level Education,
15:
1–20.Google Scholar
Educational Testing Service
(1991).
The State of Inequality.
Princeton, NJ:
E.T.S.
Ferguson, R. F.
(1991, Summer).
Paying for public education: New evidence on how and why money
matters.
Harvard Journal on Legislation,
28:
465–498.Google Scholar
Ferguson, R. F. and
H. F. Ladd
(1996).
How and why money matters: An analysis of Alabama schools. In
Helen Ladd (Ed.)
Holding Schools Accountable.
Washington, DC:
Brookings Institution.
Fetler, M.
(1999).
High school staff characteristics and mathematics test results.
Education Policy Analysis Archives,
7
(March 24):
http://epaa.asu.edu.Google Scholar
Figlio, D. N. and
L. S. Getzler
(2002, April).
Accountability, Ability, and Disability: Gaming the System?
Cambridge, MA:
National Bureau of Economic Research.
Finley, M. K.
(1984)
Teachers and tracking in a comprehensive high school.
Sociology of Education,
57:
233–243.Google Scholar
Fuller, E.
(1998, November).
Do properly certified teachers matter? A comparison of elementary
school performance on the TAAS in 1997 between schools with high and
low percentages of properly certified regular education teachers.
Austin, TX:
The Charles A. Dana Center, University of Texas at Austin.
Fuller, E.
(2000).
Do properly certified teachers matter? Properly certified Algebra
teachers and Algebra I achievement in Texas.
Paper presented at the annual meeting of the American Educational
Research Association. New Orleans, LA, April, 2000.
Futernick, K.
(2001).
A district-by-district analysis of the distribution of teachers in
California and an overview of the Teacher Qualification Index (TQI).
Sacramento:
California State University, Sacramento,
April, 2000.
Gamoran, A.
(1992)
Access to excellence: Assignment to honors English classes in the
transition from middle to high school.
Educational Evaluation and Policy Analysis,
14:
185–204.Google Scholar
Gamoran, A.
(1990).
The consequences of track-related instructional differences for
student achievement.
Paper presented at the Annual Meeting of the American Educational
Research Association, Boston.
Gamoran, A. and
M. Berends
(1987)
The effects of stratification in secondary schools: Synthesis of
survey and ethnographic research.
Review of Educational Research,
57:
415–436.Google Scholar
Gamoran, A. and
R. Mare
(1989)
Secondary school tracking and educational inequality: Compensation,
reinforcement or neutrality?
American Journal of Sociology,
94:
1146–1183.Google Scholar
Garcia, E.
(1993)
Language, culture, and education. In L. Darling-Hammond (Ed.),
Review of Research in Education,
19:
51–98.
Washington, DC: American Educational Research Association.Google Scholar
Gemignani, R. J.
(1994, October).
Juvenile Correctional Education: A Time for Change. Update on
Research.
Juvenile Justice Bulletin.
(U.S. Department of Justice, Office of Juvenile Justice and
Delinquency Prevention).Google Scholar
Glaser, R.
(1981)
The future of testing: A research agenda for cognitive psychology
and psychometrics.
American Psychologist,
39:
923–936.Google Scholar
Glaser, R.
(1990).
Testing and assessment: O Tempora! O Mores!
Pittsburgh, PA:
University of Pittsburgh, Learning Research and Development Center.
Goe, L.
(2002).
Legislating equity: The distribution of emergency permit teachers
in California.
Berkeley:
Graduate School of Education, University of California, Berkeley.
Goldhaber, D. D. and
D. J. Brewer
(2000)
Does teacher certification matter? High school certification status
and student achievement.
Educational Evaluation and Policy Analysis,
22:
129–145.Google Scholar
Good, T. L. and
J. Brophy
(1987).
Looking in Classrooms.
New York:
Harper and Row.
Grant, C. A.
(1989, June).
Urban teachers: Their new colleagues and curriculum.
Phi Delta Kappan,
70:
764–770.Google Scholar
Greenwald, R.,
L. V. Hedges, and
R. D. Laine
(1996)
The effect of school resources on student achievement.
Review of Educational Research,
66:
361–396.Google Scholar
Grissmer, D. W.,
A. Flanagan,
J. Kawata, and
S. Williamson
(2000).
Improving student achievement: What NAEP state test scores tell us.
Santa Monica:
RAND Report.
Available online:
http://www.rand.org/publications/MR/MR924.
Haney, W.
(2000).
The myth of the Texas miracle in education.
Educational Policy Analysis Archives,
(41):
http://epaa.asu.edu/epaa/v8n41/.Google Scholar
Hanushek, E.
(2003).
The Structure of Analysis and Argument in Plaintiff Expert Reports for
Williams v. State of California.
Downloaded on 4/19/04 from
http://www.mofo.com/decentschools/expert_reports/hanushek_report.pdf.
Hawk, P.,
C. R. Coble, and
M. Swanson
(1985).
Certification: It does matter.
Journal of Teacher Education,
36:
13–15.Google Scholar
Hedges, L. V.,
R. D. Laine, and
R. Greenwald
(1994)
Does money matter? A meta-analysis of studies of the effects of
differential school inputs on student outcomes.
Educational Research,
23:
5–14.Google Scholar
Henke, R. R.,
X. Chen,
S. Geis, and
P. Knepper.
(2000).
Progress Through the Teacher Pipeline: 1992–93 College
Graduates and Elementary/Secondary School Teaching as of 1997.
NCES 2000–152.
Washington, DC:
National Center for Education Statistics.
Howard, R.,
R. Hitz, and
L. Baker
(1997).
Comparative Study of Expenditures per Student Credit Hour of Education
Programs to Programs of other Disciplines and Professions.
Montana State University-Bozeman.
Hoffer, T. B.
(1992)
Middle school ability grouping and student achievement in science
and mathematics.
Educational Evaluation and Policy Analysis,
14(3):
205–227.Google Scholar
Jacob, B. A.
(2002).
The impact of high-stakes testing on student achievement:
Evidence from Chicago. Working Paper. Harvard University.
Jones, L. V.
(1984)
White-Black achievement differences: The narrowing gap.
American Psychologist,
39:
1207–1213.Google Scholar
Jones, L. V.,
N. W. Burton, and
E. C. Davenport
(1984)
Monitoring the achievement of Black students,
Journal for Research in Mathematics Education,
15:
154–164.Google Scholar
Kaufman, J. E. and
J. E Rosenbaum
(1992)
Education and employment of low-income Black youth in White
suburbs.
Educational Evaluation and Policy Analysis,
14:
229–240.Google Scholar
Kluger, R.
(1976).
Simple Justice.
New York:
Alfred A. Knopf.
Kozol, J.
(1991).
Savage Inequalities.
New York:
Crown.
Krueger, A. B.
(2000).
Economic Considerations and Class Size,
Paper 447.
Princeton University, Industrial Relations Section.
www.irs.princeton.edu/pubs/working_papers.html.
Kulik, C. C. and
J. A. Kulik
(1982)
Effects of ability grouping on secondary school students:
A meta-analysis of evaluation findings.
American Education Research Journal,
19:
415–428.Google Scholar
Lankford, H.,
S. Loeb, and
J. Wyckoff
(2002)
Teacher sorting and the plight of urban schools: A descriptive
analysis.
Education Evaluation and Policy Analysis,
24:
37–62.Google Scholar
Lee, V. and
A. Bryk
(1988)
Curriculum tracking as mediating the social distribution of high
school achievement.
Sociology of Education,
61:
78–94.Google Scholar
MacPhail-Wilcox, B. and
R. A. King
(1986)
Resource allocation studies: Implications for school improvement
and school finance research.
Journal of Education Finance,
11:
416–432.Google Scholar
Massachusetts Department of Education
(2004).
Dropout Rates for 2002–03 at
http://www.doe.mass.edu/infoservices/reports/dropout/0203/dropouts.pdf.
Matthews, W.
(1984)
Influences on the learning and participation of minorities in
mathematics.
Journal for Research in Mathematics Education,
15:
84–95.Google Scholar
McKnight, C. C.,
J. A. CrossWhite,
J. A. Dossey,
E. Kifer,
S. O. Swafford,
K. J. Travers, and
T. J. Cooney
(1987).
The underachieving curriculum: Assessing U.S. School mathematics
from an international perspective.
Champaign, IL:
Stipes Publishing.
Meier, K. J.,
J. Stuart, Jr., and
R. E. England
(1989).
Race, class and education: The politics of second-generation
discrimination.
Madison, WI:
University of Wisconsin Press.
Miller, J. G.
(1997, June).
African American males in the criminal justice system.
Phi Delta Kappan,
K1–K12.Google Scholar
Monk, D. H.
(1994)
Subject matter preparation of secondary mathematics and science
teachers and student achievement.
Economics of Education Review,
13:
125–145.Google Scholar
Moore, D. and
S. Davenport
(1988).
The new improved sorting machine.
Madison, WI:
National Center on Effective Secondary Schools.
Moore, E. G. and
A. W. Smith
(1985)
Mathematics aptitude: Effects of coursework, household language,
and ethnic differences.
Urban Education,
20:
273–294.Google Scholar
National Center for Education Statistics
(1985).
The condition of education, 1985.
Washington, DC:
U.S. Department of Education.
National Center for Education Statistics (NCES)
(1994).
Digest of Education Statistics, 1994.
Washington, DC:
U.S. Department of Education.
National Center for Education Statistics (NCES)
(1997).
America's Teachers: Profile of a Profession, 1993–94.
Washington, DC:
U.S. Department of Education.
National Center for Education Statistics (NCES)
(1998).
The Condition of Education, 1998.
Washington, DC:
U.S. Department of Education.
National Center for Education Statistics (NCES)
(2000).
Digest of Education Statistics, 1999.
Washington, DC:
U.S. Department of Education.
National Center for Education Statistics (NCES)
(2002).
The Condition of Education, 2002.
Washington, DC:
U.S. Department of Education.
National Commission on Teaching and America's Future
(NCTAF)
(1996).
What Matters Most: Teaching for America's Future.
New York:
Author.
National Commission on Teaching and America's Future
(NCTAF)
(1997).
Unpublished tabulations from the 1993–94 Schools and Staffing
Surveys.
National Commission on Teaching and America's Future
(NCTAF)
(2003).
No Dream Denied: A Pledge to America's Children.
New York:
Author.
National Council on Education Standards and Testing
(NCEST)
(1992).
Raising standards for American education.
Washington, DC:
Government Printing Office.
Oakes, J.
(1985).
Keeping Track.
New Haven, CT:
Yale University Press.
Oakes, J.
(1986)
“Tracking in secondary schools: A contextual
perspective.”
Educational Psychologist,
22:
129–154.Google Scholar
Oakes, J.
(1990).
Multiplying inequalities: The effects of race, social class, and
tracking on opportunities to learn mathematics and science.
Santa Monica, CA:
The RAND Corporation.
Oakes, J.
(1992)
Can tracking research inform practice? Technical, normative, and
political considerations.
Educational Researcher,
21:
12–21.Google Scholar
Oakes, J.
(1993).
Ability Grouping, Tracking, and Within-School Segregation in the
San Jose Unified School District.
Los Angeles, CA:
University of California, Los Angeles.
Oakes, J.
(2003).
Teaching to Change the World.
Boston, MA:
McGraw-Hill.
Orfield, G.
(2001).
Schools more separate: Consequences of a decade of resegregation,
Cambridge, MA,
The Civil Rights project, Harvard University.
Orfield, G. and
C. Ashkinaze
(1991).
The Closing Door: Conservative Policy and Black Opportunity.
Chicago:
University of Chicago Press, p. 139.
Paterson Institute
(1996).
The African American data book.
Reston, VA:
Paterson Institute.
Pelavin, S. H. and
M. Kane
(1990).
Changing the odds: Factors increasing access to college.
New York:
College Entrance Examination Board.
Resnick, L. B.
(1987).
Education and learning to think.
Washington, DC:
National Academy Press.
Rock, D. A.,
T. L. Hilton,
J. Pollack,
R. B. Ekstrom, and
M. E. Goertz
(1985).
A study of excellence in high school education: Educational
policies, school quality, and student outcomes.
Washington, DC:
National Center for Education Statistics.
Rosenbaum, J.
(1976).
Making Inequality: The Hidden Curriculum of High School Tracking.
New York:
Wiley.
Shields, P. M.,
D. C. Humphrey,
M. E. Wechsler,
L. M. Riel,
J. Tiffany-Morales,
K. Woodworth,
V. M. Youg, and
T. Price
(2001).
The status of the teaching profession 2001.
Santa Cruz, CA:
The Center for the Future of Teaching and Learning.
Slavin, R. E.
(1990)
Achievement effects of ability grouping in secondary schools: A
best evidence synthesis.
Review of Educational Research,
60:
471–500.Google Scholar
Smith, F. et al.
(1986).
High School Admission and the Improvement of Schooling.
New York:
New York City Board of Education.
Strauss, R. P. and
E. A. Sawyer
(1986).
Some New Evidence on Teacher and Student Competencies.
Economics of Education Review,
5:
41–48.Google Scholar
Talbert, J. E.
(1990).
Teacher tracking: Exacerbating inequalities in the high school.
Stanford, CA:
Center for Research on the Context of Secondary Teaching, Stanford
University.
Taylor, W. L. and
D. M. Piche
(1991).
A report on shortchanging children: The impact of fiscal inequity
on the education of students at risk.
Prepared for the Committee on Education and Labor, US House of
Representatives.
Washington, DC:
US Government Printing Office.
Trimble, K. and
R. L. Sinclair
(1986).
Ability grouping and differing conditions for learning: An analysis
of content and instruction in ability-grouped classes.
Paper presented at the annual meeting of the American Educational
Research Association, San Francisco.
Tyack, D.
(1974).
The one best system.
Cambridge, MA:
Harvard University Press.
U.S. Bureau of the Census.
(1992).
Statistical abstract of the United States: 1992.
112th edition.
Washington, DC:
U.S. Department of Commerce.
U.S. Bureau of the Census
(1996).
Statistical abstract of the United States: 1996.
116th edition.
Washington, DC:
U.S. Department of Commerce.
Useem, E. L.
(1990, Fall).
You're good, but you're not good enough: Tracking students
out of advanced mathematics.
American Educator,
14:
24–27, 43–46.Google Scholar
Usiskin, Z.
(1987)
Why elementary algebra can, should, and must be an eighth grade
course for average students.
Mathematics Teacher,
80:
428–438.Google Scholar
Watson, B. C.
(1996).
Testing: Its origins, use and misuse.
Philadelphia, PA:
Urban League of Philadelphia.
Wenglinsky, H.
(2002).
How Schools Matter: The Link between Teacher Classroom Practice and
Student Academic Performance.
Education Policy Analysis Archives,
10 (12);
http://epaa.asu.edu/epaa/vlon12/.Google Scholar
Wheelock, A.
(1992).
Crossing the Tracks.
New York:
The New Press.
Wheelock, A.
(2003).
School Awards Programs and Accountability in Massachusetts: Misusing MCAS
Scores to Assess School Quality.
http://www.fairtest.org/arn/Alert20June02/Alert20Full20Report.html.
Wilson, S.
(1990)
A conflict of interests: Constraints that affect teaching and
change.
Educational Evaluation and Policy Analysis,
12:
309–326.Google Scholar
Wilson, S. M.,
L. Darling-Hammond, and
B. Berry
(2001).
Teaching policy: Connecticut's long-term efforts to improve
teaching and learning.
Seattle:
Center for the Study of Teaching and Policy, University of
Washington.
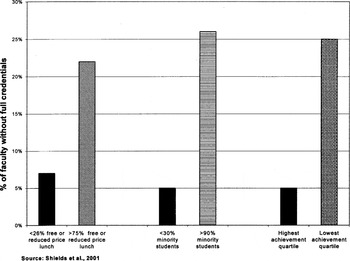
Distribution of Unqualified Teachers in California, 2001
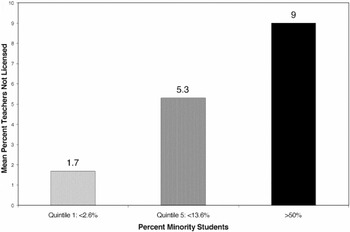
Distribution of Unqualified Teachers in Massachusetts, 2001
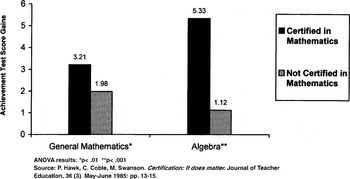
Effects on Student Achievement of Teacher Certification in Mathematics
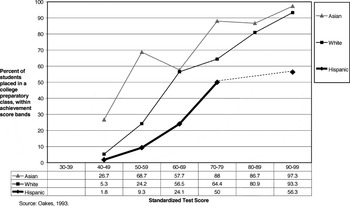
Likelihood of Placement in a College Preparatory Course, Controlling for Standardized Test Scores (9th grade)
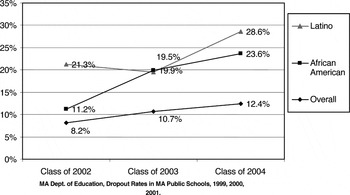
Percentage of 9th Grade MA Students “Lost” Between 9th and 10th Grades
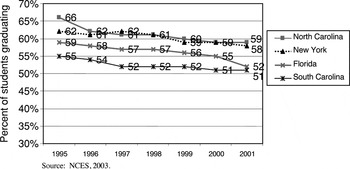
State Graduation Rates, 1995–2001
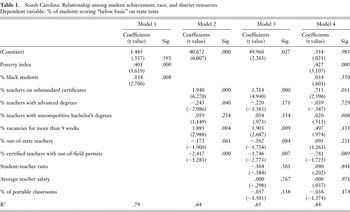
South Carolina: Relationship among student achievement, race, and district resources Dependent variable: % of students scoring “below basic” on state tests
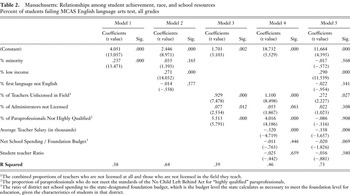
Massachusetts: Relationships among student achievement, race, and school resources Percent of students failing MCAS English language arts test, all grades
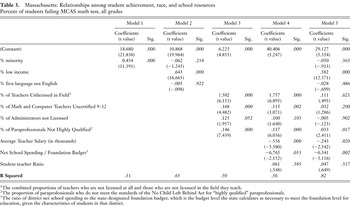
Massachusetts: Relationships among student achievement, race, and school resources Percent of students failing MCAS math test, all grades
 You have
Access
- 115
- Cited by