Introduction
Over the last two decades from 1990 to 2012, the life expectancy at birth increased by approximately 4 years in both men and women in most developed countries (WHO), although the rate has slowed in some countries. For several years now, Japanese women have had the world's longest life expectancy: 86.41 years as of 2012. The life expectancy of Japanese men, which was 79.94 in 2012, ranked fifth in the world (WHO, 2013).
The idea that human life expectancy is approaching its limit has been debated for many years. Researchers from empirical and theoretical fields have had different opinions (Kannisto et al., Reference Kannisto, Lauritsen, Thatcher and Vaupel1994; Vaupel & Lundström, Reference Vaupel, Lundström and Lutz1996; Thatcher et al., Reference Thatcher, Kannisto and Vaupel1998; Wilmoth et al., Reference Wilmoth, Deegan, Lundström and Horiuchi2000; Lynch & Brown, Reference Lynch and Brown2001; Olshansky & Carnes, Reference Olshansky, Carnes and Désesquelles2001; Oeppen & Vaupel, Reference Oeppen and Vaupel2002). Nevertheless, there has been an undeniably strong and continuing acceleration in the emergence of a centenarian population (people who have reached the age of 100) throughout the world and particularly in Japan (Kannisto, Reference Kannisto1994; Centenarians in the US, Reference Krach and Velkoff1999; MHLW, 2011). Observing the changes of the death rates and life expectancy in centenarians may help to clarify the issue of the limit to human life expectancy.
The decrease in mortality from age 80 can explain the increase in the total number of centenarians (Horiuchi, Reference Horiuchi1991; Kannisto et al., Reference Kannisto, Lauritsen, Thatcher and Vaupel1994; Tuljapurkar, et al., Reference Tuljapurkar, Li and Boe2000; Thatcher et al., Reference Thatcher, Cheung, Horiuchi and Robine2010). However, mortality varies before the age of 100 in several countries. Compared with Sweden, France, England and Japan, mortality in the United States is relatively high before the age of 65 and relatively low at the age of 80 and after (Manton & Vaupel, Reference Manton and Vaupel1995). The survival curves for persons aged 80 to 100 born in 1885–1889 show the United States has the best survival and Japan the worst (Manton & Vaupel, Reference Manton and Vaupel1995). However, some results indicate otherwise. A Japanese cohort born between 1905 and 1910 experienced the lowest level of mortality from age 85 to 100 compared with the four European countries Denmark, France, Sweden and Switzerland (Robine et al., Reference Robine, Cheung, Saito, Jeune, Parker and Herrmann2010). The increase in life expectancy at the age of 80 between 1960 and 2000 was 3.32 and 5.06 years for Japanese males and females, respectively (Rau et al., Reference Rau, Soroko, Jasilionis and Vaupel2008). The average life expectancies of male and female centenarians at the age of 100 were 1.68 and 1.97 years, respectively, in Belgium (Poulain et al., Reference Poulain, Chambre, Foulon, Zhang and Liu2001). However, how the average life expectancy, death rate and maximum age of centenarians change over time is not well known. It is not known whether it has the same trend as that in populations under the age of 100 or not. Although Robine et al. (Reference Robine, Saito and Jagger2003) concluded that the death rates at ages 100–104 decreased for men and women during the 25 years from 1973 to 1999 in Japan, unfortunately the results were not for a birth cohort. Japan has the longest average life expectancy at birth and the largest centenarian population, yet the changes in life expectancy and maximum age of centenarians over time is still not clear. Research into centenarians should afford new opportunities to explore the oldest-old mortality and the factors in exceptional longevity, as well as to better understand the human life span.
To examine the changes in life expectancy at the age of 100 and maximum age over time, as well as whether the survival trends in Japan show a different pattern from those in other developed countries, a birth cohort of persons born between 1881 and 1900 was used for the following analyses.
Methods
Data
Data were from the open access annual reports published by the Ministry of Health, Labour and Welfare of Japan (MHLW), which contain the annual number of centenarian deaths by sex and age between 1981 and 2012 (MHLW, 2012). In Japan, information on surviving centenarians can be obtained from five sources (Robine et al., Reference Robine, Saito and Jagger2003). The first source is the Family Registration System, which is a record of births, adoptions, deaths, marriages and divorces of all family members beginning from 1872. The second source is the Resident Registration System, which began in 1914. It contains the address, date of birth, date of death and relationship to the household head on a resident's card. The second source is current and cannot be used to trace family lineage. The third source is the national census, which is conducted every five years. The fourth source is the list of pension recipients maintained by the Japanese pension service. The fifth source is a list of centenarians (Zenkoku Koreisha Meibo) published annually by the MHLW based on the data in the Resident Registry System. The date of death is reported to the municipality where the person resided. After all of the information on centenarians is confirmed by the local government officials, the municipalities compile a list of centenarians from the Resident Registration System and report it to the MHLW before September 30th each year. Such lists have been created every year since 1963. Two survivors, women aged 113 and 115 years old who were born in 1898 and 1900, respectively, were still alive at the end of 2012. The birth year groups used in the analyses were 1881–1885, 1886–1890, 1891–1895 and 1896–1900.
Statistical analysis
The average life expectancy at 100 years old was calculated by integrating the survival curves from ages 100 to positive infinity. The annual death rate at 100 years old was calculated using the number of survivors at the age of 100 as the denominator and the number of deaths between the age of 100 and 101 as the numerator. The survival curves from 100 years old were estimated using the Kaplan–Meier method, and the log-rank test was used to compare the groups. The sex- and birth-year-specific maximum age was the age of a last survivor among the people born in a certain birth year.
To investigate the association between sex/birth year and average life expectancy/maximum age, an analysis of covariance was performed using a linear regression model with sex, birth year and their corresponding interaction term as independent factors. The interaction term was not included in the final regression model when it had no statistical significance. The 95% confidence intervals (CIs) for coefficients were estimated based on the Wald test.
In addition, to explore the differences in survival time between birth year groups, a Cox regression analysis was performed for survival time by sex adjusted by birth year interval. The 95% confidence intervals for the hazard ratio were estimated based on the Wald test. Linear regression was used to observe the correlation between the death rate at each age from 100 and the birth year. All analyses were performed using SAS version 9.3 (SAS Institute Inc., Cary, North Carolina).
Results
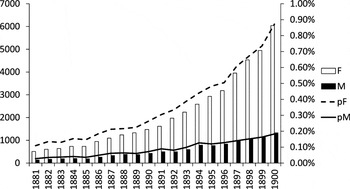
A total of 54,435 cases were included in the analysis (women: 43,301; men: 11,134). The number of centenarians increased with each birth year from 1881 (women: 507; men: 133) to 1900 (women: 6039; men: 1330). Also, the probability of reaching age 100 increased much more in women than that in men (Fig. 1).
Number and probability of reaching age 100 by birth year and sex, Japan 1881–1900.

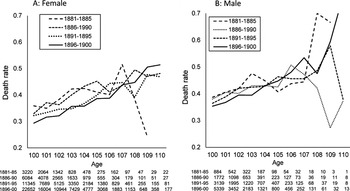
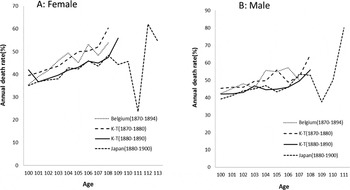
The trends in the annual death rate in centenarians were analysed to investigate the potential factors associated with the increase in life expectancy. Figure 2 shows a decrease in death rate by birth year group at ages up to 104 years in women and men, but the trend did not hold true at ages 105 and older. A similar trend in the death rate increase with age was observed in several other countries. The death rates in male and female centenarians in Japan were the lowest out of several countries (Fig. 3).
Changes in death rates of Japanese centenarians born in 1881–1900 by birth year group. The numbers in the table represent the number at risk for different age groups.

Comparison of the death rates among studies. Kannisto-Thatcher (K-T) is an international old-age mortality dataset published by Väinö Kannisto.

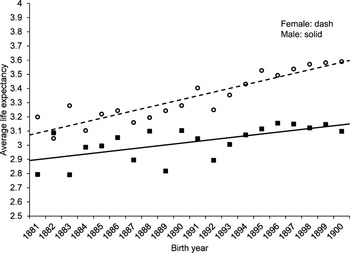
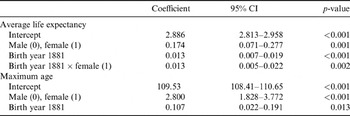
The average life expectancy at 100 years old ranged from 2.79 to 3.10 years in men and 3.04 to 3.58 years in women. The life expectancy at 100 years old increased by 0.013 years (95% CI: 0.007–0.019) per birth year in men and 0.026 per year in women over the course of the study period. Women had a longer life expectancy than men, with a difference of 0.174 years (95% CI: 0.071–0.277) at 1881 and increasing by 0.013 years each year thereafter (Fig. 4, Table 1).
Average life expectancy of centenarians at age 100 years.

Factors associated with average life expectancy and maximum age, Japan 1881

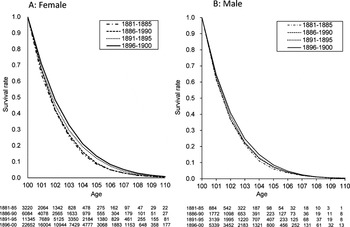
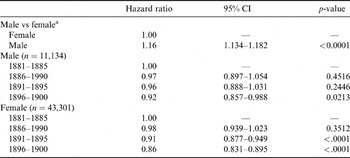
To explore whether there is a significant difference in death rates between birth years, the stratified survival curves and hazard ratios were estimated. Survival rates tended to increase by birth year in both sexes (Fig. 5). In the Cox regression analysis, in women the hazard ratios were 0.91 (95% CI: 0.877–0.949) in 1891–1895 and 0.86 (95% CI: 0.831–0.895) in 1896–1900 when using 1881–1885 as a reference. In men, the hazard ratio was 0.92 (95% CI: 0.857–0.988) in 1896–1900 when using 1881–1885 as a reference. The risk of death in men was higher than that in women (hazard ratio of 1.16, 95% CI: 1.14–1.19; Table 1 and Fig. 5). In the current data, the hazard ratios indicate the risk of death has decreased significantly by birth year group in both sexes (Table 2 and Fig. 5).
Survival curves of centenarians by birth year group. The numbers in the table represent the number at risk for different age groups.

The hazard ratio of death in centenarians by birth year group, Japan

a Adjusted for birth years.
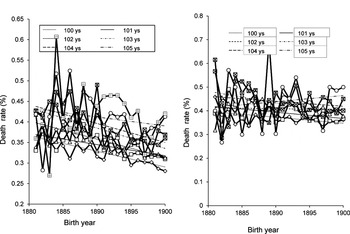
By applying linear regression to the 20-year data, it was found that in women the death rate decreased significantly at every age by birth year until age 104, whose parameter estimates are −0.0038, −0.0027, −0.0044, −0.0049 and −0.0046 from age 100 to 104, respectively (p<0.05), but the trend did not hold true at ages 105 (parameter estimate −0.0022, p>0.05) and older. In men, the death rate showed significant declines at ages 100 and 103, and it did not show a similar trend as that in women. Men had a higher death rate than women at every age above 100 (Fig. 6).
Linear change in death rates with birth year by age 100–105 years.

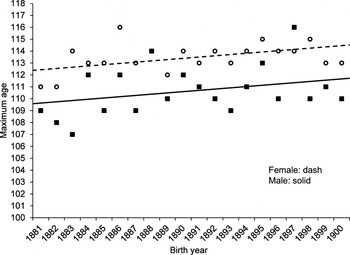
The maximum age was plotted for each birth year and by sex to explore the trends in the changes in maximum age. The maximum age in women was almost always higher than that in men for all birth year groups. The maximum age in both sexes tended to increase by 0.107 years (95% CI: 0.022–0.191) per year. The maximum age in women was 2.8 years (95% CI: 1.83–3.77) higher than that in men for the current range of birth years (Table 1 and Fig. 7).
Maximum age of centenarians in Japan by birth year.

Discussion
This study aimed to assess the influence of birth rate on the number of centenarians at 100 years old in Japan, and calculated the birth rate ratios of men and women (1900 vs 1881) as 1.376 and 1.385, respectively. The ratio of centenarians/birth rate increased much more in men than that in women in the cohort born between 1881 and 1900.
As the number of centenarians increases, does the life expectancy of centenarians at 100 years old continue to increase? While more women than men reach the age of 100, do female centenarians live longer than their male centenarians? This research found that the average life expectancy of centenarians at 100 years old increased by 0.013 years per year in men and 0.026 per year in women. Female centenarians lived slightly longer than their male counterparts, with an average difference of 0.174 years. The risk of death decreased significantly by birth year group in both sexes.
This trend of increased life expectancy and decreased death rate in centenarians at 100 years old has been observed in many countries. It has been shown that a reduction in mortality is the primary factor in the growth of the centenarian population during recent decades (Horiuchi, Reference Horiuchi1991; Jeune & Vaupel, Reference Jeune and Vaupel1995). Using the latest data in Japan estimated with the hazard ratio, it was possible to show that the death rates in both male and female centenarians decreased significantly by birth year group, and women had a lower death rate, which is consistent with the increase in life expectancy and longer life expectancy of female centenarians. The increase in average life expectancy and decrease in death risk of centenarians at the age of 100 by birth year indicates that the life span of humans is still naturally increasing, although at a slow rate of speed.
This study found a sex difference in the average life expectancy and maximum age of centenarians, with both being higher in women than in men. As is well known, there has been a large sex difference in life expectancy at birth for a long time. However, by the early 1980s, a reversal in this long-term pattern had occurred in some countries. This trend then later peaked and thereafter began to decline (Trovato & Heyen, Reference Trovato and Heyen2006; Trovato & Lalu, Reference Trovato and Lalu2007). The peak values declined from 7.0 to 6.8 years at 2010 in Japan (Liu et al., Reference Liu, Arai, Obayashi, Kanda, Boostrom, Lee and Tamashiro2013) and from 8.0 to 6.7 years at 2005 in Korea (Yang et al., Reference Yang, Khang, Chun, Harper and Lynch2012). Now, in Japan, the life expectancy at 100 years old in women is 0.174 years longer than that in men. Although a sex difference in life expectancy at 100 years old is still observed, it is becoming narrower compared with that at birth by absolute value of difference. However, when the sex proportion of the life expectancy was estimated it was found that female to male ratios of life expectancy at birth were around 1.07–1.09 from 1947 to 2010 in Japan (MHLW, 2010). The female to male ratios of life expectancy at age 100 were from 1.09 to 1.15 in the 1881–1900 birth cohort. The sex ratio of life expectancy doesn't change much from birth to age 100 and increased at the similar pace in Japan. Figure 6 shows that Japan has the lowest death rate of centenarians compared with several other countries. The average life expectancy at 100 years old is 2.79–3.10 years in men and 3.04–3.58 years in women in Japan, which is higher than that of 695–740 days in the 1870–1894 birth cohort among female Belgians (Poulain et al., Reference Poulain, Chambre, Foulon, Zhang and Liu2001). All of the above data support the claim that the average life expectancy at birth and at 100 years old in Japan is the highest out of several countries. The reason for the longer life expectancy in women and whether or not this difference will disappear needs further long-term research.
It is well known that the death rates in centenarians decrease by birth year in men and women, but how do the death rates at every age change over time? It was found that changes in the death rates at ages 100–104 in women and at age 100 in men significantly decreased according to the linear correlation coefficient. There was no significant decline at age 105 and above in women and at age 101 and above in men, which is different from the significant decrease in the death rates at ages 100–104 for both men and women during 1975–2000 in Japan as reported by Robine et al. (Reference Robine, Saito and Jagger2003). This was also true at age 105 and older for women. The results suggest a decline in death rates and an increase and sex difference in life expectancy may be the main factors in the change in the death rate before age 105 in women. Whether the death rates at ages 104 and older in women and 100 and older in men will decrease by birth year in the future needs further long-term research. Observing the changes in death rates as a graph sometimes leads to inaccuracy.
The study cohort included subjects born between 1881 and 1900, and the time span of the follow-up is nearly 130 years. Although the cohort follow-up period is shorter than that of a study in Sweden (Wilmoth et al., Reference Wilmoth, Deegan, Lundström and Horiuchi2000), the follow-up time is believed to be long enough to obtain a sufficient number of individuals of extreme age. The maximum age was 101 during the 1860s, around 112 in the 1990s in Sweden (Wilmoth et al., Reference Wilmoth, Deegan, Lundström and Horiuchi2000) and around 112 in the 2000s in Japan. The oldest maximum age at death in Japan in 2011 was 115.
Conclusion
The results of this study into centenarians in Japan showed that the average life expectancy of centenarians at 100 years old and the maximum age tend to increase by birth year and women have a longer life expectancy than men. The significant decrease in death at every age before age 105 in women largely contributed to augmenting the average life expectancy as well as the sex difference thereof. Japanese centenarians had the lowest death rate among several countries.