As the opening quotes emphasize, the replacement of the sailing ship by the steamship had wide-ranging effects on European immigration to the United States during the nineteenth century. The steamship shortened the length of the voyage from a minimum of five or six weeks to less than two weeks and decreased the variability of arrival time.3
On the variability of voyages under sail, see the discussions in Gould, “European,” pp. 613–14; and Tyler, Steam, pp. 125–28.
Both factors reduced mortality. In turn, the shorter voyage led to a change in the nature of immigration. Under sail, immigration was usually permanent and comprised of families, though they sometimes migrated in stages. Under steam, more males migrated on a temporary basis. Individuals would come to the United States to work for a period of time and then return to their European homes. In addition, the steamship drastically shortened the trip from Mediterranean ports. It was also easier for steamships to get in and out of secondary ports of call. Ships, for example, might leave from Le Havre and stop in Southampton, or leave from Liverpool and stop at an Irish port. The result was that people could leave on better quality ships from many more European ports. Finally, steamships became substantially larger than sailing ships, allowing passengers to cross the ocean in greater comfort. All these factors reduced the costs of migrating, led to a rise in volume, and increased the areas in Europe from which immigrants came.
Most previous studies of the transition from sail to steam have emphasized freight traffic and examined why it took more than 50 years—from the 1850s into the early twentieth century—for steam to replace sail on every ocean route. In contrast, this article examines the transition in the movement of one group of passengers—immigrants—who traveled on one route, Europe to New York City.4
The classic article concerning the transition for freight traffic is Harley, “Shift.” One exception that has examined immigration by steamship, though not explicitly the transition, is Keeling, “Transportation Revolution.”
Estimates are presented showing it took about 15 years—from when the steamer became fully competitive—for the transition from sail to steam to occur in the New York immigrant trade. Yet this finding contrasts with the accepted transition model, which suggests the changeover should occur on a specific route in only a few years. After examining factors that could lead to a long transition, the article argues the major factor operating on the New York route was that the steamer became competitive near the start of a time period when immigrant volume underwent a substantial, and unexpected, increase. Thus, it took a fairly long period of time for sufficient passenger steamships to be built to handle the increased volume. Overall, this article contributes to our knowledge concerning the economics of technology diffusion.
THE CHANGE TO STEAM FOR ARRIVALS AT NEW YORK CITY
The estimates of the arrivals of passengers and steamships at New
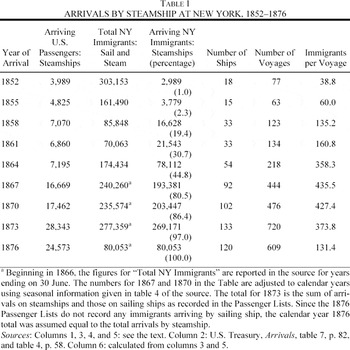
York City provided in Table 1 are based on the original U.S. source of immigration data, the Passenger Lists. Beginning in 1820 ship captains were required to file with U.S. port authorities a list of all passengers on an arriving ship. These Passenger Lists serve as the basis for the official U.S. estimates of immigration for the nineteenth century and have been used by numerous researchers. For this article, the entire set of original Passenger Lists (which are available on microfilm) was examined for every third year beginning in 1852 and continuing through 1876. For each of these nine years, all arrivals of steamships from Europe were included in the data set.5
I distinguished steamships from sailing ships in two ways. First, the original entry on the Passenger List usually indicated if the ship was a steamship. Second, Bonsor, North Atlantic Seaway, provides a virtually complete list of steamships that sailed on the north Atlantic, and the discussions in Bowen, Century, were helpful.
In total, the data set contains information on 2,864 voyages. For each steamship in each year, information on ownership from N. R. P. Bonsor was included along with data gathered from the lists: the ship name, the date of arrival, the port of embarkation, the total number of passengers, the number of U.S. citizens, and the number of deaths.
6 Bonsor, North Atlantic Seaway.
The latter three figures were determined by manual count if necessary, though usually each Passenger List provided, at a minimum, a numbered list of passengers. The number of immigrants (actually, total European passengers) was then determined by subtracting from the total those passengers who were U.S. citizens and those non-U.S. citizens who died on the voyage.
7 This procedure is a little different from the one used by the original compilers. For many of the later years, the Passenger Lists often note whether alien passengers had previously been in the United States. Another issue is that some individuals arrived on ships that only carried cabin passengers. I believe that in neither case were the passengers counted as immigrants. Yet the lists for early years did not include information on previous visits and, even for later years, not all lists contained this information. It is also unclear how ships with only cabin passengers were treated in earlier years. For consistency, therefore, all the total “immigration” figures used in this article include all passengers who were not U.S. citizens. This issue is one reason I chose not to use the official figures that could be constructed from the reports of the Commissioners of Emigration of the State of New York. Neither of these issues is large quantitatively, so the estimates in Table 1 are generally consistent with those given in the official sources. A second reason for not using the official reports is that they are primarily summaries and, as such, do not contain information on each individual voyage. Official estimates are available for 1856 through 1860 in Commissioners of Emigration, Annual Reports, table D(D), p. 343; and for 1863 onward in the yearly reports, for example, Commissioners of Emigration, Emigration Report.
The number of passengers and the percentage of passengers arriving at New York by steamship increased consistently throughout the period from 1852 to 1873.8
A number of estimates for a specific year or period of years exist in the literature and are mostly consistent with those given in Table 1. Keeling, “Transportation Revolution,” p. 63, says that 40 percent of immigrants arrived on steamers in 1863, the first year for which “comprehensive figures … are available.” Other previous estimates: Albion, Rise, p. 349, gives figures that suggest 3.5 percent arrived by steam in 1856 and 31.5 percent in 1860; Jones, American Immigration, p. 158, provides the same figure for 1856; Guillet, Great Migration, p. 239, says that 45 percent of British emigrants traveled in steamships in 1863 and 81 percent in 1866; Hyde, Cunard, pp. 91–92, says that 95 percent of all emigrants traveled by steamship in 1870; and Coleman, Going to America, says that 75 percent came by steam in 1865.
This result holds in spite of sizable fluctuations in total immigration. Due to the potato famine, the total volume of immigration was huge in the early 1850s but only about 1 percent of the immigrants arrived by steamship. Total immigration fell abruptly in 1855 primarily due to the outbreak of nativism and fell further due to the economic downturn in 1857 and the outbreak of the Civil War.
9 See Thomas, Migration; and Cohn, “Nativism.”
An increase in the number of steamship voyages and passengers per ship, however, led to almost 20 percent of the immigrants arriving by steam in 1858 and 31 percent in 1861. Beginning in 1863 the volume of immigration again began to increase and generally continued to do so until the depression that began in 1873. In spite of large increases in volume, both the total and the percentage arriving by steamship continued to increase monotonically, with 97 percent of the total arriving by steam in 1873. The total volume fell substantially after 1873 and by 1876 the transition to steam had been completed. Thus, the figures in
Table 1 generally confirm the accepted view. Before the Civil War, most immigrants arrived by sail, whereas after the Civil War, most arrived by steam. Yet these figures also emphasize that the transition was in effect before the Civil War, even though the final triumph of the steamship occurred mainly during the eight years following its end.
Because each steamship company serviced only one route, one might suppose the transition should be analyzed by port of embarkation. This article, however, views the change from sail to steam on the passenger trade to New York as one transition, regardless of the European port of embarkation. This approach is taken for both theoretical and practical reasons. The major ports of embarkation for ships arriving at New York with passengers were Liverpool, Le Havre, Bremen, Hamburg, and Glasgow. Some ships left from other ports, but the percentage of passengers from ports other than these five was usually well under 10 percent of the total arrivals by steamship. Though Bremen, Hamburg, and Glasgow were serviced by only one steamship company in most years, Liverpool and Le Havre saw substantial competition. Even the former ports had to attract passengers, however, and potential passengers could often choose to leave from Le Havre rather than Bremen or Hamburg, or from Liverpool instead of Glasgow, or board a sailing ship rather than a steamer. Small steamers also took passengers between Great Britain and the Continent, and many steamships leaving from the Continent boarded passengers in ports in southern England. Thus, all the companies would have faced similar fluctuations in demand over time, and thus the timing of the transition would have been similar across ports of embarkation. The practical reason for grouping together all ports of embarkation is that official sources do not provide data on the total number of passengers arriving from each port. Thus, the transition has to be analyzed in its entirety, though as noted, good reasons exist for approaching the analysis in this manner.
The figures in Table 1 indicate that the increased numbers arriving by steamship were primarily due to an increase in the number and size of steamships, not in the frequency of use for each ship. Fewer than 20 steamships carried immigrants in 1852 and each voyage arrived with an average of about 40 immigrants (and 52 U.S. citizens). In 1861 there were 33 steamships, and each voyage arrived with an average of 161 immigrants (and 51 U.S. citizens). By 1870 the 102 steamships arriving at New York carried an average of 427 immigrants each (and only 37 U.S. citizens). Yet the average number of voyages per ship did not change very much. The 18 ships arriving in 1852 averaged 4.3 voyages each during the year, whereas the 102 ships arriving in 1870 averaged only 4.7 voyages each. In 1852, for example, the most trips—nine—were made by the Africa, and the Arctic made eight. In 1870 the City of Brooklyn arrived 11 times, whereas a number of other ships completed nine or ten voyages during the year. In sum, between 1852 and 1870, the total number of immigrants arriving by steam increased 68 times. This increase was due to an 11-times increase in average immigrants per ship, a 5.7-times increase in the number of ships, and only a 9-percent increase in the number of trips per ship. Though the number of ships increased fairly consistently over the entire period of the transition, the increase in passenger load occurred mainly before 1864.
When immigration began to fall during 1873 as a result of the outbreak of a depression, the shipping companies reacted in a manner analogous to their response to the increase, mainly absorbing the decrease through a decline in the number of immigrants per ship. The depression began during the last half of 1873 and immediately reduced the number of interested immigrants. The steamship companies could not, however, quickly lower the number of their already-scheduled voyages. In fact, the average number of voyages per ship was actually higher in 1873 than in 1870. Furthermore, a large increase in steamship building and the entry of a number of new steamship companies occurred during the early 1870s, as will be detailed later. All these factors caused the average number of immigrants per ship to be lower in 1873 than in 1870. By 1876 the manner in which the steamship companies reacted to the depression was clear. The total number of immigrants fell by 70 percent between 1873 and 1876. Yet the number of ships was cut by only 10 percent and the number of voyages per ship by only 6 percent. The number of passengers per voyage, however, fell from 374 to 131, a decline of 65 percent. In an industry with a large fixed cost—building or buying the ships—the reaction of the shipping companies to the decrease in demand is understandable. Better to keep the ships in operation, which incurred a fairly low variable cost that could presumably be covered even with the lowered demand, than to take ships out of commission.10
Harley, “Aspects,” p. 172, estimates that one-third of the total costs were fixed capital costs associated with the ship. Though his estimate is for freighters, it provides a general idea how much the steamship lines could cut fares in the short run and continue to operate.
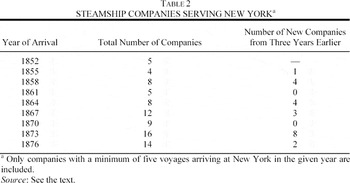
The increase in the number of ships serving New York was partly due to an increase in the number of steamship companies (Table 2). The biggest percentage jumps in the number of immigrants carried by steamships occurred between 1855 and 1858 (over four times more in 1858) and between 1861 and 1867 (3.6 times more in 1864 and another 2.5 times increase by 1867). Both are periods of substantial entry into the industry. During the former period, the Hamburg-American and North German Lloyd lines were established, the first major companies to operate primarily from the European continent, and the Inman Line switched its operations from Philadelphia to New York.11
For information concerning various steamship companies, see Adams, Ocean Steamers; Fry, History; Maginnis, Atlantic Ferry; and Bonsor, North Atlantic Seaway.
Between 1861 and 1867, the Anchor Line, the CGT Line, and the Guion Line entered the marketplace along with a number of smaller, less-famous firms. The time period between 1870 and 1873 had the biggest absolute increase in immigrant volume and also saw a large number of new firms enter the market, though about half of these did not continue to service the New York route in 1876. The 1873 to 1876 time period adds a slight addendum to the preceding argument concerning the reaction to the large fall in immigration. The reaction involved some decline in the number of firms serving New York but not in proportion to the fall in volume. As previously indicated, most ships (and companies) kept sailing, although with many fewer passengers.
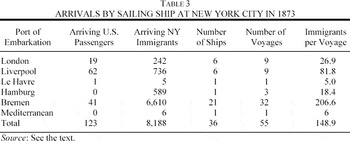
Besides information on the arrivals of steamships, data were also acquired on the arrivals of the remaining sailing ships in 1873 (Table 3). Though sailing ships with passengers were still leaving from a number of major European ports, large-scale immigration by sail was taking place predominantly from Bremen, which accounted for over 80 percent of all individuals arriving by sailing ship. As shown in Table 3, only ships leaving from Bremen carried large numbers of passengers in 1873.12
The results here differ from those given by Guillet, Great Migration, p. 239, who implies that poor Irish were the final users of the sailing ship.
Twenty-six of the 55 voyages carried over 100 passengers, and 21 of these left from Bremen.
13 Two left from Hamburg and three from Liverpool.
Furthermore, some sailing ships were still engaged in a regular New York passenger trade. Six of the ships made three voyages during 1873 and another seven ships each made two voyages. With the onset of depression in late 1873, however, the use of sailing ships for immigrant travel quickly ended. The fall in demand meant the existing steamships had a large amount of excess capacity. With the steamship companies anxious to keep their capital-intensive ships in operation, the few remaining sailing vessels did not stand a chance.
14 The exact date of the last sailing ship voyage with emigrants is not clear, though it probably was not later than 1874. Moltmann, “Steamship Transport,” p. 311, says that the last sailing ship from Hamburg was in 1873. According to the Passenger Lists, the Prinz Albert arrived from Hamburg on 1 October 1873, with 35 passengers in its third voyage of the year, though the last sailing ship to arrive in 1873 (on 26 December) was the Marco Polo from Bremen. Pettersen, “From Sail to Steam,” p. 126, says that the last sailing ship from Norway left in 1874. Gould, “Ocean Passenger Travel,” p. 126, also says that 1874 saw the last clipper ships with immigrants. On the other hand, Taylor, Distant Magnet, p. 131, is clearly incorrect when he says that “(t)he years 1865 to 1870 saw the end of sail in the north Atlantic emigrant trade.”
In summary, the transition from sail to steam occurred over a fairly long period of time. In 1867, for example, almost 47,000 immigrants still arrived at New York City on sailing ships, as many as in 1861 and not many fewer than the 69,000 figure in 1858 (calculated from Table 1). The transition that had started as soon as the early or mid-1850s was not finished by 1867; in fact, it did not completely finish until 1874 or so. During the transition, specifically in the middle of the Civil War, total immigrant volume began to rise. Because it proved difficult to increase the average number of voyages or, after 1864, the average passenger load, the increased demand had to be met by increasing the number of steamships operating between Europe and the United States. The information in Tables 1 and 2 makes it clear the existing companies expanded their fleets and new companies entered the market. Even so, as late as the early 1870s, over 10 percent of the immigrants arriving at New York City came on sailing ships.
THE TRANSITION MODEL
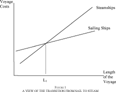
The transition from sail to steam during the nineteenth century has usually been analyzed from the perspective of relative costs. Steam replaced sail on a particular route when steam became less costly. The general framework used is shown in Figure 1, which relates the variable costs of the voyage to the length of the voyage for both steamships and sailing ships.15
For simplicity, the cost lines in Figure 1 are shown as linear. A more technical approach is given in Harley, “Shift.”
Voyage costs increased more rapidly with distance for steamships than for sailing ships. The basic argument is that steamships required the use of coal and all the coal for a particular voyage had to be carried by the ship. As Britain was the main source of coal in the world at the time, ships leaving Europe could not reduce the amount of coal they needed to carry by refueling along their route.
16 Harley, “Ocean Freight Rates,” p. 861, indicates that, during the nineteenth century, coal comprised 20 percent and wages 10 percent of the cost of operating a steamer, while wages comprised 27 percent of the cost of operating a sailing ship. Other costs had fairly similar shares between the two modes. At times, coal was hauled from Britain and deposited at various sites so other steamships could refuel on their way. Because doing this would increase the cost of the coal at the refueling stations, the main argument is not affected.
Thus, the length of the voyage on which steamships could be competitive depended on technological considerations involving the use of coal. As will be detailed shortly, early steamships used huge amounts of coal, making them competitive only on shorter routes. In
Figure 1, steamships would be used on voyages less than L
1 in length and sailing ships would continue to be used on longer voyages. Over time, as steam engines became more efficient in their use of coal, the voyage cost line for steamships shifted downward, L
1 moved to the right, and steamships replaced sailing ships on longer and longer routes.
VIEW OF THE TRANSITION FROM SAIL TO STEAM
This article concerns the transition on a specific route rather than the overall transition. The model is designed to explain why the steamer did not replace the sailing ship all at once on every route. For a specific route, a straightforward application of the model implies that the transition should occur fairly quickly. After all, why should the sailing ship continue to be used at all on any specific route once it became higher cost? In fact, the transition did occur fairly rapidly on some other routes. For example, the change to steam for passenger travel to Quebec occurred within a few years. As Basil Greenhill says: “In 1858, 138 sailing ships carried 9,104 steerage passengers from Britain to Quebec and 16 steamers carried 1,912. In 1860, 37 steamers carried 6,932 passengers, 20 sailing ships carried 904.”17
Greenhill, Great Migration, p. 8. Cowan, British Emigration, p. 170, provides slightly larger figures for all immigrants to Quebec, including those from the Continent. Though the length is not completely clear from her discussion, the transition to steam for all Quebec arrivals may have taken a few years longer.
Thus, in a two-year period, the steamship went from carrying 17 percent to 88 percent of the Quebec passengers. Evidence for routes regarding freight also provides cases of quick transition. Knick Harley supplies examples of the change to steam in British trade with India and China after the opening of the Suez Canal in 1869 drastically shortened travel distances to these countries. For India, the percentage of tonnage moving by steamer increased from 28 percent in 1870 to 65 percent in 1873; for China, it went from 14 percent in 1869 to 70 percent by 1873.
18 Harley, “Shift,” pp. 221–24. The transition was less complete on the freight routes. The reason is that different cargoes were carried by different ships. For some products, speed was important and these items would be shipped by steamer. Seasonal agricultural products, however, would have to be stored between harvest and consumption; the hold of a sailing ship operated as a warehouse and the slower voyage yielded lower total costs.
The evidence for these other routes is consistent with the transition model and emphasizes the slowness of the transition on the New York route.
19 Previous discussions of the length of the transition on the Europe to New York route are few. Most researchers view the transition as occurring gradually, though do not provide much additional analysis. See Albion, Rise, p. 43; Taylor, Distant Magnet, p. 131; Rowland, Steam at Sea, p. 81; Tyler, Steam; and Hyde, Cunard. In contrast, the most explicit view concerning the length of the transition has been expressed by Keeling, “Transportation Revolution,” p. 40, who says that “… the steamers' takeover of the migrant trade from sailing ships was not gradual.” Guillet, Great Migration, p. 239, also suggests the transition was fairly rapid.
In order to get an accurate idea of how long it took for the transition on the New York route to occur, one must first determine when the costs of steam travel for passengers fell below those for sailing-ship travel. A wide variety of evidence suggests the change occurred during the late 1850s. One piece of evidence, just discussed, was that the transition occurred on the route to Quebec at this time, a voyage of similar length as that to New York. A second reason for viewing the late 1850s as the key period is that earlier steamship companies, especially the Cunard and Collins Line, were able to stay in business only because of government subsidies to carry the mail.20
Their passengers were limited to those individuals willing to pay very high prices. In 1856, however, the Hamburg-American Line began steamer service; in 1857, Inman switched his line from Philadelphia to New York; and, in 1858, the North German Lloyd Line entered the market. The Inman transfer was particularly important because Inman was a company that carried passengers in steerage, and this innovation was rapidly copied by the other new entrants. The success of companies relying on steerage passengers, and with little or no mail subsidy, implies that the costs of passenger transportation by steamship had declined. The need to increase revenues even led the conservative Cunard Line to enter the steerage business in 1860.
21 As steerage became more prominent, steamships were able to increase the average number of passengers per voyage from 60 in 1855 to 358 in 1864 (
Table 1).
Improvements in the sailing ship into the middle 1850s also kept the steamship at bay until the late 1850s. Gerald Graham points to advances in oceanography, such as improved knowledge concerning seasonal winds and currents, and declines in the prices for hemp, sail, and cloth during the 1850s that kept sailing ships competitive.22
Graham, “Ascendancy,” pp. 81–82.
Wages earned by shipbuilders in the Canadian Maritimes also declined in the 1850s as builders of sailing ships struggled to remain competitive.
23 Harley, “Aspects,” p. 173.
In addition, the sailing packets grew in size into the middle 1850s in response to the increased demand by immigrants and the growing competition of the steamship.
24 Guillet, Great Migration, pp. 233–35; Albion, Rise, pp. 43–44; and Hyde, Cunard, p. 60.
Investment in sailing ships was also encouraged by their longer life. A sailing ship could expect to continue to operate for 20 years whereas a steamship built during the 1850s or 1860s had an expected life of only eight years.
25 Albion, Rise, pp. 48–49; and Keeling, “Transportation Revolution,” p. 45.
One final item needs to be mentioned. Beginning in about 1845, attempts were made to equip sailing ships with a small auxiliary steam engine. The idea was to reduce passage times by avoiding holdups during periods of calm, but to also have a ship that did not need to carry as much coal as a regular steamship of the period. Yet the continued advances in the steamship, discussed in what follows, led to the abandonment of these experiments around 1855 and, in fact, almost no new sailing packets were built after 1855.
26 Thornton, British Shipping, pp. 51–53; Guillet, Great Migration, pp. 235–38; Coleman, Going to America, p. 242; and Hutchins, American Maritime Industries, p. 320.
All in all, the various developments led contemporary authorities to express doubt about the superiority of steam on the north Atlantic route throughout the early and middle 1850s.
27 Tyler, Steam, p. 178; and Smith, Short History, p. 125.
By the end of the 1850s, however, most doubts had disappeared. In fact, in 1860 the Hamburg-American Line sold their remaining sailing ships in order to buy more steamships.
28 Technological improvements in steam transportation also point to the late 1850s as being the key period.29
The material in the next two paragraphs is based on Gardiner, Advent of Steam; Slaven, “Shipbuilding Industry,” pp. 110–14; Thornton, British Shipping, pp. 14, 65; Tyler, Steam, pp. 118–28, 197, 253–56; Rowland, Steam at Sea, pp. 86–101, 119–22; Smith, Short History, pp. 75–80, 96, 135–38, 168–81; and Headrick, Tentacles, pp. 23–25. It is also useful to note that coordination problems developed with each improvement, as one change did not always work with the configuration of the rest of the steamship. See Graham, “Ascendancy,” p. 75.
As noted, the inefficiency of the steam engine in its use of coal was the major cost factor keeping steam from being more competitive. During the 1820s steamships with low pressure single-expansion engines operated with a normal boiler pressure of 3–5 pounds per square inch and consumed 10 pounds of coal per horsepower per hour. Various improvements in efficiency lowered fuel use somewhat over time as did better training of stokers so they did not use more coal than was needed or blow off too much steam through the safety valve. By the 1850s coal consumption by the single-expansion engine had been reduced to about 4 pounds per hour with a further decrease to 3.5 pounds by the mid-1860s. Improvements continued over time with the development of the compound engine, which reduced fuel needs by another 30–40 percent.
30 The compound engine reduced fuel use by using a small (second) cylinder to increase the pressure of the steam before it passed into the main chamber.
In fact, as early as 1862, compound engines had achieved a boiler pressure of 60 pounds with a fuel consumption as low as 2–2.25 pounds or less per hour. Yet the new type engine was still basically in the experimental stage during the 1860s and all the mechanical problems were only worked out near the end of the decade. The compound engine did not come into general use until about 1870, well after the steamship had taken most of the passenger traffic from the sailing ship. Similarly, the surface condenser, which also reduced fuel consumption, was not generally adopted until the 1860s.
31 The surface condenser collected the used steam and reduced it back to (hot) water.
Thus, the compound engine and the surface condenser appear to have simply reinforced the steamship's already-existing advantage on the north Atlantic route.
The total costs of a steamship were also reduced by the adoption of iron hulls and screw technology, both of which began to be applied to steamships in the early 1840s. The first transatlantic iron steamship was the City of Glasgow, built in 1850 and put into operation by the Inman Line, which only used iron ships for carrying passengers. One problem that had to be overcome was the fouling of the hulls, which interfered with the compass. Thus, it was only in the late 1850s that iron came fully into favor and allowed the building of larger ships.32
Davies, “Development,” p. 179.
For example, the Cunard Line did not order its first iron steamship (the
Persia) until 1855. The use of iron hulls is a second factor, along with the widespread adoption of steerage, that gave rise to the large increase in the average passenger load that occurred between 1855 and 1864.
33 During the 1850s iron was used mainly for the construction of passenger steamships or small experimental war vessels. In the United Kingdom, total new iron construction on all types of shipping outweighed new wood construction in shipping for the first time during the 1860s. See Graham, “Ascendancy,” pp. 75–77; and Davies, “Development,” p. 200.
The screw was potentially much more efficient than the paddlewheel since the entire screw was submerged compared to only part of the paddlewheel. But early problems existed in where to place the screw in the ship, in whether to power it from the steam engine directly or indirectly, in keeping water from seeping in where the screw exited the ship, and in devising a system to lift the screw out of the water when the captain wanted to use the sails. Though the British Admiralty committed to the screw in 1845, most of the problems were not fixed until the middle or the late 1850s; for example, the leakage problem was solved in 1855. Again, one of the first adopters of the screw was the Inman Line and the
City of Glasgow was one of the first ships to use them. Most other companies rapidly adopted the screw for new ships. The conservative Cunard Line continued with paddle steamers longer than others. Even Cunard, however, adopted screw technology after 1861.
34 The location of the screw proved to be a problem during the 1860s as its placement proved noisy for cabin passengers whose rooms and saloons were traditionally in the stern of the ship. It was not until 1870 that the White Star Line rearranged the interior of the ship to reduce the noise and motion arising from the operation of the screw. See Gould, “Ocean Passenger Travel,” pp. 126–27.
Perhaps the best evidence that the steamship had become competitive with the sailing ship comes from limited information concerning relative fares. It is generally thought that travel by sailing ship from Liverpool cost £3 10s to £5 after 1830, with no long-run trend, and fares from the German ports may have risen during the 1840s and 1850s.35
Gould, “European,” p. 612; and Page, “Transportation,” pp. 737-38.
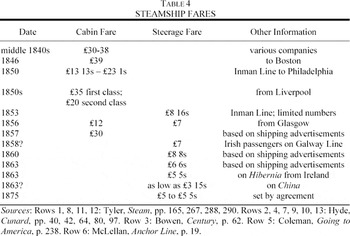
Consistent fare information is not available for travel by steamship until the 1880s, though a variety of partial estimates exist for the time period of interest and these are shown in
Table 4. Until late in the 1850s, with a few exceptions, one could travel on steamships only as a cabin passenger, and the rates reflect this fact. Thus, as is well known, the steamship first took high-rate passenger and freight travel away from the sailing ship.
36 The technological improvements in the steamship, the entry of new lines, and the adoption of steerage led to a large fall in the relative price of steamship travel by the late 1850s.
37 Yet the information in
Table 4 indicates that steamship fares generally remained above or at the upper end of fares on sailing ships. Edwin Guillet summarizes this information by saying that passage by steam generally cost one-third more than passage by sail even after the changes discussed.
38 Guillet, Great Migration, p. 239. Thomas, Migration, p. 96, cites figures for 1863 of £4 15s for steamships and £2 17s for sailing ships, but provides no reference for them.
Even later in the 1860s, the money fare via steam never fell to that via sail. Over the entire time period, however, individuals continued to switch to steam because the quicker, safer, and more comfortable voyage reduced an immigrant's total opportunity costs.
39 Gould, “European,” pp. 613–14.
Thus, by the late 1850s, steam fares had apparently declined enough to make the steamship competitive with the sailing ship for passenger travel. Yet the sailing ship did not disappear as a means of passenger travel on the north Atlantic until 1874, about 15 years after the steamship became the low-cost means of travel.
EXPLANATIONS FOR A SLOW TRANSITION
The previous sections suggest the transition from sail to steam in the Europe to New York route was more gradual than a straightforward application of the transition model would suggest. This section examines four factors that could lead to a slow transition on a specific route. First, immigrants had a choice in whether to spend the extra money to obtain a faster voyage. Essentially, poorer immigrants might have chosen the sailing ship because of an income constraint, sacrificing time to save money. Clearly, this sort of mechanism was at work during the early 1850s when only those passengers who could afford the high cost of traveling in a cabin took a steamship. In addition, a tradeoff of time for money may explain why Bremen, through which poor immigrants from central and eastern Europe left at this time, was the main holdout for sailing ships in 1873.40
This explanation is speculative. It is supported by the fact that, during 1873, almost 10,500 immigrants entered the United States from the presumably poorer areas of Poland and Austria-Hungary. Between 1870 and 1872 only 4,500-6,000 arrived yearly from these areas. See U.S. Department of the Census, Historical Statistics, Series C94 and C95.
Yet this line of reasoning would better explain why steam did not completely win out between Europe and New York than why it was adopted slowly. Though the introduction of steerage on steamships made them more affordable to immigrants, without increases in immigrant incomes or continual reductions in the relative price of steam travel, the likely outcome would have been a situation where sail indefinitely kept some portion of the north Atlantic immigrant market. It is unlikely that immigrant incomes went up very much over the course of the decade of the 1860s nor was the innovation of receiving prepaid tickets from relatives in America new. Information is not extant concerning the relative prices of steam and sail throughout the 1860s, though as shown in
Table 4, it is believed there was little trend.
41 Also, see Gould, “European,” pp. 611–13.
Moreover, in 1867/68 the major steamship companies agreed to set minimum passenger fares.
42 Hyde, Cunard, p. 94. The original agreement was between Cunard and Inman, though Hyde says the other Liverpool-based lines also joined. The effectiveness of the agreement is not clear, because the lines based on the Continent did not belong and many of their ships boarded passengers in ports in southern England.
Both factors make it unlikely the relative price of steam travel declined sufficiently to allow poorer immigrants, who could not afford to travel by steam early in the decade, to suddenly be able to afford the steamship.
The second possibility is subject to the same general criticism. Theoretically, continued technological improvements in steam power could have reduced the relative price of steam transportation, making the steamship a progressively better value. Yet we have just seen that the relative price of steam travel did not fall during the 1860s, so this explanation cannot be true.
A third factor that could possibly explain the slow switch to steam travel is that sailing ships lowered prices in response to the decreased demand for their service. After all, simple economics suggests a sailing-ship firm would continue to carry passengers as long as the fares covered the variable costs of operation. Though data on fares are not available, it is unlikely this situation prevailed for the passenger trade on the north Atlantic. The sailing ships were not stuck carrying passengers on the north Atlantic. Owners could have moved their sailing ships to more profitable routes had sailing ship fares declined.43
Large-scale immigration had begun to Australia in 1852 as a result of the discovery of gold in that country, so ships could have been moved to that route. See Thornton, British Shipping, p. 42. In addition, during the Civil War, many sailing ships were sold to the North's government for use in the war effort. See Dyos and Aldcroft, British Transport, p. 237; and Jones, American Immigration, p. 158.
In addition, sailing ships could have been converted to carrying freight more easily than could steamships, which used a large amount of their space on fixed cabin accommodations. Given the ability to switch sailing ships to other routes or purposes, and given the minimum fares set for steamship travel in the late 1860s, it is probable the sailing ships continuing in the north Atlantic passenger trade remained profitable.
The fourth explanation views the transition as an example of capital replacement that did not occur quickly. The steamship was an expensive piece of capital, one that took six to nine months to build.44
Slaven, “Shipbuilding Industry,” p. 120.
The actual decision to construct a new passenger steamship was made by a steamship company that contracted with a shipyard. The company's decision process would be influenced by a number of factors: expected future passenger demand, current and expected technological changes, plans by current competitors, expected entry, and any agreements with competitors.
45 The direction of influence is not always simple to determine. For example, the literature is filled with situations where new ships built by one firm incorporated improvements for passengers, and caused other firms to order new ships in response. A similar argument applies to the entry of new firms.
In particular, at about the time the steamer became the preferred carrier, the volume of immigration began to increase rapidly. The increase was sufficiently large that much of it would not have been anticipated by existing and potential steamship companies. The result was that steamship construction was consistently too small to completely catch up with the continually growing immigration. Sailing ships then kept the residual traffic, with their share falling over time as the number of steamships increased and slowly caught up to the larger volume of immigration.
46 Hyde, Cunard, p. 63, discussing the 1860s, says that during the peak season from April to September “… there was usually insufficient tonnage and overcrowding in years of high emigration.” In 1873, of the 26 sailing ships that carried over 100 passengers, 18 (69 percent) arrived between April and August. Only 45 percent of the steamships arrived during the same period. It is not clear, however, whether sailing ships arrived during these months due to the availability of passengers or whether sailing conditions were better during this part of the year.
The emphasis on immigrant traffic disregards any important role for revenues the steamship companies could earn from operating sailing ships or from carrying freight on passenger ships. Each item was of limited importance. In particular, each steamship company carrying passengers to New York did so only on steamships, that is, by the 1860s, the remaining sailing ships were operated by separate companies.47
The one exception was the heavily-subsidized French CGT Line, which continued to operate sailing ships until 1873.
As to freight, though some was carried by every steamship, the ships were designed with passengers in mind, and passenger traffic was the main source of revenue from the use of these ships.
48 Hyde, Cunard, p. 82, in discussing the determinants of profits before 1874 says the “passenger trade had become the definitive element” in determining the profitability of the steamship companies.
In addition, once built for passenger traffic, a steamship was used exclusively for this purpose. Though a few steamships were eventually taken out of passenger traffic and converted to carrying freight, no back-and-forth conversions occurred. In other words, most steamships carrying freight were explicitly built for that purpose. Thus, the demand for passenger steamships can be analyzed independently of the demand for freighters.
ANALYZING THE RATE OF STEAMSHIP CONSTRUCTION
To the best of my knowledge, no estimates exist on the total tonnage or new construction of passenger steamships. Though data are available on the total steamship tonnage in Great Britain, these figures are not useful for our purposes because, as just noted, passenger-carrying steamships were different from freight-carrying steamships.49
Harley, “Aspects,” p. 171; and Palmer, “British Shipping Industry,” pp. 92–93, provide estimates for total shipbuilding and ship registration in Britain.
In addition, Graham indicates the Lloyd's Register list is far from complete.
50 Graham, “Ascendancy,” p. 74.
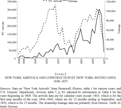
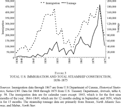
Consequently, new estimates of passenger steamship tonnage have been constructed for each year from 1838 through 1875. These are shown in
Figures 2 and
3. The new estimates are based on published sources that specify the year each steamship was built, the name of the ship, and its gross tonnage.
51 Bonsor, North Atlantic Seaway, has comprehensive lists of ships used by each company carrying passengers on the north Atlantic, along with their date of launching and tonnage. Maber, North Star, provides similar lists for companies serving Asia and Australia. I have not found any sources for companies serving South America, so my estimates may be missing some ships here. The estimates do not include the 18,915 ton Great Eastern constructed in 1858, which was considered a “freak” at the time, never carried many passengers, and seems to have had no subsequent effect on the construction of steamships. See Thornton, British Shipping, p. 55.
The estimates in
Figure 2 include steamships built only for those companies that carried passengers to New York at some point between 1852 and 1876. Those in
Figure 3 include steamships built by any company. Though certain companies specialized in the New York trade, all companies bought and sold steamers and reallocated them among their routes. Thus, both sets of estimates are useful.
Figure 2 includes data on 394 passenger-carrying steamships.
Figure 3 contains data on 539.
NEW YORK ARRIVALS AND CONSTRUCTION BY NEW YORK–BOUND LINES 1838–1875
TOTAL U.S. IMMIGRATION AND TOTAL STEAMSHIP CONSTRUCTION 1838–1875
The determinants of steamship construction can be analyzed using regression analysis.52
The approach taken here is consistent with the discussions in Slaven, “Shipbuilding Industry,” pp. 114–16; and Brattne, “Importance,” pp. 197–99.
The dependent variable is yearly tonnage of new steamship construction, either for all companies or just for those sailing to New York. Given that immigration to the United States was the largest source of demand for passenger travel, one would expect the building of passenger-carrying steamships would be closely related to lagged immigration to the United States. It is not clear, however, whether the relationship would be to total immigration or to immigration to New York City. Thus,
Figure 2 includes data on arrivals at New York, and
Figure 3 includes data on total immigration. Both figures show there is an apparent direct relationship between construction and immigration. In addition, to account for the hypothesis that the steamship was the preferred mode of travel and not enough steamships existed, the regression includes a time trend variable. Finally, a dummy variable is added, taking on a value of one beginning in 1870. This variable represents the opening of the Suez Canal and the introduction of the compound engine, both of which spurred steamship construction.
53 Graham, “Ascendancy,” p. 83. No attempt is made to include the 1867 agreement to set minimum fares among the Liverpool-based companies. As noted earlier, the effectiveness of the agreement is not clear.
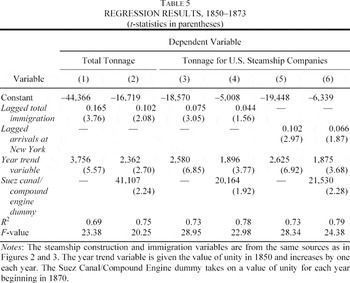
As few passengers traveled by steamship before 1850 and essentially all did after 1873, the regressions were run over the period from 1850 through 1873. The OLS results of the various specifications are presented in
Table 5.
54 The results do not measurably change if the number of new steamships is used instead of total new tonnage, if total immigration is not lagged, if a dummy variable is included for the Civil War years, if the regression is continued through 1875, or if a year-squared term is included. The use of OLS is supported by tests of Granger causality (not reported), which indicate the lagged immigration variable causes tonnage but tonnage does not cause lagged immigration, and tests of cointegration (also not reported) that reveal no problems.
All independent variables are statistically significant in all of the regressions, though in a few cases only marginally.
Suppose the volume of immigration to the United States (or New York) increased by 100,000 during one year of the 1860s. The response to this increase shows up in the coefficients on immigrant volume and the yearly trend. To calculate the maximum construction response during the 1860s, use the values in column 2, which includes all steamship companies and accounts for the discontinuity arising from the adoption of the compound engine and the opening of the Suez Canal. Then, the increase of 100,000 in the total volume of immigration would increase new steamship tonnage the next year by about 12,562 tons. Given the average steamship tonnage of 2350 tons, the total response would equal 5.35 new steamships. Yet this response is fairly small. If each newly-built ship made an average of six voyages per year and carried 600 passengers per voyage, then the new steamships would increase capacity by only about 19,250, or only about one-fifth of the increase in demand.55
The figures used for the average number of voyages and the average passenger load are both greater than the averages calculated from Table 1, but then the ships being discussed were new. For example, 31 passenger steamships were built in 1865 and 19 (61 percent) of them carried passengers to New York in 1867. The maximum load averaged 586 passengers, the average load was 449 passengers, and each ship averaged 5.3 voyages.
Indeed, the response would be even smaller because all the new steamships would not necessarily be used to carry passengers on the north Atlantic.
56 Redoing the calculation using the coefficients in columns 4 and 6, which provide the results only for those companies traveling to New York, yields a response of 2.7 and 3.6 new steamships, respectively.
Of course, additional ships already in existence could be switched to the north Atlantic from other routes, either by companies already serving the route or by the entry of new companies. The information in
Table 2 indicates that new companies did enter the market fairly regularly. Even so, the relatively small construction response would make it difficult for steamship companies to meet passenger demand in a period of rapidly rising immigration.
If the passenger demand for steamship travel unexpectedly increased and outstripped the supply of steamships through 1873, then profits should have been above the normal level for steamship companies. Some evidence exists to support this implication. Hyde presents figures indicating the companies made large accounting profits through 1873.57
A more obvious implication of above normal profits is that entry should occur. The information in
Table 2 shows that the number of companies carrying passengers to New York increased from five in 1861 to 16 in 1873. Though many of the new firms serviced the Liverpool route, all of the major routes saw attempts by new firms to enter the market.
58 For example, the New York and Bremen Line provided competition for the North German Lloyd Line in 1867, the Adler Line provided competition for the Hamburg-American Line in 1873, and the Union Maritime Line and the National Line provided competition for the CGT Line from Le Havre. See Bonsor, North Atlantic Seaway.
Then, when demand and passenger revenues fell after 1873, accounting profits plummeted and some of the firms exited, further emphasizing the key role of passenger demand in explaining the demand for steamships.
The reasons for the small construction response are not completely clear. Because the volume of construction jumped so dramatically in the early 1870s, the problem does not appear to be a lack of production facilities. Instead, the likely causes were uncertainty concerning both future technological changes and the volume of immigration. As noted earlier, experiments were continuing on the compound engine during the 1860s. Given the strong likelihood the engine would be perfected in the not-too-distant future, companies may have wanted to avoid building too many steamships that might soon become obsolete, or at least require extensive renovations. Certainly, the huge increase that occurred in the volume of construction in the early 1870s once the compound engine had been perfected, shown by the large positive coefficient on the Suez Canal/Compound Engine dummy variable in the regression results, suggests this factor may have been important. In addition, given the history of immigration to that time, it is not hard to see why immigrant volume would be consistently underestimated. Before the potato famine, the volume of immigration was fairly small, averaging less than 80,000 each year between 1836 and 1845. Average yearly volume jumped to over 300,000 during the 1846 to 1854 period, but the large increase was clearly due to the potato famine, an event not likely to be repeated. Between 1855 and the outbreak of the Civil War, average yearly volume declined to 175,000. The companies anticipated that volume would pick up after the Civil War, but to what extent would not be clear. In fact, average volume between 1865 and 1868 was 290,000, virtually as large as during the potato famine, but with no upward trend. Then, between 1869 and 1873, average volume jumped again and almost reached 400,000, surpassing the 1854 record. Determining the number of steamships to build in an environment of fairly rapid technological change and unpredictable immigrant volume must have been extraordinarily difficult. In such a situation, it is not surprising the steamship companies took a conservative approach.
Even given the conservative approach of the steamship companies to building new steamships, the transition would have been completed much more rapidly in the absence of the rising volume of immigration. In 1861, only 21,000 of the 70,000 passengers arrived on steamships (Table 1). In 1864, 78,000 passengers arrived on steamships, more than the total arrivals in 1861. In 1864, total arrivals at New York City equaled 174,000; in 1867, 193,000 arrived on steamships, more than both the total in 1864 and the average yearly number that arrived between 1855 and 1860. In turn, if we consider the transition on the Quebec route, the volume of immigration was small and little change occurred in its size into the early 1860s. In this case, when a number of new steamship firms began carrying passengers to Quebec during the late 1850s, the transition could be, and was, very rapid. Given a stable demand, these steamship companies could more easily determine the number of steamships needed to service all, or at least the vast majority, of passengers on the Quebec route.59
To the best of my knowledge, only one steamship company, the Anchor Line, carried passengers directly to both New York and Quebec during the late 1850s and early 1860s, though some of the New York companies carried passengers to Halifax. A number of other steamship lines served Quebec but not the New York market.
In all cases, the steamship did not replace the sailing ship because immigrant volume was increasing. Rather, the steamship replaced the sailing ship because of passenger demand for a safer, quicker trip. On the Quebec route, without much change in volume, the transition was rapid. On the New York route, with volume continually increasing through 1873, the transition was much slower.
EXPLAINING THE TRANSITION TO NEW YORK
Previous work on the transition from sail to steam on the north Atlantic during the nineteenth century has emphasized technological change, a supply factor, as key. In fact, every previous discussion is similar. The introduction of iron hulls and screw technology, improvements in fuel use in single-expansion engines, and the adoption of steerage allowed steamships to begin to take the passenger trade away from sailing ships by the late 1850s. The 1860s saw the introduction of the surface condenser and, at the end of the decade, the compound engine. The length of the transition is usually ignored or viewed as occurring quickly. The discussion in this article certainly does not disagree with the importance of technological change to understanding the transition to steam in the north Atlantic. However, an analysis of technological change is not sufficient to completely understand the transition which, in other circumstances, could have occurred much more quickly. A complete understanding requires information on the demand for passenger travel, the factors that influenced the construction of steamships, and the rate at which the new technology was adopted. Only by including these factors can we understand why it took 15 years for the steamship to completely replace the sailing ship as a carrier of passengers on the north Atlantic.
The findings of this article, especially the information in Table 1 and Figure 3, can be used to more fully explain developments in the market for passenger travel on the north Atlantic between the 1850s and the 1870s. Passenger steamship construction rose rapidly during the first half of the 1850s in response to the huge volume of immigration at the time. A peak in construction is apparent in 1855, the year in which the volume of immigration underwent a precipitous decline. Even though the steamship was just becoming fully competitive with the sailing ship about 1858, the decline in total immigrant volume meant that 20 percent of the immigrants arrived at New York City that year on a steamship. Immigrant volume remained relatively small into the early 1860s so, by 1864, the continued slow pace of steamship construction, the growing use of steerage, and the general adoption of iron hulls had led to a sizable increase in the total number of passengers arriving by steamship. Yet the construction response was not large enough to drive sailing ships out of the north Atlantic market. Even though the percentage of passengers traveling by steam had risen to 45 percent in 1864 from 31 percent in 1861, the actual number of passengers arriving on sailing ships was much larger in 1864 (96,000) than in either 1858 (69,000) or 1861 (48,000).
Immigrant volume began to increase during 1863, perhaps in anticipation of the end of the Civil War and the resumption of more normal economic conditions. Steamship construction also picked up, peaking in 1865, and a number of new firms entered the market. Immigrant volume continued to increase into 1866, then stagnated through 1868, and started to rise again only in 1869. As a consequence, in 1867, 47,000 passengers, nearly as many as in 1861, still arrived on sailing ships. The slow growth in immigrant volume during the late 1860s, and the pending adoption of the compound engine, contributed to a decline in the rate of new steamship construction at this time.60
Slaven, “Shipbuilding Industry,” p. 116.
The continued construction of some new steamships, however, along with the stagnation in immigrant volume, caused the number of immigrants arriving by sailing ship to decline to 32,000 in 1870. In addition, the sailing ships built in the early 1850s to carry passengers to North America may have been reaching the end of their useful life. Immigrant volume began to increase once again in 1869, the year the Suez Canal opened and the compound engine began to be used. These factors led to a boom in the construction of new steamships and the entry of a large number of new steamship firms into the north Atlantic market. By 1873, 97 percent of passengers arrived at New York on a steamship with total sailing ship passengers falling to 8,000.
The result of the interplay between rising immigrant volume, technological changes, and a small construction response was that the transition to steam on the north Atlantic passenger route took almost 15 years to complete. The large increase in passenger volume occurred after the steamship became truly competitive with the sailing ship in the late 1850s and meant that a large number of new steamers needed to be built. With uncertainty over how much immigrant volume would continue to rise, when the compound engine would be perfected, and how many new firms would enter the market, the demand for new steamships lagged passenger demand. Consequently, it took a large number of years for steamship capacity to catch-up with the generally growing volume of immigration. Only when the volume again began to rise in the early 1870s was a sufficient number of ships built to handle the entire demand. At just about the time when enough steamships had been constructed, however, the market collapsed with the depression of 1873.61
Ibid., pp. 114–16. In discussing the capital-goods shipbuilding industry, Slaven uses similar reasoning when he says it exhibited “… a tendency to over-capacity in shipbuilding.” He specifically discusses the overbuilding during the 1868–1874 period. When immigrant volume again increased, the number of new ships did not increase at the same rate. Keeling, “Transportation Revolution,” pp. 52–53, makes the point that steamship lines concentrated on building more ships up to 1873 and bigger ships after that date.
The situation rapidly changed from a lack of passenger steamship capacity to one of substantial excess capacity. The result was a huge decline in the construction of new steamships, the abandonment of the New York market by some steamship companies (or their bankruptcy), and the end of the sailing ship as a carrier of passengers on the north Atlantic.
The author wishes to thank Drew Keeling, Ralph Shlomowitz, Simone Wegge, Melissa Thomasson, and two anonymous referees for helpful comments, and Andreea Andronescu, Madhu Sundararaman, and David Sackett for research assistance. The data were collected with the assistance of a College of Arts and Sciences Small Grant from Illinois State University, for which the author expresses his appreciation. An earlier version of this paper was given at the 2004 American Economic Association meetings.