

The two most popular surgical techniques for providing controlled pulmonary blood flow in children with single ventricles are the modified Blalock–Taussig shunt and the right ventricle-to-pulmonary artery shunt. By eliminating the obligatory diastolic run-off in the Blalock–Taussig shunt, the main proposed benefits of the right ventricle-to-pulmonary artery shunt are better coronary and systemic perfusion, more balanced and predictable pulmonary-to-systemic flow ratio, and decreased ventricular volume loading.Reference Ohye, Sleeper and Mahony 1 , Reference Sano, Ishino and Kawada 2
Although there have been numerous studies investigating the clinical and echocardiographic differences between the two shunts, little is known about the differences in ventricular mechanics between the shunt types.Reference Ohye, Sleeper and Mahony 1 , Reference Frommelt, Sheridan and Mussatto 3 , Reference Hughes, Shekerdemian, Brizard and Penny 4 The advent of smaller conductance catheters approved for use in humans now allows for examination of ventricular mechanics using pressure–volume loop analysis in this population. This report highlights the feasibility of using conductance catheters to help elucidate potential differences between shunt types using pressure–volume loop analysis.
Case presentations with pressure–volume loop analysis
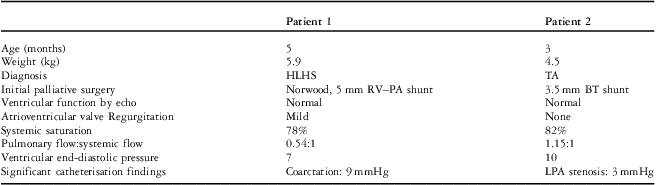
The protocol was approved by the institutional review board and informed consent obtained for the patients. Pressure–volume loops were obtained through direct measurement using microconductance catheters (CD Leycom, Zoetermeer, The Netherlands) in two patients presenting for catheterisation before stage 2 palliation. Patient information and haemodynamic data of each patient are summarised in Table 1.
Patient information and catheterisation findings.
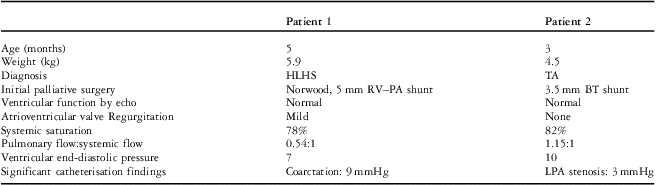
BT = Blalock–Taussig; HLHS = hypoplastic left heart syndrome; LPA = left pulmonary artery; RV–PA = right ventricle to pulmonary artery; TA = tricuspid atresia
Pressure–volume loop analysis was performed off-line using specialised software (ConductNT® version 3.18; CD Leycom). Conductance volumes were calibrated using end-systolic and end-diastolic volumes obtained from magnetic resonance imaging performed on the same day. Patients were transported directly from the catheterisation laboratory to the magnetic resonance suite and were cared for by the same anaesthesia team. The anaesthestic regimen was not standardised for each patient.
In each patient, a 4-Fr microconductance catheter was placed in the systemic ventricle using an antegrade approach through the atrioventricular valve. A 5-Fr transseptal sheath was used to aid in stable positioning of the catheter. Pressure–volume loops were obtained under general anaesthesia during expiratory hold for 10 s. Careful attention was given to place the catheter in centre of the ventricle and eliminate volume segments outside of the ventricle. Pressure–volume loop indices were calculated using averaged single-beat methods to avoid the risks involved with load alteration.
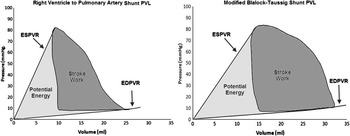
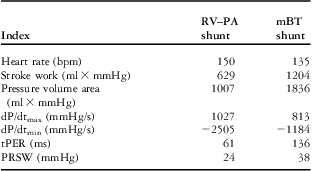
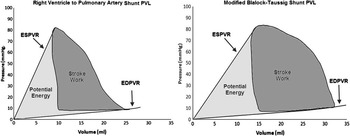
Averaged pressure–volume loops for the two patients are displayed in Figure 1 with the calculated indices displayed in Table 2. Most noticeably, the patient with right ventricle-to-pulmonary artery shunt had an absence of isovolumic contraction, whereas the patient with the modified Blalock–Taussig shunt displayed preservation of the isovolumic contraction phase. This difference is most apparent in indices related to pressure–volume loop area such as ventricular stroke work and pressure–volume area, both of which were lower in the patient with a right ventricle-to-pulmonary artery shunt.
Pressure–volume loops of the right ventricle-to-pulmonary artery shunt (left) and modified Blalock–Taussig Shunt (right). End-Systolic Pressure–Volume Relationship (ESPVR) and End-Diastolic Pressure–Volume Relationship (EDPVR) lines are marked. Stroke work (shaded blue) and potential energy (shaded red) are illustrated. Potential energy + stroke work = pressure–volume area. PVL = pressure–volume loops.
Comparison of pressure–volume loop indices.
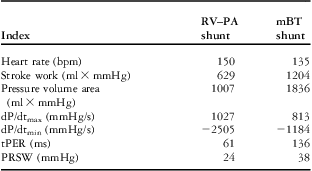
dP/dt = change in pressure over change in time; mBT = modified Blalock–Taussig; PRSW = preload-recruitable stroke work; RV–PA = right ventricle to pulmonary artery; tPER = time to peak ejection rate
Discussion
To the best of our knowledge, this report is the first to utilise conductance catheter-derived pressure–volume loops in single-ventricle patients to examine differences in ventricular mechanics between these two shunt types. This report demonstrates that quality pressure–volume loop data can be obtained. The use of an antegrade approach is feasible in this population. The use of an antegrade approach for conductance catheter placement into the single ventricle can cause iatrogenic atrioventricular valve regurgitation and confound results. However, in our two patients no haemodynamic deterioration was observed following catheter placement. Echocardiogram performed at the end of the catheterisation showed no change in atrioventricular valve regurgitation from baseline.
These pressure–volume loops suggest an important potential dissimilarity in the isovolumic contraction phase of these two patients, illustrated by the differing shape of the two pressure–volume loops. The patient with right ventricle-to-pulmonary artery shunt had a near elimination of isovolumic contraction leading to a decrease in stroke work. In the patient with the modified Blalock–Taussig shunt, the isovolumic phase was well preserved. Pressure:volume area, which is defined as the sum of stroke work and potential energy, can be represented on the pressure–volume loop diagram as the area enclosed within the end-systolic pressure–volume line, end-diastolic pressure–volume line, and the isovolumic contraction line. In the patient with right ventricle-to-pulmonary artery shunt, the end-systolic pressure–volume relationship slope was higher, which decreased the potential energy. Therefore, the patient with right ventricle-to-pulmonary artery shunt had a lower pressure:volume area owing to a decrease in both stroke work and potential energy. Pressure:volume area and stroke work positively correlate with myocardial oxygen demand.Reference Takaoka, Takeuchi, Odake and Yokoyama 5 This suggests that, at the same heart rate, the myocardial oxygen consumption is lower in the single ventricle with a right ventricle-to-pulmonary artery shunt compared with a modified Blalock–Taussig shunt.
These findings are in agreement with recent reports using computational modelling to simulate flow dynamics of the right ventricle-to-pulmonary artery shunt. These reports found that forward flow in the right ventricle-to-pulmonary artery shunt occupied 80% of the cardiac cycle, and that stroke work was lower in the right ventricle-to-pulmonary artery shunt, supporting the lack of isovolumic contraction phase.Reference Mroczek, Malota, Wojcik, Nawrat and Skalski 6 , Reference Bove, Migliavacca and de Leval 7
It is important to consider some possible limitations to these observations. A very important consideration is the underlying diagnoses of these two patients – hypoplastic left heart versus tricuspid atresia. The difference in ventricular dominance complicates comparisons as ventricular dominance may affect contractility and myocardial function. However, a previous study of biventricular circulation demonstrated that the pressure–volume loops of morphologic right ventricles become very similar to that of a morphologic left ventricle when exposed to systemic pressures.Reference Redington, Rigby, Shinebourne and Oldershaw 8
In conclusion, this novel case comparison demonstrates the feasibility of using conductance catheters to investigate ventricular mechanics in infants with single ventricles and highlights a potentially important difference in ventricular mechanics between the two shunt types. Further investigations to confirm these findings in a larger cohort are warranted.
Acknowledgements
Modeling of Congenital Hearts Alliance (MOCHA) Investigators: Andrew Taylor, MD, Alessandro Giardini, MD, Sachin Khambadkone, MD, Silvia Schievano, PhD, Marc de Leval, MD, and T.-Y. Hsia, MD (University College London, UK); Edward Bove, MD and Adam Dorfman, MD (University of Michigan, USA); G. Hamilton Baker, MD and Anthony Hlavacek (Medical University of South Carolina, USA); Francesco Migliavacca, PhD, Giancarlo Pennati, PhD, and Gabriele Dubini, PhD (Politecnico di Milano, Italy); Alison Marsden, PhD (University of California, San Diego, USA); Irene Vignon-Clementel, PhD (National Institute of Research in Informatics and Automation, France); Jeff Feinstein, MD (Stanford University, USA); and Richard Figliola, PhD and John McGregor, PhD (Clemson University, USA). A Trans-Atlantic Network of Excellence supported by Foundation Leducq.
Disclosure: This research was supported by a grant from the Leducq foundation.