





1. Introduction
The radio sky is full of sources powered by non-thermal emission. Many of these radio sources exhibit steep radio spectra, i.e. their emission is brighter at lower frequencies. Compact radio sources with steep spectra, although rare, are particularly interesting as they serve as promising candidates for exotic objects like radio pulsars and High-redshift Radio Galaxies (HzRGs).
The frequency dependence of flux density,  $S_\nu$, of the steep spectrum radio sources is often characterised as a power-law in the form of
 $S_\nu \propto \nu^\alpha$, where
 $\nu$ is the frequency and the power-law spectral index
 $\alpha$ characterises the steepness of the spectrum. Pulsars are known for their notable steep spectra with a mean spectral index of
 $-1.4\pm1.0$ at a population level (Bates et al. Reference Bates, Lorimer and Verbiest2013), but a large fraction of radio pulsars exhibit ultra-steep spectra (with
 $\alpha\lt -2.0$; Manchester et al. Reference Manchester, Hobbs, Teoh and Hobbs2005). HzRGs also exhibit steep spectra, in fact, some of the HzRGs have been identified based on their exceptionally steep spectra (e.g. De Breuck et al. Reference De Breuck, van Breugel, Röttgering and Miley2000). In large-scale radio surveys with moderate angular resolutions, both pulsars and HzRGs are observed as continuum point sources. While pulsars are truly point sources, HzRGs can often be resolved at arcsec or higher angular resolution.
Searching through the alternative data release of TIFR-GMRT Sky Survey (TGSS; Intema et al. Reference Intema, Jagannathan, Mooley and Frail2017), Frail et al. (Reference Frail, Jagannathan, Mooley and Intema2016) detected continuum radio emission from nearly 300 known pulsars at 147.5 MHz. Similar earlier searches using the NRAO VLA Sky Survey (NVSS; Condon et al. Reference Condon1998) had also yielded many known pulsars (Kaplan et al. Reference Kaplan, Condon, Arzoumanian and Cordes1998, 79 pulsars, and Han & Tian Reference Han and Tian1999, 97 pulsars). While majority of the pulsars have been discovered by systematic, untargeted searches for pulsations, image-based targeted search for pulsars in steep spectrum and compact sources can be particularly effective. The first millisecond pulsar (MSP), PSR B1937+21, was discovered because of the unusually high steepness of its counterpart continuum source 4C 21.53W (Backer et al. Reference Backer, Kulkarni, Heiles, Davis and Goss1982). Early discovery of several other pulsars was also aided and motivated by their steep spectra in the continuum images (see, e.g. Lyne et al. Reference Lyne, Brinklow, Middleditch, Kulkarni and Backer1987; Hamilton et al. Reference Hamilton, Helfand and Becker1985; Navarro et al. Reference Navarro, de Bruyn, Frail, Kulkarni and Lyne1995; Marthi et al. Reference Marthi, Chengalur, Gupta, Dewangan and Bhattacharya2011). More recently, a search for radio pulsations from 16 promising candidates, selected based on their steep radio spectra, compactness and coincident sky positions with Fermi-LAT unassociated sources, yielded 6 millisecond pulsars and one normal pulsar (Frail et al. Reference Frail2017). Likewise, in a search for pulsars in candidates identified as compact, steep sources within a small region near the Galactic centre, Bhakta et al. (Reference Bhakta2017) discovered a Galactic disc recycled pulsar with a spectral index of  $-2.55$.
There have also been large scale image-based targeted searches without much success. Searches for pulsations by Maan et al. (Reference Maan, Bassa, van Leeuwen, Krishnakumar and Joshi2018) in 44 steep-spectrum pulsar candidates selected from a spectral index catalogue of 80% of the sky (Tiwari Reference Tiwari2019; de Gasperin et al. Reference de Gasperin, Intema and Frail2018) did not yield any new pulsars. This search was partly motivated by de Gasperin et al. (Reference de Gasperin, Intema and Frail2018) confirmation of an intriguing excess of the compact sources with steep spectra ( $\alpha\lt -1.5$) in the Galactic plane, first indicated by De Breuck et al. (Reference De Breuck, van Breugel, Röttgering and Miley2000). Several possibilities for the reasons behind no pulsation being detected were discussed, the primary suspect being anomalously high scatter broadening of pulse profiles. Hyman et al. (Reference Hyman2021) found two very steep (
 $\alpha\sim-3$), compact sources near the central bulge of the Galaxy. Higher frequency searches did not yield any pulsations, but these are hypothesised to be most likely scatter-broadened pulsars. Other examples include Damico et al. (Reference Damico, Manchester, Durdin and Erickson1985) and Kaplan et al. (Reference Kaplan, Cordes, Condon and Djorgovski2000), with the latter suggesting that most of their compact sources with steep-spectra were HzRGs.
Despite the inherent difficulties in confirming the pulsars in steep-spectrum sources (scatter-broadening could dominate at lower frequencies and sources would be intrinsically faint at higher frequencies), it is likely that large fractions of sources in the above discussed sample were affected by the limitations of then available surveys. For example, TGSS and NVSS have relatively coarse angular resolutions of 25″ and 45″, respectively. Moreover, poor quality of NVSS images in the Galactic plane might result in incorrect estimates of the spectral indices. Image-based targeted search for pulsations could be made more worthwhile by including the new imaging surveys with enhanced sensitivities and better angular resolutions, as and when those become available, in the initial sample selection itself. With this motivation, in this work, we use the Rapid ASKAP Continuum Survey (RACS) to probe intermediate frequencies (RACS-low and RACS-mid at 887 and 1 367 MHz, respectively; McConnell et al. Reference McConnell, Hale, Lenc and Murphy2020; Hale et al. Reference Hale2021; Duchesne et al. Reference Duchesne2023, Reference Duchesne2024), between that of TGSS and NVSS, and characterise and classify 171 steep-spectrum candidates. We determined the flux densities and compactness for these sources using data from the higher-resolution ASKAP images at both frequencies, whenever available, and characterise their spectra using the measurements and upper limits from TGSS and NVSS. Our characterisation and classification of these sources can help in finding new radio pulsars, as well as potentially discovering other exotic Galactic sources that might mimic pulsars in their compactness and steep spectra. Beyond galactic populations, our characterisation and classification methods are also well suited for investigating extragalactic sources like AGNs and HzRGs. A fraction of our candidates might also be compact steep spectrum (CSS) radio galaxies – powerful young radio galaxies with projected linear sizes  $\lesssim$20 kpc and spectral indices
 $\alpha \lesssim -0.5$ (O’Dea & Saikia Reference O’Dea and Saikia2021). While early identified samples were bright (
 $\gt$10 Jy at 178 MHz), modern wide-area deep radio surveys have found CSS sources at mJy brightnesses and below. Herzog et al. (Reference Herzog2016) demonstrated that CSS candidates, such as those within the population of infrared-faint radio sources (IFRS), typically exhibit 1.4 GHz flux densities of a few to a few tens of mJy. Gordon et al. (Reference Gordon2023) found that CSS galaxies with enhanced star formation are particularly compact, with linear sizes consistently smaller than 10 kpc.
The rest of the paper is structured as follows. The sample selection is described in Section 2, followed by the methodology in Section 3. Results are presented in Section 4, followed by discussion and concluding remarks in Sections 5 and 6.
2. Sample selection
The spectral index catalogue provided by de Gasperin et al. (Reference de Gasperin, Intema and Frail2018) includes all the sources that are visible in the TGSS and/or NVSS at 147 MHz and 1.4 GHz, respectively. It extends to  $-40$ degrees declination, accounting for 80 per cent of the sky. We use this catalogue to select two samples of compact sources with steep-spectra, one in the Galactic plane and another covering the rest of the sky covered by TGSS and NVSS. For our sample selection, we use all the sources which are detected only in TGSS and not in NVSS, and hence, there is only an upper limit on the spectral indices of these sources in the catalogue. Out of the total 1 396 515 entries in the catalogue, the above sources constitute less than 1 per cent (6 386 sources).
Not all the sources with upper limits on their spectral indices are compact. To evaluate their compactness, we define the compactness parameter, r, as the ratio of the peak flux density to the total flux density. We use the compactness parameter and the spectral index limits to make our sample selections. Our Galactic plane (GP) sample consists of all the point-like sources (i.e. the sources are modelled well with a single Gaussian component) within the Galactic latitude range of  $-4^\circ$ to
 $+4^\circ$, and which have spectral indices steeper than
 $-1.5$ and compactness parameter more than 0.9. For a few sources, the compactness parameter was below the above threshold of 0.9. However, the large uncertainty in their compactness parameter implied that the threshold 0.9 was well within 1
 $\sigma$ of the actual measurement. We also included these sources in the selected sample. This led to the selection of a total of 119 sources. A cross-match with the ATNF pulsar catalogue using psrcat
Footnote
a
(Manchester et al. Reference Manchester, Hobbs, Teoh and Hobbs2005) suggested 12 of these sources to be known pulsars and these were discarded. The GP sample consists of the remaining 107 sources.
The selection of the sources for the off-Galactic plane (oGP) sample followed similar criteria as the GP sample, with two important differences: the sources were outside the Galactic latitude range of  $-4^\circ$ to
 $+4^\circ$, and a spectral index threshold of
 $-1.8$ was used instead. The primary selection resulted in 126 sources, out of which 11 were found to be known pulsars and discarded. The oGP sample consists of the remaining 115 sources.
Majority of the radio pulsars, one of our primary targets, lie in the Galactic plane. The excess of compact sources with steep-spectra in the Galactic plane, confirmed by de Gasperin et al. (Reference de Gasperin, Intema and Frail2018), further suggest those sources to have the the highest potential to reveal unknown pulsar populations or other exotic Galactic objects. Moreover, given the relatively poor quality of NVSS images in the Galactic plane, the actual uncertainties on the spectral indices in the Galactic plane are expected to be larger. To account for this, and to probe a larger population of Galactic sources, we have used a slightly flatter spectral index threshold of  $-1.5$ in our GP sample (than the one used in our oGP sample,
 $-1.8$). We also note that for a fixed spectral index threshold, the fraction of extra-galactic sources contributing to the sample is expected to be much larger in the off-Galactic plane. Our slightly steeper spectral index threshold of
 $-1.8$ for the oGP sample helps in minimising this fraction. Overall, we hope that the above division of the sample in the GP and oGP aids in focusing more on the Galactic sources that are compact and have steep spectra.
Our GP sample includes 29 sources with spectral indices steeper than  $-1.8$. These 29 sources, together with the 115 sources in the oGP sample, form an all-sky sample of 144 compact sources with spectral indices steeper than
 $-1.8$. However, as the ASKAP survey covers the sky till
 $+41^\circ$ declination, our study effectively focuses on those sources lying in the overlap of the two regions, i.e. from
 $-40^\circ$ till
 $+41^\circ$ declination. These are a total of 171 in number, of which 78 belong to GP, including the ones not steeper than
 $-1.8$ and the remaining 93 are from the oGP sample.
3. Methodology
RACS complements and fills a critical niche between the meter-wavelength TGSS and the gigahertz NVSS surveys. Apart from having a substantial sky coverage overlap with the two surveys, RACS observations also offer much better angular resolution and sensitivity (McConnell et al. Reference McConnell, Hale, Lenc and Murphy2020). The higher angular resolution greatly helps in distinguishing truly compact sources from the ones which appear compact at a lower resolution but are resolved at higher-resolution observations, as illustrated in Figure 1. The data availability at 1 367 MHz further provides an opportunity to study source morphology at a frequency very close to the NVSS frequency, where all the sources in our sample are supposed to be very faint.
Example of a few sources which appear compact in TGSS (left), but are clearly resolved in RACS-low (centre) and RACS-mid(right). The synthesised beam associated with each image is shown as a white ellipse at the lower left corner.

First, RACS-low and RACS-mid images containing the sky positions of the individual sources from the above described two samples were identified and downloaded from the CSIRO ASKAP Science Data Archive (CASDA,Footnote
b
Chapman et al. Reference Chapman, Lorente, Shortridge and Wayth2017) Individual images were then searched for any continuum emission using the Common Astronomy Software Applications (CASA) package (CASA Team et al. Reference Team2022).Footnote
c
For a few of the sources, we also used images from the ASKAP Variables and Slow Transients (VAST, Murphy et al. Reference Murphy2013) and Survey and Monitoring of ASKAP’s RFI environment and Trends (SMART, Lourenço et al. Reference Lourenço2024). We also note that for some of the sources, images from multiple pointings were available. In such cases, the images where the sources were present closer to the pointing centres and visibly less contaminated from artefacts (e.g. the deconvolution artefacts) were selected for any further analysis. After visual confirmation of the presence of any emission, whenever the emission appeared to be point-like, a circular region was selected around the source and Gaussian fitting was performed with CASA. A source is classified as ‘detected’ if its peak flux density (hereafter, pfd) obtained from fitting is more than 4 times the uncertainty on pfd, as the pfd uncertainty was found to be a good representative of the local rms background ( $\sigma_l$). The Gaussian fit also provides parameters such as the integrated flux density (ifd), associated uncertainties, more accurate sky position of the source, and source size in terms of the semi-major/minor axes of the fit. We found the compactness, r, and the associated uncertainty,
 $\sigma_r$, for all the point-like sources using the flux density values obtained from RACS-mid images at 1 367 MHz:
 $ r= ({pfd}_{1\,367\, \text{MHz}})/({ifd}_{1\,367\, \text{MHz}})$. We classified sources with
 $r + \sigma_r \gt 0.9$ as compact, and non-compact otherwise. Further details on the distribution of compactness values and its role in source classification are presented in the following sections.
For the sources that were not detected at 1 367 MHz, their 887 MHz flux densities were used instead to estimate their compactness. Sources that appeared resolved or extended (i.e. compared to the beam-size) in either of the RACS-low or RACS-mid surveys were classified as resolved. For these sources, the FITS images at both frequencies were first convolved to the approximate TGSS resolution of  $25^{\prime\prime} \times 25^{\prime\prime}$, and then the Gaussian fitting procedure was carried out. Similarly, for the sources that were not detected at either of the frequencies, the images were convolved to the approximate TGSS resolution. Whenever this resulted in the detection of a source, it was classified as diffuse and the fitting procedure was carried out on the smoothed image. When a source was detected at 887 MHz but a detection with (pfd
 $\gt 4 *\textit{pfd}_{error}$) at the 1 367 MHz became possible only after smoothening, it was also classified as diffuse. In such cases, we also convolved and smoothened its 887 MHz counterpart and noted the new flux densities instead. No compactness measurement was performed for resolved and diffuse classified sources. Sources without detection at either of the frequencies are referred to as ‘non-detection’ or ND.
We estimated the new spectral index,  $\alpha$, for each of the sources by a linear fit to the three flux density measurements (from TGSS, RACS-low and RACS-mid) in log-log scale. We have used the pfd values for the compact sources, while ifd values were for the non-compact, resolved or diffuse sources. Apart from the measurement uncertainties in the flux densities (pfd or ifd) obtained from the Gaussian fitting, we also accounted for the systematic uncertainties (by adding them in quadrature) while estimating the spectral indices. The systematic error in RACS-low for a flux density measurement S is given by McConnell et al. (Reference McConnell, Hale, Lenc and Murphy2020)
 $ \Delta S= 0.5\,\text{mJy} + 0.07S$. The systematic errors in RACS-mid flux density measurements depend on the relative position of the source within the phased-array feed (PAF) footprint. While for most of the sources the systematic errors are
 $\approx$6%, sources close to the edges of the PAF footprint have up to 14% systematic flux density errors (Duchesne et al. Reference Duchesne2023). We thus assume a
 $\approx$10% error on the flux density of all sources as systematic uncertainties, which is a conservative assumption in most cases, for the purpose of estimating
 $\alpha$. We note that assuming a 14% systematic uncertainty does not significantly alter our results. The goodness of fit is estimated in terms of the reduced chi-square,
 $\chi_r^2$. Figure 2 shows an example of a compact source (082712-311201) detected in all the three surveys and the corresponding fit for estimating
 $\alpha$. For the sources that were not detected at 1 367 MHz (RACS-mid), the spectral index is computed simply using the two flux density measurements from TGSS and RACS-low, at 147 and 887 MHz, respectively. For the sources classified as ND, we used the upper limits on the flux densities as three times the rms (i.e.
 $3\sigma_l$) value estimated around the source positions at the respective frequencies. Then, we computed the two-point spectral index limits (147–887 MHz and 147–1 367 MHz) using these upper limits and chose the steeper of the two estimates. The spectral index limit thus obtained is an upper limit on
 $\alpha$, i.e.
 $\alpha$ could be lower than this limit, and hence, the intrinsic spectrum could be much steeper.
Radio images of the source 082712-311201 from the oGP sample, as seen in the TGSS (a), RACS-low (b) and RACS-mid (c) surveys. A power-law fit to the corresponding flux densities is shown in panel (d).

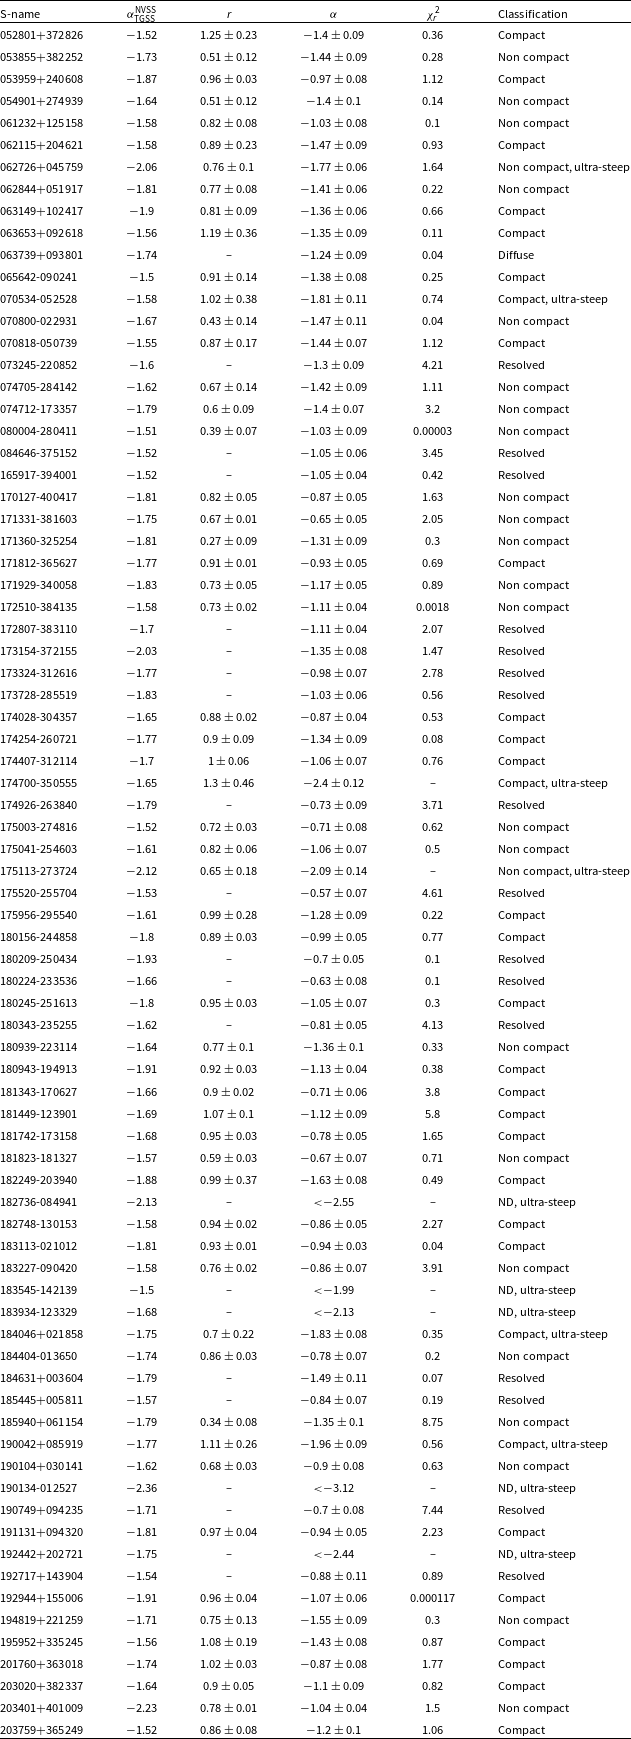
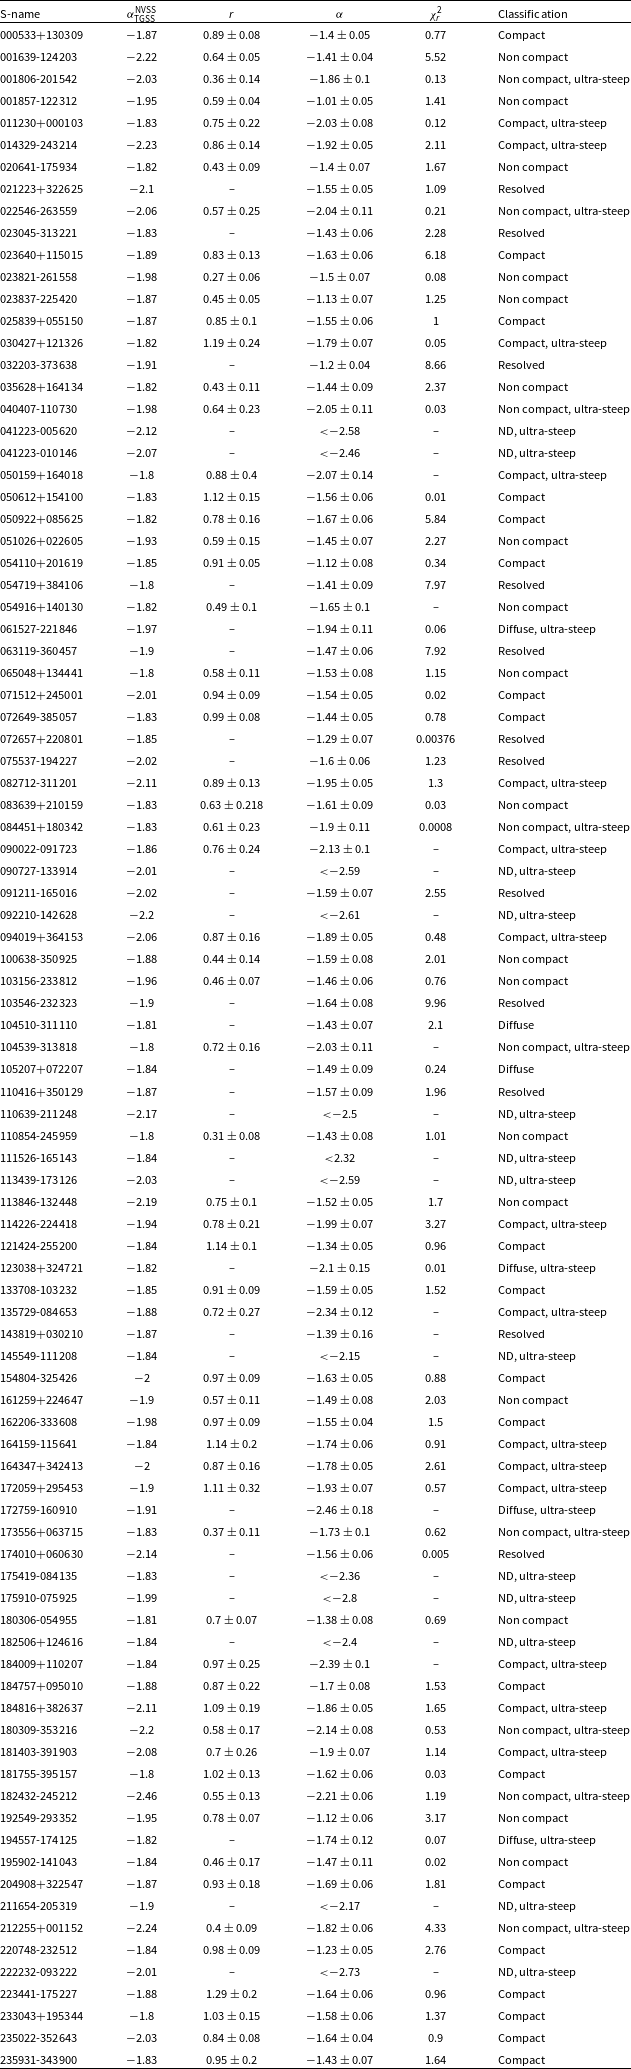
Tables A1 and A2 summarise the estimated spectral indices, compactnesses (r), their associated uncertainties, reduced chi-square ( $\chi_{r}^2$) of the fits, and the final classifications of the sources, for the GP and oGP samples. Also shown are the original upper limits (
 $\alpha^{\mathrm{NVSS}}_{\mathrm{TGSS}}$) on the spectral indices (from de Gasperin et al. Reference de Gasperin, Intema and Frail2018) obtained using TGSS flux densities and NVSS upper limits. Finally we classify sources as ultra-steep when they have
 $\alpha\leq-1.8$. Candidates for radio pulsars and HzRGs, for example, can be identified as compact sources with steep (
 $-1.8 \lt \alpha \lt -1.5$) or ultra-steep spectra.
4. Results
In total, 143 sources have detections at all the three frequencies, and their  $\alpha$ values have been estimated using power-law fits. For 118 of these, the power-law fits are reasonably good, with
 $\chi_r^2$ value below 2.5. A total of 18 sources remain undetected at either of the RACS frequencies, and thus classified as ND. This generally imposes an ultra-steep spectral index limit for these sources, using
 $3\sigma_l$ limits on their flux densities, as described in Section 3. The remaining 10 sources are detected at 887 MHz but could not be detected at 1 367 MHz even after smoothing the images to match with the TGSS angular resolution. We directly computed the 147–887 MHz two-point
 $\alpha$ for these 10 sources.
Of the 78 sources in the GP sample, we find 31 to be compact. Likewise, of the 93 sources in the oGP sample, 35 were classified as compact. Across the full sample of 171 sources, 46 have their  $\alpha \leq -1.8$. A further 6 are within a sigma error of
 $-1.8$. These 52 sources, irrespective of their morphological classification, are classified as ultra-steep. All of the 18 ND sources, unsurprisingly, are classified as ultra-steep, with half of them having spectral indices steeper than
 $-2.5$. The remaining 34 ultra-steep sources comprise 19 compact sources (with 4 in the Galactic plane), 11 non-compact and 4 diffuse sources. Similarly, we note that 19 of 48 sources with steep spectra (
 $\lt -1.8 \lt \alpha \lt -1.5$) are found to be compact, including 4 sources having
 $\alpha$ consistent with
 $-1.5$ within one sigma error.
For completeness, we mention that our total sample of 171 sources is classified into 29 resolved, 6 diffuse, 52 non-compact sources, along with the 18 ND and 66 compact. The ND and diffuse classifications exhibit the steepest spectral indices, with averages of  $-2.47$ and
 $-1.82$, respectively. The 10 sources detected at 887 MHz, but not-detected at 1 367 MHz, include 5 classified as compact, 3 as non-compact, 1 resolved and 1 as diffuse. Their average spectral index is
 $-2.1$. We recall that the sources in our sample are steep-spectrum sources by design. The average
 $\alpha$ for the whole sample (excluding NDs) is
 $-1.42$, with the source with the flattest spectrum having an index of
 $-0.57$. The average
 $\alpha$ in the GP sample is
 $-1.16$, flatter than that of
 $-1.66$ in the oGP sample.
5. Discussion
In the preceding sections, we have presented spectral and compactness characterisation of 171 supposedly steep spectrum sources. For compactness, we have used qualitative as well as quantitative criteria. For example, resolved sources are identified visually – if a source appears to be composed of multiple components or has a size clearly much larger than the synthesised beam, it is classified as resolved. On the other hand, the compactness parameter based classification resulted in the identification of the non-compact sources. For some sources, as shown by an example in Figure 3, the distinction between non-compact and resolved might not be trivial. But, effectively, majority of the non-compact sources will likely appear as resolved in observations with higher angular resolutions. For the resolved as well as non-compact sources, we have reported a global spectral index by using ifd (for resolved sources, after convolving the RACS images to  $25^{\prime\prime} \times 25^{\prime\prime}$ TGSS resolution). A detailed spectral index map obtained using higher angular resolution images at multiple frequencies would provide richer details. Furthermore, we probed two higher resolution wide-field surveys at 1.4 GHz (Faint Images of the Radio Sky at Twenty-cm (FIRST); Becker et al. Reference Becker, White, Helfand, Crabtree, Hanisch and Barnes1994) and 3 GHz (Very Large Array Sky Survey (VLASS); Lacy et al. Reference Lacy2020) to inspect the 66 compact sources. A search through the FIRST catalogue revealed detections of only two sources, namely 094019+364153 and 164347-342413. Both remain compact, with sizes well below 10″. A very faint emission is observed in VLASS at the location of 094019+364153, but not at a significance level to comment more on its morphological features at the survey’s 3″ resolution.
An example of a source classified as resolved owing to a tiny extension towards higher declinations.

In Figure 4, we present the estimated spectral indices against the compactness parameter, r, along with the flux densities indicated by colour, for all the sources classified as compact and non-compact. We chose the flux densities at 887 MHz as some of the sources are not detected at 1 367 MHz. While most of these spectral indices are from fits using three data points, some of them are two-point spectral indices (as indicated in Tables A1 and A2; where the flux density measurements were available only at two frequencies). For compact sources with flux density measurements at three frequencies, we did not find any measurable evidence for a curvature in the spectrum. We assume that spectra of the remaining compact sources are also well described by power laws. In case of extended sources our estimates of spectral indices are not robust as different baseline coverage for different measurements could lead to missing flux at certain frequencies.
A scatter illustration of the spectral index ( $\alpha$) vs the compactness parameter (r) for the 118 sources classified as compact and non-compact, with a vertical line at
 $r=0.9$ separating the two. The colour map shows their flux densities as observed in RACS-low. All sources with
 $r\gt 1$ are consistent with
 $r=1$ within
 $1.5\sigma$ uncertainty.

We observe a a trend between the spectral index and the flux density. In general, the brighter the source is, the flatter the spectral index – it is not entirely surprising though, as this trend would be expected unless the TGSS flux density distribution of the sources in our sample is very broad. What is more surprising is that the spectral indices for a significant number of sources is flatter than −1.5, the limit with which these sources were selected in the first place. As the previous spectral index limits came from the corresponding NVSS flux density limits, the sources with significantly flatter spectral indices might indicate towards limitations of NVSS in those directions.
To further probe the origin of the flatter spectral indices, we took a careful look at some of the sources that exhibited discrepant results. Figure 5(a) shows NVSS images centred at three sources, 175003-274816, 180943-194913, and 182748-130153, with Figure 5(b) showing the corresponding RACS-mid images. All the three sources lie in the Galactic plane. In addition to the large field of view images, Figure 5(b) also shows zoomed-in views which clearly reveal the individual sources, with peak flux densities of 26.6, 42.6, and 26.5 mJy beam $^{-1}$ at 1 367 MHz (RACS-mid). However, these sources are not visible at 1 400 MHz in the NVSS images, owing to the strong and broad artefacts in their surroundings. It is likely that the local rms estimation in such cases might not have appropriately taken into account the broad and widespread artefacts, and hence, provides rms values much smaller than the actual representative values. The above three sources had spectral index upper limits of
 $-1.52$,
 $-1.91$ and
 $-1.58$, respectively, which are significantly steeper than what we have found in this work (
 $-0.71\pm 0.08$,
 $-1.13\pm 0.04$ and
 $-0.86\pm 0.05$, respectively). We identified several other similar examples, such as the sources 183113-021012, 203401+401009, 203020+382337, etc., in our GP sample. While the RACS images also suffer from systematics in the Galactic plane, with the higher angular resolution, it is much easier to take those into account while estimating the local rms. The poor image quality in NVSS, particularly in the Galactic plane, thus requires a more careful noise analysis before the flux densities or limits therefrom could be reliably used for any scientific purpose.
Multi-resolution view of the Galactic plane at three different coordinates (columns A, B, and C), illustrating image quality improvement from NVSS (top row; a) to RACS-mid (middle row; b). The bottom row (b) presents zoomed-in views of the middle-row images, where the sources are clearly visible. These zoomed regions correspond to the areas marked by white boxes in the wide-field images in the middle and upper rows. The sky coordinates of the sources at which these images are centred at, are shown above each of the individual columns.

Figure 5. Long description
Panel A: Three wide-field images of the Galactic plane at different coordinates, labeled Column A, Column B, and Column C. Each column contains three rows of images. The top row shows NVSS images at 1400.0 MHz, with J2000 Right Ascension on the x-axis and J2000 Declination on the y-axis. The middle row shows RACS Mid-Band images at 1 367.5 MHz, with the same axes. The bottom row presents zoomed-in views of the middle-row images, highlighting sources within white boxes. The images illustrate the improvement in image quality from NVSS to RACS-mid data.
The imaging artefacts are more pronounced in the Galactic plane due to the presence of the large number density of brighter sources. However, even outside the galactic plane, we note that TGSS $-$NVSS provided spectral index limits which are typically 15
 $-$20% steeper than the actual indices estimated using the TGSS
 $-$RACS pair (see Figure 6). The reasons for this discrepancy could be multi-fold. In many cases, a visual examination of the NVSS images reveals faint emission at the corresponding positions, suggestive of the sources being real but at a significance level that was insufficient for inclusion in the de Gasperin et al. (Reference de Gasperin, Intema and Frail2018) catalogue (i.e.
 $\lt 4\sigma_l$). With the better sensitivity, RACS-mid clearly detects such sources and provides the spectral index estimates that are slightly flatter than their TGSS
 $-$NVSS limits. In some other cases, broad artefacts affect the estimates even outside the Galactic plane, although the impact is relatively smaller. A visual inspection of sources in the surveys like NVSS is thus important to assess such effects, an aspect which was also highlighted by Frail et al. (Reference Frail2017). Additionally, we note that such a discrepancy in spectral index estimates could also arise from a spectral curvature in some cases, where estimates using different pairs of frequencies would not agree with each other. However, for compact sources with flux density measurements at three frequencies, we did not find any measurable evidence for a curvature in the spectrum. It is hence likely that spectra of the majority of the remaining compact sources would also be well described by power-laws.
Left: Scatter diagram showing the upper limits on the spectral indices from (de Gasperin et al. Reference de Gasperin, Intema and Frail2018, using TGSS–NVSS) vs our estimates using TGSS and RACS, for all the 171 sources in our sample. The orange and green points indicate the sources in the GP and oGP samples, respectively, which were detected in TGSS, RACS-low as well as RACS-mid. Source which were not detected in RACS (ND) are shown as blue triangles. Right: The ratio of our spectral indices to the limits from de Gasperin et al. (Reference de Gasperin, Intema and Frail2018) are shown for all the source as a function of their Galactic latitudes. The dashed red line indicates the zero Galactic latitude, i.e.  $b=0$ deg.

Variability between the NVSS and RACS observation epochs might also produce inconsistencies in the derived spectral limits/indices. Strong variables are believed to constitute around 1% of the radio sources at 1.4 GHz (Hancock et al. Reference Hancock, Drury, Bell, Murphy and Gaensler2016), and a much lesser fraction at 150 MHz (Hajela et al. Reference Hajela, Mooley, Intema and Frail2019). Such variability can impact the spectral indices typically by  $\pm 0.15$ (Frail et al. Reference Frail2017). However, we suspect this effect to be secondary and might have affected only a small fraction of our sources.
For all the sources which were not detected, i.e. classified as ND, we obtain spectral index limits steeper than the limits provided by de Gasperin et al. (Reference de Gasperin, Intema and Frail2018) using TGSS $-$NVSS (see Figure 6). This is only natural, given the typically better sensitivity of RACS when compared to NVSS. Figure 6 also highlights that majority of the steepest spectral indices produced in our work are accounted for by NDs. Short-lived transients or variable sources can potentially explain some of these sources, resulting in anomalously steep indices, although the fraction of such sources is expected to be very small. Furthermore, up to
 $\sim$5% of the upper-limits in de Gasperin et al. (Reference de Gasperin, Intema and Frail2018) are expected to be represented by false detections associated with imaging artefacts. These could account for some of the NDs identified in our sample. However, a visual examination of all the ND source positions in TGSS reveals that majority of these sources are indeed real and unlikely to be the result of artefacts. These sources could be likely pulsars as many known pulsars exhibit similarly steep or even steeper spectra (intrinsically or due to geometric effects).
Finally, our characterisation of the spectral indices and compactness of all the sources (see Appendix) following close inspection of the individual RACS images provide refined and useful starting points for a variety of studies. It might be interesting to probe if some of the clearly resolved and multi-component sources are intriguing active galactic nuclei or luminous radio galaxies. The compact sources with steep or ultra-steep spectra remain strong candidates for new pulsars and HzRGs (Maan et al. Reference Maan, Bassa, van Leeuwen, Krishnakumar and Joshi2018). Just on the basis of the spectral index limits and compactness obtained from TGSS and NVSS, all the 171 sources in our original sample were pulsar candidates. We have shown that higher angular resolution observations, in this case available from RACS, can perform an important role in refining such initial samples – only 56 sources which are either found to be compact or not-detected in RACS, and have  $\alpha\lt -1.5$, remain promising pulsar candidates (38 compact and 18 ND). In fact, two sources (190134-012527 and 050922+085625) were already known to be pulsars at the time of this work but remained included in our sample due to usage of an older version of the psrcat. Both of these sources have been identified as compact and steep or ultra-steep spectrum sources in this work. Also, one of the sources in our sample corresponds to the M28 globular cluster which is already known to host several pulsars but the source was still kept in our sample. The source is identified with an ultra steep spectrum (
 $\alpha=-2.21\pm0.06$), but, interestingly, it appears as non-compact (
 $r=0.55\pm0.13$). The non-compactness in this particular case might have originated from multiple radio pulsars and other sources (e.g. stellar mass black holes) within the globular cluster, contributing to the total integrated flux density. Furthermore, in a survey of compact sources for pulsars and exotic objects (SCOPEFootnote
d
; Maan et al. Reference Maan, Bera, Lal, Bhusare, Kharb, Lal and Atri2026), pulsation searches of a subset of compact sources with steep spectra identified from this work have already resulted in the discovery of two pulsars towards the sources 184009+110207 and 182736-044941. Both sources have ultra-steep spectra (with
 $\alpha$ of
 $-2.55$ and
 $-2.39$). The discovery of these two pulsars further demonstrate the usefulness of this work and motivate pulsation searches of all the compact candidates with steep spectra revealed here. It would also be useful to probe these sources with higher angular resolutions and at optical wavelengths to uncover any underlying HzRGs.
6. Conclusions
Using the publicly available RACS images, we have presented a detailed characterisation of an all-sky sample comprising of 171 sources, identified as compact radio sources with steep-spectra using information from TGSS and NVSS. The characterisation involved estimating the spectral indices using the flux density measurements at as many frequencies as possible, as well as the compactness from the highest frequency detection of the individual sources. The estimated spectral indices, compactness as well as a morphological classification that could be useful for physical identification of various categories of the sources, are presented for the whole sample. This work demonstrates that, especially in the Galactic plane, a more careful noise analysis of the NVSS data products is needed before they can be used to identify truly compact sources with steep spectra. Our usage of data products from a higher angular resolution and sensitive survey, RACS, provided a more accurate estimation of spectral indices and a far better identification of compact sources with steep spectra. The complete characterisation of all sources, is made available in the form of tables. Overall, the characterisation presented in this work provides useful starting points to probe different categories of exciting sources, including pulsars as well as HzRGs.
Acknowledgements
This scientific work uses data obtained from Inyarrimanha Ilgari Bundara/the Murchison Radio-astronomy Observatory. We acknowledge the Wajarri Yamaji People as the Traditional Owners and native title holders of the Observatory site. CSIRO’s ASKAP radio telescope is part of the Australia Telescope National Facility (https://ror.org/05qajvd42). Operation of ASKAP is funded by the Australian Government with support from the National Collaborative Research Infrastructure Strategy. ASKAP uses the resources of the Pawsey Supercomputing Research Centre. Establishment of ASKAP, Inyarrimanha Ilgari Bundara, the CSIRO Murchison Radio-astronomy Observatory and the Pawsey Supercomputing Research Centre are initiatives of the Australian Government, with support from the Government of Western Australia and the Science and Industry Endowment Fund. This paper includes archived data obtained through the CSIRO ASKAP Science Data Archive, CASDA (https://data.csiro.au). We thank the GMRT staff that made these observations possible. GMRT is run by the National Centre for Radio Astrophysics of the Tata Institute of Fundamental Research. We also use data from the NRAO VLA Sky Survey (Condon et al. Reference Condon1998).
Data availability statement
Data will be made available on request.
Funding statement
RS acknowledges support from the Kishore Vaigyanik Protsahan Yojana (KVPY) fellowship. YM acknowledges support from the Department of Science and Technology via the Science and Engineering Research Board Startup Research Grant (SRG/2023/002657), as well as the Department of Atomic Energy for funding support, under project 12 $-$R&D
 $-$TFR
 $-$5.02
 $-$0700. AB acknowledges support through project CORTEX (NWA.1160.18.316) of the research programme NWA-ORC which is financed by the Dutch Research Council (NWO).
Competing interests
None.
Appendix A. Tables
The characterised parameters in this work for all the sources are presented in tables below, separately for the GP and oGP samples.
Appendix A.1. GP sample
The GP sample is listed with source names given in J2000 RA–DEC, along with their original spectral index upper limits (second column). The measured compactness, r, is provided in the third column, and the newly calculated spectral indices,  $\alpha$, in the fourth column. The reduced chi-square statistic,
 $\chi_{r}^2$, is reported for sources detected at all three frequencies (TGSS, RACS-low, and RACS-mid), indicating that three-point flux density measurements were used to fit
 $\alpha$. Sources without this statistic correspond either to ND classifications or to cases lacking a detection at RACS-mid (i.e. where
 $\alpha$ is derived from two-point flux measurements). The final column lists the resulting classification.

Table A1. Long description
Table A1: This table lists the GP sample with source names in J2000 RA-DEC format. It includes original spectral index upper limits, measured compactness (r), newly calculated spectral indices, reduced chi-square statistics, and final classifications. The reduced chi-square statistic is reported for sources detected at TGSS, RACS-low, and RACS-mid frequencies, indicating three-point flux density measurements. Sources without this statistic are either ND classifications or lack RACS-mid detections, using two-point flux measurements. Table A2: This table summarizes the estimated spectral indices, compactnesses (r), associated uncertainties, reduced chi-square of the fits, and final classifications for the oGP sample. It also shows original upper limits on spectral indices from TGSS flux densities and NVSS upper limits. Sources are classified as ultra-steep when they have spectral indices less than -1.8. Candidates for radio pulsars and HzRGs are identified as compact sources with steep or ultra-steep spectra.
Appendix A.2. oGP sample
The oGP sample, with the source names as J2000 RA-DEC, their original spectral index upper limits (second column), compactness r, calculated  $\alpha$, goodness of fit
 $\chi_{r}^2$, and the final classification.

Table A2. Long description
The table presents data on various sources identified by their J2000 RA-DEC names. It includes columns for the original spectral index upper limits, compactness (r), calculated spectral index (α), goodness of fit (χ²), and final classification. The classifications include categories such as compact, ultra-steep, and resolved.


 α
 r=0.9
 r>1
 r=1
 1.5σ


 b=0
 α
 χr2
 α
 α
 α
 χr2

 Open access

