Introduction
High proportion of concentrates in the ruminant’s diets may result in physiological disorders such as ruminal acidosis, which was related to anorexia, liver abscesses, poor performance, diarrhea and lethargy (Owens et al., Reference Owens, Secrist, Hill and Gill1998). Ruminal buffers such as sodium bicarbonate (BICARB) have traditionally been used to improve performance and rumen health of beef cattle on these diets. However, saliva production is the main source of bicarbonate in the rumen environment (Erdman, Reference Erdman1988). Thus, eating and ruminating activities are important components of the digestive function because they are associated with increased saliva output (Bailey and Balch, Reference Bailey and Balch1961; Allen, Reference Allen1997). The amount of daily BICARB secretion through saliva is greater than that entering the rumen through dietary buffers (Erdman, Reference Erdman1988). However, in beef cattle fed high-concentrate diets, mastication is reduced (Sudweeks et al., Reference Sudweeks, McCollough, Sisk and Law1975; Carter and Grovum, Reference Carter and Grovum1990) and dietary buffers could, therefore, become more important for rumen function and health. Fulton et al. (Reference Fulton, Klopfenstein and Britton1979) observed lower intake in steers being adapted to wheat diet compared with corn diet, concurrent with a lower ruminal pH. The times of the day when the lower dry matter intake (DMI) occur were also related to lower ruminal pH in the wheat diets. It was suggested that animals regulate ruminal pH through changes in feeding behavior (stop eating) to restore pH conditions to comfortable levels and, therefore, low ruminal pH results in erratic eating patterns (Fulton et al., Reference Fulton, Klopfenstein and Britton1979; Schwartzkopf-Genswein et al., Reference Schwartzkopf-Genswein, Beauchemin, Gibb, Crews, Kickman, Streeter and McAllister2003). However, other management factors may alter the eating patterns and become the cause of low ruminal pH, e.g. factors that increase meal size and eating rate may result in lower ruminal pH and greater risk of acidosis (Allen, Reference Allen1997; Owens et al., Reference Owens, Secrist, Hill and Gill1998; Schwartzkopf-Genswein et al., Reference Schwartzkopf-Genswein, Beauchemin, Gibb, Crews, Kickman, Streeter and McAllister2003). Feeding BICARB increased ruminal pH and osmolality (Rogers and Davis, Reference Rogers and Davis1982). However, low pH and high osmolality in the rumen may reduce ruminating time (Welch, Reference Welch1982). BICARB may improve ruminal pH and, consequently, change the chewing and feeding behaviors. However, bicarbonate may affect these behaviors without mediation of ruminal pH but in such a way that affects rumen function and health. Studying these factors together could provide a deeper insight into the mechanisms triggered when BICARB is added to high-concentrate diets and to assess the relationships between behavior and rumen function.
The objective of this experiment was to investigate the changes in chewing and feed intake behaviors as the BICARB level increases in the concentrate of beef heifers fed high-concentrate diets.
Material and methods
Animals, experimental design and housing
Animals, diets and the experimental design were described in the study by González et al. (2008). Briefly, four Holstein heifers (average initial BW of 264 ± 12 kg, final BW of 361 ± 23) were used in a 4 × 4 Latin square design with four 21-day periods. Animals were individually housed in tiestalls on rubber comfort mats on the Experimental Farm of the Universitat Autònoma de Barcelona. Light was continuously provided during the sampling week to allow video recordings at night. The barn had small open windows occupying 6.5% of the front and back wall surfaces.
Feed, feeders and feed intake behavior
Heifers were offered concentrate and barley straw on an ad libitum basis at 115% of the previous day intake. Diets contained 0% (control diet), 1.25%, 2.5% and 5% of added BICARB to the concentrate, dry matter (DM) basis. Additional information on ingredients, chemical composition and processing can be obtained in the study by González et al. (2008). To record the feed intake from days 14 to 18 of each experimental period, an automated system was used. Feed bunks (120 liter capacity) were mounted on waterproof digital platform scales for each stall (model HW-60KV-WP, A & D Company Ltd, Tokyo, Japan). Iron bars were set between the heifers and the scale to avoid entrance, foot-step or head resting on the scales. Each scale was programmed to transmit the feed weight at 1-min intervals. This interval was chosen because it was considered to be a reliable indicator of short-term feeding behavior. The information was downloaded onto a personal computer with a software application (WinCT, A & D Company Ltd, Tokyo, Japan). Feeding events were registered as minute-by-minute feeder disturbance. Each feed weight observation was classified as an ‘eating’ observation when the as-fed feed intake (actual feed weight minus the prior one) was greater than 10 g or when the measurement was recorded as ‘unstable’ due to the animal’s head pushing on the scale while eating. Otherwise, the observation was considered ‘no eating’. The length of all inactive intervals, in minutes, in which feeding did not occur were registered during the 5 days per heifer and period, log-transformed and used to calculate the meal criterion (which is the minimum time required to consider two periods of eating activity as separate events) through a modification of the mixed distribution methodology described by Yeates et al. (Reference Yeates, Tolkamp, Allcroft and Kyriazakis2001). The Mixed Distributions Package on the R software (R Development Core Team, 2004) was applied. Gamma distributions resulted in the best fit of the data because the first population of non-feeding intervals was much skewed. Data were fitted to the non-feeding intervals length within and across heifers, periods and also to the experimental unit (heifer in a period within a treatment). The latter resulted in the best goodness-of-fit and was, therefore, chosen for the determination of the meal criterion. The meal criterion was defined as the point where both first and second, or second and third populations of non-feeding intervals intersected. All minute-by-minute ‘eating’ observations, separated by ‘no eating’ observations shorter than or equal to the meal criterion, were grouped into meals. Meals smaller than 0.05 kg of feed consumed were not considered an individual meal. Meal frequency (meals/day) was the number of intervals where eating activity was registered and that exceeded the meal criterion. Meal length (min/meal) was calculated as the time from the first eating observation until the time of the last eating observation (within a meal) before to an inactive interval that exceeded the meal criterion. Total daily meal-time was the sum of each meal length (min/day). Meals were further characterized by DM ingested (meal size; g DM/meal) and rate of DM ingested per meal (eating rate; g DM/min), calculated as the ratio of amount of feed ingested and the corresponding meal length. Calculations were required to account for changes in feed moisture during the day because of heifers’ drooling. Therefore, estimates of DM content in feed remaining were made, assuming linear changes between the DM content of feed offered and that of the refusals. Regardless of meal time, daily patterns of DMI were analyzed based on the amount of DM eaten between each 2-h after-feeding interval throughout the day. To analyze daily meal size and length patterns, meals were assigned to a given after-feeding interval depending on its starting time.
Behavior
To register animal behavior throughout the day, a video recording device was set in the barn. It consisted of a digital black-and-white camera (model LTC 0500/50; Philips, Eindhoven, The Netherlands), with iris vari-focal lenses (model LTC 3274/40; Philips), which was connected to a time-lapse recorder (model RT 24a/00T; Philips). Animal behavior was video-recorded for 24 h during days 15, 17 and 18 of each experimental period. Data processing was carried out by scan sampling at 5-min intervals for posture and behavior of each heifer. The behavioral categories used were mutually exclusive and as were defined later. Posture was recorded as standing when the body was supported by all four legs. Otherwise, posture was defined as lying on the right or left side of the body. Posture was recorded independent of the activity the animals were performing. Activities recorded included eating, ruminating, drinking, resting, self-grooming, social behavior and oral behaviors. Data for each activity are presented as the percentage of total daily observations obtained by summing the number of times the activity was observed and divided by the total number of observations during the day, 288 observations per day or 864 observations per heifer and period. To analyze behavior patterns, the day was sub-divided into 12 intervals of 2-h each starting at the time of feeding (intervals 1 through 12). Percentage of observations made for each activity was calculated by summing the number of times the activity was observed divided by the total number of observations during the interval, 24 observations per interval or 72 observations per interval and period.
Chewing behavior
Chewing behavior was divided into three main categories: eating, ruminating and total chewing. An observation was defined as eating when the animal was eating, including manipulation and apprehension, from the feed bunk with the muzzle in the feed bunk or chewing or swallowing food with the head over it. Ruminating included the regurgitation, mastication and swallowing of the bolus. Total chewing was the sum of eating plus ruminating activities. To estimate time spent eating, ruminating or total chewing per kg of DM, organic matter (OM) and NDF intake, each activity was assumed to persist for the entire 5-min period between each observation.
Drinking behavior
Individual drinking cups and in-line water flow meters were placed in each stall. An activity was recorded as drinking when the heifer was with her muzzle in the water bowl or was swallowing the water.
Other behaviors
Non-chewing behavior categories were resting, self-grooming, social behavior and oral behaviors. Resting was recorded when no chewing behavior and no apparent activity were being performed. Self-grooming was defined as non-stereotyped licking of the body or scratching with a hind limb or against the fixtures. Social behavior was registered when a heifer was licking or nosing a neighboring heifer with the muzzle or butting. Oral behaviors included the act of licking or biting the fixtures, and tongue rolling, considered a stereotyped behavior.
Statistical analyses
The experimental unit and statistical models used are described elsewhere (González et al., 2008). All variables were averaged to generate period means for each heifer period that represented a mean daily value. In addition, a mean value was calculated for each 2-h interval of time within a day to study the patterns of behaviors throughout the day. Behavioral activities expressed as percentage were statistically analyzed after square root-arcsine transformation (Mitlöhner et al., Reference Mitlöhner, Morrow-Tesch, Wilson, Dailey and McGlone2001). Data were analyzed with a mixed-effects regression model using the MIXED procedure of SAS for repeated measures (SAS Institute Inc., Cary, NC, v. 8.2, 1999). Because equally spaced intervals within the day were taken, the heterogeneous autoregressive covariance structure generally resulted in the best fit of the data.
Results
Feed intake behavior
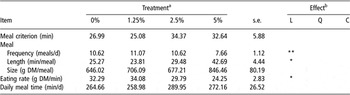
No significant effect of BICARB addition was observed on meal criteria (29.774 ± 2.81 min; Table 1). The frequency of meals decreased linearly (P = 0.01) with increasing buffer level, but it also showed a tendency for a quadratic decrease (P = 0.10), indicating that there could be a threshold response to dietary BICARB observed mainly at the 1.25% BICARB level that showed the greatest frequency but declined at higher BICARB levels. Meal length increased (P = 0.02) and eating rate decreased (P = 0.02) linearly with increasing buffer level. No treatment effects were observed for meal size (linear P = 0.12) or total daily meal-time (cubic P = 0.14).
Feed intake behavior of beef heifers as affected by increasing levels of sodium bicarbonate in high-concentrate diets
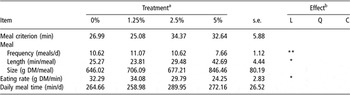
aTreatments were 0%, 1.25%, 2.5% and 5% sodium bicarbonate level in the concentrate.
bEffect of sodium bicarbonate level was significant at **P ⩽ 0.01, or at *P ⩽ 0.05; L = linear, Q = quadratic and C = cubic.
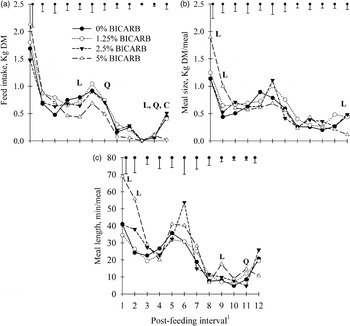
Daily patterns of DMI are shown in Figure 1a. The linear, quadratic and cubic treatment effects × interval interactions were all significant (P < 0.05), as was the interval main effect (P < 0.001). Those interactions indicate that linear, quadratic and cubic regression coefficients differed among intervals of time within the day. These interactions are explained by a linear decrease (P ⩽ 0.05) in the amount of feed consumed during the evening at intervals 5 (8 to 10 h post-feeding) and 7 (12 to 14 h), and a tendency at interval 4 (6 to 8 h; P = 0.06) when the BICARB level increased. However, DMI was affected cubically at interval 12 (22 to 24 h; P < 0.001). Additionally, eating rate decreased linearly during intervals 5 and 6, which were from 8 to 12 h post-feeding (data not shown; P < 0.05). In all diets, feed intake was highest (P < 0.05) during the first 2 h after feeding compared with any other interval of the day (P < 0.05). Thereafter, heifers maintained an average intake until the night, from interval 2 to 7 corresponding to 4 to 16 h after feeding. Feed intake decreased (P < 0.05) thereafter and remained very low during the night and increased (P < 0.05) again 2 h before the next feeding, from interval 11 to 12.
Daily dry matter intake (a), meal size (b) and meal length (c) patterns of finishing heifers fed high-concentrate diets with increasing sodium bicarbonate (BICARB) percent of concentrate dry matter. L, Q, C linear, quadratic and cubic treatment effects within any given post-feeding interval are significant (P < 0.05). 1Post-feeding intervals were: 1, 2, 3, 4, 5, 6, 7, 8, 9, 10, 11 and 12, corresponding to 0 to 2, 2 to 4, 4 to 6, 6 to 8, 8 to 10, 10 to 12, 12 to 14, 14 to 16, 16 to 18, 18 to 20, 20 to 22, and 22 to 24 h after feeding, respectively. Bars at the top of the graph represent one standard error.
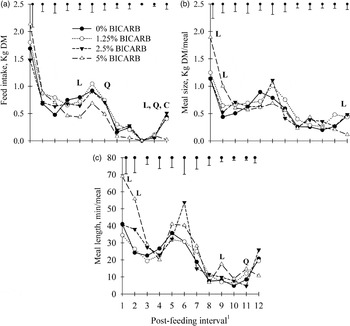
For the daily meal size patterns (Figure 1b), the after-feeding interval (P < 0.001) and the linear treatment effect × interval of the day interaction was significant (P < 0.05). The interaction was the result of a linear increase in meal size during the 4 h following the morning feeding, at intervals 1 and 2 (P < 0.05) as the level of buffer increased. Contrarily, meal size tended to decrease linearly at interval 5 (8 to 10 h) and quadratically at interval 6 (10 to 12 h; P = 0.08) when intermediate BICARB levels showed the greatest meal size. In all treatments, meal size (g DM/meal) during the 2 h following feeding was greater (P < 0.05) than at any other interval of the day. However, those meals did not differ from meals occurring from 10 to 12 h post-feeding (interval 6) because a slight increase in meal size was observed at this time. Thereafter, meal size decreased until the interval between 14 and 16 h (P < 0.05) to remain low until 22 h post-feeding.
Daily meal length patterns (min/meal) are shown in Figure 1c. Treatment, after-feeding interval and their interaction were significant (P ⩽ 0.05). The length of the meals occurring during the 4 h post-feeding increased linearly (intervals 1 and 2), and also those from 16 to 18 h post-feeding (interval 9), with increasing levels of BICARB, but they were affected cubically at interval 11 (20 to 22 h; P < 0.05). In all treatments, meals occurring from 0 to 2 h post-feeding (interval 1) were significantly longer than those from 4 to 8 (interval 3 and 4; P < 0.05) but not different from those that occurred between 8 and 12 (interval 5 and 6). Thereafter, meal length decreased and remained shorter during the night intervals (8 to 11).
Chewing behavior
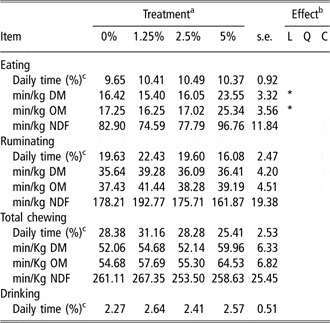
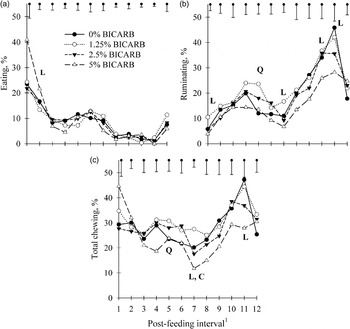
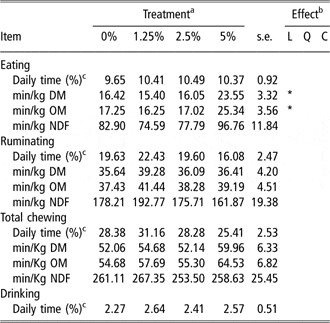
No effects of BICARB level were observed on the total proportion of time spent eating (Table 2), which is in agreement with the lack of treatment effect on total daily meal-time (Table 1). The time spent eating per unit of DM or OM intake increased linearly (P < 0.05) when increasing the buffer level. Nevertheless, treatment effect on eating time per kg NDF intake was not significant (P = 0.19). When data from daily video recordings were analyzed in 2-h intervals (Figure 2a), a tendency for an overall linear treatment effect × interval interaction was observed (P = 0.10) on the proportion of time spent eating. It increased linearly with buffer level in interval 2 (2 to 4 h; P = 0.05) and also showed a tendency for a quadratic effect (P = 0.08). Additionally, a tendency for a linear increase was also noted during the 2 h post-feeding, interval 1 (P = 0.08). Mean daily pattern of time spent eating was similar to daily DMI patterns (Figure 1a). As in DMI patterns, the time the heifer spent eating was greatest in interval 1 (0 to 2 h; P < 0.05), and decreased in interval 2 (2 to 4 h) and again in intervals 3, 4 and 5, which corresponded from 4 to 10 h post-feeding (P < 0.05). However, time spent eating from 2 to 4 h (interval 2) was not different (P > 0.10) from that of interval 6 (10 to 12 h). Heifers maintained a relatively constant eating time between 4 to 14 h post-feeding (intervals 3 to 7), and this time decreased thereafter (P < 0.05) remaining low at night, from interval 8 to 11. A slight increase was noted at interval 12 (P < 0.05), indicating that heifers had an early morning eating period.
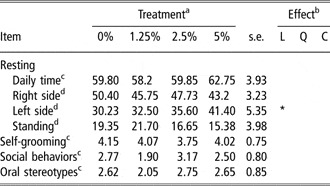
Chewing and drinking behavior of beef heifers affected by increasing sodium bicarbonate proportion in the diet
aTreatments were 0%, 1.25%, 2.5% and 5% of sodium bicarbonate in the concentrate, DM basis.
bEffect of sodium bicarbonate level was significant at at *P ⩽ 0.05; L = linear, Q = quadratic and C = cubic.
cData were analyzed as square root-arcsine transformed (no. of counted daily behavioral activities/ no. of total daily observations).
Eating (a), ruminating (b) and total chewing (c) time patterns obtained from video recordings of finishing heifers fed high-concentrate diets with increasing sodium bicarbonate (BICARB) percent of concentrate dry matter. Data are presented as proportion of total observations but were analyzed as square root-arcsine transformed (No. of counted interval activity/no. of total interval observations). L, Q, C linear, quadratic and cubic treatment effects within any given post-feeding interval are significant (P < 0.05). 1Post-feeding intervals were: 1, 2, 3, 4, 5, 6, 7, 8, 9, 10, 11 and 12, corresponding to 0 to 2, 2 to 4, 4 to 6, 6 to 8, 8 to 10, 10 to 12, 12 to 14, 14 to 16, 16 to 18, 18 to 20, 20 to 22 and 22 to 24 h after feeding, respectively. Bars at the top of the graph represent one standard error.
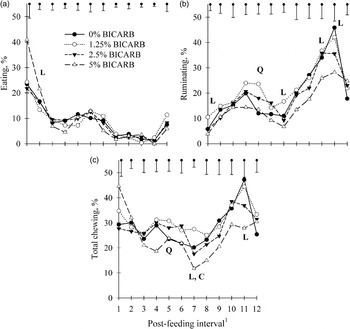
When the time spent ruminating was analyzed either as the proportion of total observations or in minutes per kg of nutrient intake, treatments had no effects (Table 2). The daily rumination patterns resulted in linear treatment effect (P = 0.04), interval of the day effect (P < 0.0001) and their interaction (P = 0.06; Figure 2b). Thus, as the BICARB level increased the overall rumination time decreased linearly, which may indicate that the curves were generally lower throughout the feeding cycle as the buffer level increased. However, the linear interaction showed that increasing the level of buffer resulted in a linear decrease in the time spent ruminating at intervals 1 (0 to 2 h), 7 (12 to 14 h), 10 (18 to 20 h) and 11 (20 to 22 h) to different extents (P < 0.05). In addition to the linear decrease observed during the 2 h post-feeding, a quadratic tendency was observed (P < 0.10), with intermediate BICARB levels showing the lowest ruminating time. Additionally, BICARB level had a quadratic effect (P ⩽ 0.05) on the time spent ruminating during interval 5 (8 to 10 h) of the day because the two intermediate BICARB levels spent the greatest time ruminating. Regardless of BICARB level, the ruminating time increased from interval 1 (0 to 2 h) to 3 (4 to 6 h; P < 0.05) and further to 4 (6 to 8 h; P < 0.05), contrarily to the decrease in time spent eating. Thereafter, ruminating time decreased from interval 4 (6 to 8 h) to 7 (12 to 14 h; P < 0.05), and increased again from interval 7 (12 to 14 h) to 11 (20 to 22 h; P < 0.05) where the peak ruminating time was observed.
The increased buffer level tended to increase linearly (P = 0.09) the total chewing time only when expressed in minute per kg of OM intake (Table 2). Total time spent chewing was equivalent to 401.9, 444.4, 401.6 and 363.04 ± 40.8 min/day (for 0%, 1.25%, 2.5% and 5% BICARB, respectively), with no treatment effect. Total chewing time patterns are shown in Figure 2c. Interval of the day was highly significant with regard to total chewing time and there was a linear treatment × interval interaction (P = 0.01). Total chewing time decreased linearly at intervals 7 (12 to 14 h) and 11 (20 to 22 h) but the effect was quadratic at interval 5 (8 to 10 h) with 1.25% and 2.5% BICARB showing the greatest values (P < 0.05). The mean daily total chewing time pattern was lowest at interval 7 (12 to 14 h) and highest at interval 11 (20 to 22 h).
Drinking behavior
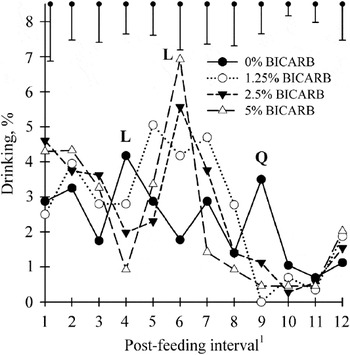
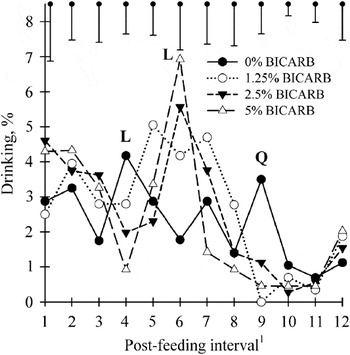
The proportion of time spent drinking was not affected by treatments (Table 2), which is in agreement with the lack of effect on total daily water consumption (González et al., 2008). Heifers spent an average of 2.48 ± 0.16% of the day on drinking activities. When daily drinking patterns were analyzed, treatment had no effect, interval of the day was significant (P = 0.001) and the treatment × interval interaction was linear (P = 0.04). The interaction can partly be explained by the fact that within the 0% BICARB diet the time spent drinking was not affected by the interval of the day (P = 0.14), whereas this proportion was highly affected by interval (P ⩽ 0.002) for the rest of the treatments (Figure 3). Moreover, a linear decrease (P = 0.05) in time spent drinking was observed from 6 to 8 h post-feeding (interval 4) as the BICARB level increased, but increased linearly from 10 to 12 h (interval 6; P < 0.01). A tendency for a linear increase was also observed during the 2 h post-feeding (P = 0.10). At interval 9 (16 to 18 h), a cubic effect of treatment was observed (P < 0.05). The pooled mean drinking pattern showed two peaks of drinking activity at intervals 2 (2 to 4 h) and 6 (10 to 12 h), which were higher (P < 0.05) than night intervals (8 to 12).
Drinking time patterns obtained from video recordings of finishing heifers fed high-concentrate diets with increasing sodium bicarbonate (BICARB) percent of concentrate DM. Data are presented as the proportion of observations within each interval but were statistically analyzed as square root-arcsine transformed (No. of counted interval activity/no. of total interval observations). L, Q, C linear, quadratic and cubic treatment effects within any given post-feeding interval are significant (P < 0.05). 1Post-feeding intervals were: 1, 2, 3, 4, 5, 6, 7, 8, 9, 10, 11 and 12, corresponding to 0 to 2, 2 to 4, 4 to 6, 6 to 8, 8 to 10, 10 to 12, 12 to 14, 14 to 16, 16 to 18, 18 to 20, 20 to 22 and 22 to 24 h after feeding, respectively. Bars at the top of the graph represent one standard error.
Other behaviors
Treatments did not affect the time spent resting (Table 3) and heifers preferred to rest lying on their right side (P < 0.001), means being 46.8 ± 1.6%, 34.9 ± 2.6% and 18.3 ± 1.9% for right lying, left lying and standing, respectively. Moreover, the BICARB level tended to decrease linearly right-lying time (P = 0.10) and left-lying time increased linearly (P = 0.04). Daily time spent on self-grooming and oral stereotypes were not affected by treatments. Time spent on social behaviors showed a tendency for a cubic effect (P = 0.06).
Proportion of time spent performing different behaviors as affected by increasing sodium bicarbonate proportion in the concentrate of beef heifers
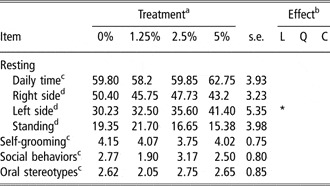
aTreatments were 0%, 1.25%, 2.5% and 5% of sodium bicarbonate in the concentrate, DM basis.
bEffect of sodium bicarbonate level was significant at *P ⩽ 0.05; L = linear, Q = quadratic and C = cubic.
cData were statistically analyzed as square root-arcsine transformed (no. of counted daily behavioral activities/no. of total daily observations).
dData were statistically analyzed as square root-arcsine transformed (no. of counted daily behavioral activities/no. of total daily observations).
Discussion
Feed intake behavior
Linear increases of BICARB level decreased linearly the amount of concentrate intake and increased that of barley straw, resulting in a tendency to decrease the total DMI (González et al., 2008). This was achieved through linear decreases in the number of meals per day. Although there was a numerical trend to increase meal size, it was not enough to compensate DMI because of the meal size × time of the day interaction. Daily average ruminal pH did not seem to play any role in daily DMI. Meal size and length increased linearly during the 4 h following the morning feeding, while ruminal pH and water consumption also increased as the buffer level increased (González et al., 2008). The linear increase observed in ruminal pH during the 4 h post-feeding may play a role in these effects because animals may adjust their intake patterns to regulate ruminal pH (Schwartzkopf-Genswein et al., Reference Schwartzkopf-Genswein, Beauchemin, Gibb, Crews, Kickman, Streeter and McAllister2003). Fulton et al. (Reference Fulton, Klopfenstein and Britton1979) observed lower intake in steers being adapted to wheat diet compared with corn diet, concurrent with a lower ruminal pH. Moreover, lower intakes were observed during the first 2 h, and from 4 to 8 h post-feeding, in relation to lower ruminal pH. The authors concluded that steers fed the corn diet were able to maintain ruminal pH over 5.5 by adjusting intake patterns. Nevertheless, ruminal fermentation products are more likely to be associated with meal size and length because they trigger satiety signals and, consequently, they may affect feed intake (Forbes, Reference Forbes1980; Allen et al., Reference Allen, Bradford and Harvatine2005). Ruminal propionate molar proportion and concentration decreased linearly at all after-feeding times (P < 0.05), except at 0 and 24 h (data not shown). However, total volatile fatty acids (VFA) concentration just decreased numerically by 14%, on average, during the 4 h post-feeding as the buffer level increased (data not shown). Dietary BICARB was shown to increase pH and osmolality, and to reduce the molar proportion and production rate of propionate in the rumen (Rogers and Davis, Reference Rogers and Davis1982). Total VFA have been related to satiety signals (Forbes, Reference Forbes1980) but propionate has been proposed to cause satiety to a larger extent than other VFA, decreasing both the size and frequency of meals (Allen et al., Reference Allen, Bradford and Harvatine2005). Thus, the increase in the size and length of meals observed during the 4 h post-feeding could be explained by a reduction in the accumulation of fermentation products, mainly propionate, which would cause a delay of satiety. Nevertheless, the opposite findings than those observed during the 4 h post-feeding were observed later in the day, from 6 to 12 h post-feeding. Accordingly, DMI decreased linearly from 6 to 10 h and from 12 to 14 h post-feeding, whereas meal size and eating rate tended to decrease from 8 to 12 h, as dietary BICARB increased. Neither ruminal pH nor fermentation products can explain these effects during these intervals of time. Osmolality was not measured in the present study but it has been related to the short-term control of feed intake, reducing meal size and increasing meal frequency, because it contributes to early satiation (Carter and Grovum, Reference Carter and Grovum1990; Langhans et al., 1995). Ruminants can avoid increases in ruminal osmolality through an increase in the water consumption-to-DMI ratio (Langhans et al., 1995). Water consumption per kg of DMI increased linearly from 4 to 24 h but was not affected from 0 to 4 h post-feeding, which was caused by decreased DMI because water consumption was not significantly affected (González et al., 2008). The production of VFA and dissolution of minerals from ingested feed are the major determinants of the post-prandial increase in ruminal osmolality (Bennink et al., Reference Bennink, Tyler, Ward and Johnson1978). In the present study, concentrations of total VFA were the highest at 12 h post-feeding (160 mM) with no treatment effects (data not shown). Just a numerical trend was observed in total VFA concentration at 8 h post-feeding, values being 165, 137, 135 and 155 ± 15 mM (quadratic P = 0.11). Therefore, it is speculated that ruminal osmolality could be triggering the mechanisms of feed intake control from around 6 to 12 h post-feeding, similar to those described by Carter and Grovum (Reference Carter and Grovum1990) and Langhans et al. (1995), but more noticeable when feed contained BICARB because of its rapid contribution to osmolality when dissolved in the rumen. In conclusion, both proposed mechanisms of feed intake control could be acting at different moments within the day, as reflected by a meal size × time of the day interaction, likely as a result of variations in ruminal and other metabolic conditions throughout the day.
Reduced eating rate has been associated with reduced feeding motivation (Nielsen, Reference Nielsen1999), suggesting reduced palatability, as was the case when the buffer was fed alone free-choice (Keunen et al., Reference Keunen, Plaizier, Kyriazakis, Duffield, Widowski, Lindinger and McBride2003). However, if low palatability was responsible for the reduction in feed intake, then eating rate, meal size and DMI should have been reduced from the beginning of the feeding cycle, which did not occur. Eating rate decreased linearly only from 8 to 12 h post-feeding (data not shown). Moreover, eating rate of heifers under 0% and 1.25% BICARB only showed a tendency to differ (P ⩾ 0.06) among intervals of the day, whereas in heifers under 2.5% and 5% BICARB it differed among intervals (P < 0.001). Thus, feeding behavior of the present study was altered by high BICARB levels, resulting in greater variation of eating rate throughout the day, whereas it was more homogeneous in the control and 1.25% BICARB. Results of mean meal size and length patterns emphasize the importance of the first after-feeding meals for cattle fed once daily. The size of the first meal as a proportion of the total daily DMI increased linearly (P = 0.01) as the buffer level increased (data not shown). This could be conditioning the evolution of all subsequent feeding and ruminal fermentation patterns.
No studies on feeding behavior with high mineral levels were found for this type of cattle. Rossi et al. (Reference Rossi, Del Prete, Rokitzky and Scharrer1998) fed a complete pelleted diet containing 3% NaCl diet to pigmy goats and observed a reduction in feed intake with no effect on water consumption, as in the present trial (González et al., 2008), and reported a reduction in the size and the frequency of meals, and in eating rate, whereas meal length increased. Our results for total daily meal-time, meal frequency and eating rate are similar to those reported in a series of experiments working with steers by Putnam and Davis (Reference Putnam and Davis1963) who fed 24% ground forage (15-min meal criterion), and Chase et al. (Reference Chase, Wangsness and Baumgardt1976) who fed 28% chopped hay (20-min meal criterion). However, other researchers have reported a much higher daily meal-time, size and length than the present trial when working with steers fed around 10% forage in diets and when using a 20-min meal criterion (Cooper et al., Reference Cooper, Klopfenstein, Stock, Milton, Herold and Parrott1999; Erickson et al., Reference Erickson, Milton, Fanning, Cooper, Swingle, Parrott, Vogel and Klopfenstein2003). Results are difficult to compare because of different experimental conditions and the selection of the meal criterion may affect the estimation of all these variables (Tolkamp and Kyriazakis, Reference Tolkamp and Kyriazakis1999). The increased DMI during the 2 h following feeding is similar to those reported by Fulton et al. (Reference Fulton, Klopfenstein and Britton1979) while adapting steers to diets higher in concentrates. Although meal size and length were smaller at night, short and small meals were recorded in the present trial. On average, heifers spent 78% of their total eating time during the 12 post-feeding hours, which agrees with results from Putnam and Davis (Reference Putnam and Davis1963) and Krause et al. (Reference Krause, Beauchemin, Rode, Farr and Nørgaard1998) with beef cattle on high-concentrate diets. We used continuous lighting because video recording at night was required. However, eating patterns were not significantly affected by complete 24-h controlled lighting in steers or dairy cows (Chase et al., Reference Chase, Rakes, Linnerud and Pettyjohn1971; Tanida et al., Reference Tanida, Swanson and Hohenboken1984).
Chewing behavior
Proportion of time spent eating in the present experiment agrees with that in the studies of Shain et al. (Reference Shain, Stock, Klopfenstein and Herold1999) and Rotger et al. (Reference Rotger, Ferret, Manteca, Ruiz-de-la-Torre and Calsamiglia2006) but is slightly lower than that observed by Krause et al. (Reference Krause, Beauchemin, Rode, Farr and Nørgaard1998) in beef cattle fed high-concentrate rations with about the same levels of straw. Although BICARB addition reduced DMI (González et al., 2008), no effects were observed in the proportion of time spent eating or in the total daily meal-time, which led to a linear increase in the time spent eating per kg of DM and OM intakes, as reflected by a decrease in eating rate. Eating time per kg of OM and DM intakes were primarily due to an increased proportion of forage eaten (R 2 = 0.41; P < 0.001), likely because more time would be needed to form the bolus and swallow (Sudweeks et al., Reference Sudweeks, McCollough, Sisk and Law1975). However, extra time might have been required to sort the concentrate and choose for straw.
As in the present study, large variations among animals in ruminating time were also observed by Campbell et al. (Reference Campbell, Marshall, Mandell and Wilton1992), which reduce the likelihood of detecting differences. Daily ruminating time was probably the variable most affected by the low number of animals used in the present experiment, which reduces the statistical power. Ruminating time among treatments followed the same pattern as DMI (González et al., 2008) but was best explained by the total OM intake in relation to metabolic BW (g OM/kg0.75; adjusted R 2 = 0.49; P = 0.001), correcting for the high mineral content of DM (González et al., 2008), which are not conducive to rumination at all. The 5% BICARB diet reduced total DMI by 20%, whereas straw intake increased by 26%, and rumination time decreased by 28% compared with the 1.25% BICARB. Therefore, ruminating time seemed to be more related to total DMI than to straw DMI. Decreasing intake level of steers fed high-forage diets also decreased ruminating time in the study of Sudweeks et al. (Reference Sudweeks, Ely and Sisk1980) but not in that of Deswysen et al. (Reference Deswysen, Ellis, Pond, Jenkins and Connelly1987). Ruminating times of the present experiment are higher than those observed by Shain et al. (Reference Shain, Stock, Klopfenstein and Herold1999), who demonstrated that even all-concentrate rations resulted in 89 min/day of rumination time. Contrary to our results, Rotger et al. (Reference Rotger, Ferret, Manteca, Ruiz-de-la-Torre and Calsamiglia2006) fed heifers with 8% or 12% of straw and observed greater ruminating time, as well as Shain et al (Reference Shain, Stock, Klopfenstein and Herold1999) when adding 5% straw to an all-concentrate diet. Campbell et al. (Reference Campbell, Marshall, Mandell and Wilton1992) observed the lowest eating and ruminating times during the first after-feeding interval in a diet containing corn cobs and a higher ruminal osmolality during that interval (Marshall et al., Reference Marshall, Campbell, Mandell and Wilton1992), and Reference WelchWelch (1982) observed a delay in the onset of rumination after feeding (increased latency) by increasing ruminal osmolality with hypertonic solutions. The linear decrease in ruminating time observed during the 2 h post-feeding was primarily due to an increase in mastication time allocated to eating rather than ruminating, as reflected by higher meal length and time spent eating as the BICARB level increased. However, the decrease in ruminating time observed from 6 to 10 h and from 12 to 14 h post-feeding could be due to the expected high ruminal osmolality as discussed before. Because high ruminal osmolality was not expected, due to the very low DMI, and no competitive activities (eating) were observed, the linear decreases observed for ruminating time from 18 to 22 h post-feeding could be related to the linear decrease in the level of daily intake.
Drinking behavior
The lack of an effect of treatments on the percentage of time spent drinking is in agreement with that of the total amount of water drunk (González et al., 2008). Langhans et al. (1995) stated that in ruminants a relatively high proportion of drinking bouts is temporarily dissociated from eating because the mechanism that links those activities is ruminal osmolality. Nonetheless, from Figure 1a (eating pattern) and Figure 3 (drinking pattern) it may be concluded that the higher the BICARB level of the ration, the higher the association between the eating and drinking patterns, or the higher the meal-associated drinking. Additionally, the time spent drinking was not different among intervals of the day within the control diet but a significant variation between intervals was evident for the other treatments. This conclusion agrees with findings by Rossi et al. (Reference Rossi, Del Prete, Rokitzky and Scharrer1998).
Results of the present study and the companion paper (González et al., 2008) demonstrate that the addition of BICARB leads to a wide range of changes in intake, ruminal fermentation, and feeding and chewing behaviors. Moreover, significant treatments × time of the day interactions were observed for most variables, some of which were of opposite directions during different times such as meal size and length. Feed intake and chewing behaviors were not studied previously when assessing the effects of BICARB in high-concentrate rations. These behaviors may explain part of the variability in the response among studies when BICARB is added. Some of the changes observed when BICARB level increased in the present study might have a positive effect on ruminal pH, whereas others may negatively affect it. For example, ruminating time decreased linearly in a period of time when ruminal pH reached the nadir, from 12 to 14 h. Rumination is necessary during this time to increase saliva production, which buffers the rumen (Bailey and Balch, Reference Bailey and Balch1961). Meal size increased linearly during the 4 h following feeding, which may negatively affect ruminal pH and its post-prandial drop, as suggested by Allen (Reference Allen1997), Owens et al. (Reference Owens, Secrist, Hill and Gill1998), and Cooper et al. (Reference Cooper, Klopfenstein, Stock, Milton, Herold and Parrott1999). However, there is little doubt about the buffering effect of bicarbonate in the rumen (Kohn and Dunlap, Reference Kohn and Dunlap1998), which was supported in the present study by the finding that despite increasing buffer level, increased meal size during the 4 h post-feeding and drop in pH was attenuated (González et al., 2008). In addition, the linear increase in the proportion of straw eaten and in the time spent chewing per kg of OM or DM intake was related to greater ruminal pH by Allen (Reference Allen1997) because the proportion of starch is diluted and ensalivation of feed increases. We observed a large animal effect on meal size and, for heifers that had a large meal size, ruminal pH fell significantly at 2 h even with 5% BICARB. This highlights the importance of the first after-feeding meals on subsequent ruminal function under the current feeding management, which could be conditioning the evolution of the whole feeding cycle. Relating the present data with that in the companion paper (González et al., 2008), total chewing times per kg of OM and DM were the only variables that explained the greatest proportion of the variation in daily average ruminal pH in the present study (adjusted R 2 = 0.33; P = 0.01; data not shown). In contrast, Krause et al. (Reference Krause, Beauchemin, Rode, Farr and Nørgaard1998) did not find any relationship with chewing activity in high-concentrate diets. The objective of the present experiment was not to choose the best buffer level but to assess trends in, and relationships among, the changes of variables as BICARB levels increase. However, if multiple comparisons of means are considered then most significant differences were observed between the 1.25% and the 5% BICARB levels. Therefore, the 1.25% BICARB may be considered the best buffer level and was characterized by more homogeneous patterns of feed intake and chewing behaviors throughout the day. For instance, the 1.25% BICARB did not show differences among time intervals of the day on the total chewing time (P = 0.60), whereas the rest of the treatments did so (P < 0.05). Nevertheless, the variables affecting daily pH patterns or its variation may change in type and importance throughout the feeding cycle.
In conclusion, the addition of BICARB as a ruminal buffer to high-concentrate rations decreased meal frequency and eating rate, increased meal length but did not affect meal size, meal time, and chewing time on a daily average basis. However, all these variables showed a treatment × time of the day interaction. As the bicarbonate level of the diet increased, meals occurring within 4 h after-feeding were greater and longer, as well as the eating time. Nevertheless, meals tended to be smaller and with a slower eating rate from 8 to 12 h post-feeding. Feed intake was also reduced from 6 to 10 h and from 12 to 14 h together with ruminating and total chewing times. These behavioral variables may help in explaining the mechanisms triggered by bicarbonate that may potentially influence intake and digestive function. However, these mechanisms might change throughout the day due to differences in ruminal conditions and physiology.
Acknowledgments
This research was supported by CICYT (Project AGL2000-0352). The studentship of L. A. from MECD (FPU AP20023344) is acknowledged.