





The prevalence of type 2 diabetes (T2D) is projected to rise to 7079 per 100 000 by 2030, with increases expected across all regions of the globe(Reference Khan, Hashim and King1). Lifestyle factors, particularly diet, are widely recognised to play a pivotal role in T2D prevention(Reference Hu, Manson and Stampfer2,Reference Uusitupa, Khan and Viguiliouk3) , making the identification of additional modifiable dietary factors a critical public-health priority.
Diet-centred approaches, such as dietary quality indices and dietary patterns, are widely recommended to reduce the risk of major chronic diseases(4–7) and have been extensively examined to capture complex interactions among various nutrients and foods in relation to T2D risk(Reference Theodoratou, Timofeeva and Li8). Dietary diversity, defined as a whole-diet approach that emphasises food variety(Reference Mozaffari, Hosseini and Lafrenière9), is also endorsed by various dietary guidelines(7,10,Reference Phillips11) . However, evidence linking dietary diversity to T2D risk remains limited.
A recent systematic review of five prospective studies on dietary diversity and metabolic-related outcomes reported inconsistent findings(Reference Mozaffari, Hosseini and Lafrenière12). Three of these studies examined overall dietary diversity and T2D risk(Reference Conklin, Monsivais and Khaw13–Reference Otto, Padhye and Bertoni15), and only the European Prospective Investigation into Cancer and Nutrition in Norfolk (EPIC-Norfolk) study found an inverse association between dietary diversity and T2D(Reference Conklin, Monsivais and Khaw13). Several factors may contribute to these inconsistencies. First, studies used different dietary diversity indices – including total and within-food group diet diversity scores(Reference Conklin, Monsivais and Khaw13), food variety score and recommended food variety score(Reference Masset, Scarborough and Rayner14), and dietary diversity metrics(Reference Otto, Padhye and Bertoni15). Second, all three studies relied on a single dietary assessment at baseline(Reference Conklin, Monsivais and Khaw13–Reference Otto, Padhye and Bertoni15), which fails to capture dietary changes over time or reduce measurement errors through repeated assessments(Reference Hu, Stampfer and Rimm16). Third, simultaneous evaluations of within-group diversity alongside overall dietary diversity score (DDS) have remained limited. The EPIC-Norfolk study used a total diet diversity score based on the inclusion of five major food groups from food guides, coupled with diversity assessments within each group, and reported significant inverse associations for both total diet diversity score and specific food groups (e.g. ‘vegetable’ and ‘fruit’ groups) with T2D risk(Reference Conklin, Monsivais and Khaw13). This suggests that considering within-group diversity may provide additional insights into the relationship between dietary diversity and T2D risk. Finally, the Multi-Ethnic Study of Atherosclerosis examined dietary diversity and T2D risk across diverse ethnic populations(Reference Otto, Padhye and Bertoni15). While this study provided valuable insights across ethnicities, population-specific dietary cultures may influence which food groups are included in DDS, potentially contributing to inconsistent findings across studies. Given these methodological challenges, further research in diverse populations with repeated dietary assessments and refined indices that account for within-group diversity is needed to clarify these associations.
Therefore, we aimed to examine the prospective associations between both overall and within-group DDS, calculated based on cumulative average consumption of foods (servings/day or week), and the risk of T2D in a Korean population-based cohort. By addressing the aforementioned limitations – using repeated dietary assessments, simultaneously evaluating overall and within-group diversity, and applying population-specific food group classifications – this study seeks to provide more robust evidence on the relationship between dietary diversity and T2D risk.
Materials and methods
Study population
The Korean Genome and Epidemiology Study–Cardiovascular Disease Association Study was established to conduct a comprehensive investigation of risk factors for cardiometabolic health, including T2D(Reference Kim and Han17). The Korean Genome and Epidemiology Study–CVD Association Study consisted of three cohorts(Reference Kim and Han17): the Multi-Rural Communities Cohort, Atherosclerosis Risk of Rural Areas in the Korean General Population cohort and the Kangwha cohort. Community dwellers aged ≥40 years were recruited in each cohort using multistage cluster sampling. Between 2005 and 2011, 19 546 participants without CVD or cancer were enrolled in the baseline survey (n 9759 from the Multi-Rural Communities Cohort, 5942 from the Atherosclerosis Risk of Rural Areas in the Korean General Population study and 3845 from the Kangwha cohort). They were asked to return for follow-up visits every 2–4 years between 2007 and 2017. The follow-up rate was 78·1 % among participants with at least once follow-up visit (81·0 % for Multi-Rural Communities Cohort; 77·6 % for the Atherosclerosis Risk of Rural Areas in the Korean General Population; 72·1 % for Kangwha).
In this study, we excluded participants who met any of the following criteria: (1) use of anti-diabetic drugs or insulin; (2) fasting blood glucose ≥126 mg/dL (7·0 mmol/L) at baseline (n 2156); (3) ≥10 blank items on the FFQ or implausible total energy intake (≤ 0·5th or ≥99·5th percentile; n 284); and (4) missing key covariate data – including education level, exercise, BMI, smoking status or alcohol consumption (n 440). Thus, the final analysis included 16 666 participants (6162 men and 10 504 women). This study was conducted according to the guidelines laid down in the Declaration of Helsinki, and all procedures involving human subjects were approved by the Institutional Review Board of Hanyang University (HYUIRB-202106-005). The original cohort protocols were approved by the Institutional Review Boards of Hanyang University, Chonnam National University, and Keimyung University for the Multi-Rural Communities Cohort; Yonsei University Wonju College of Medicine for the Atherosclerosis Risk of Rural Areas in the Korean General Population; and Yonsei University College of Medicine for the Kangwha cohort. Written informed consent was obtained from all participants.
Dietary assessment and calculation of dietary diversity score
Dietary intake was assessed at baseline and during follow-up surveys using a validated FFQ(Reference Ahn, Kwon and Shim18). Trained interviewers operating under the same standardised protocol collected dietary data through face-to-face interviews. The FFQ included 106 food items with nine frequency categories ranging from ‘never or rarely’ to ‘three times/day’, with three or more portion sizes specified for each item, including a standard serving size (servings/day). These portion sizes were weighted based on their multiple of the standard serving size. For seasonal foods such as fruits, weighted frequencies (times/day) were calculated by accounting for the period of consumption during the year. Dietary intakes (servings/day) were calculated by multiplying the weighted frequency by the weighted portion size. The FFQ was administered up to three times: at baseline and at two follow-up visits, at intervals of approximately 2 to 4 years. We used cumulative average intakes (servings/day), updated at each visit, by averaging only the FFQ assessments obtained before the endpoint or censoring. This approach was used to reduce within-person variation and better represent habitual dietary intakes(Reference Hu, Stampfer and Rimm16).
We adopted the DDS method from the EPIC-Norfolk study(Reference Conklin, Monsivais and Khaw13,19) to calculate the overall DDS, whereas the five within-group DDS were based on the 2020 Dietary Reference Intakes for Koreans (KDRI)(7). The KDRI-based classification was used to better reflect the Korean dietary context, including foods such as fermented vegetables, seaweeds, mushrooms and soy foods that are not adequately accommodated by the subgroup structure used in EPIC-Norfolk. While the EPIC-Norfolk study used consumption frequency alone, we calculated these scores using multiples of the standard serving for each food. To construct the overall and within-group DDS, we first evaluated whether food items included in the FFQ could be classified into five food categories, based on the recommended meal composition provided in the KDRI(7) (Supplemental Table 1). Food items that could not be assigned to the five KDRI food categories – such as jam/honey/margarine, pizza/hamburger, candy/chocolate, coffee, sugar added to coffee, cream added to coffee, green tea, carbonated drinks and other beverages – were excluded from DDS calculations. Additionally, the ‘Oils and Sugars’ group, which is generally not included in DDS calculations, was also excluded. The final DDS inventory consisted of 94 food items, categorised into five major food groups and 18 subgroups. The five major food groups were: ‘Grains and their products’; ‘Meat/Seafood/Eggs/Legumes/Nuts’; ‘Vegetables/Seaweed/Mushrooms’; ‘Fruits’; and ‘Milk and Dairy products’.
The Korean Genome and Epidemiology Study–CVD Association Study DDS was calculated as follows: (1) Overall DDS (range: 0–5): one point was assigned to each food group if the total intake from that group was ≥1 serving/day, and scores for all five food groups were summed. (2) Within-group DDS: for each food group, one point was assigned to every food item consumed ≥1 serving/week, and points for all items within a group were summed. Maximum possible scores varied by food group, ranging from 4 for ‘Milk and Dairy products’ to 31 for ‘Meat/Seafood/Eggs/Legumes/Nuts’. Detailed information about the food items included in each group can be found in Supplemental Table 1.
Assessment of type 2 diabetes
At every visit, participants reported whether they had been diagnosed with T2D by a physician and, if applicable, whether they were receiving treatment with anti-diabetic drugs and/or insulin. Incident cases of T2D were defined as participants meeting one of the following criteria: (1) treatment with oral anti-diabetic medication or insulin or (2) fasting blood glucose concentration ≥126 mg/dL (7·0 mmol/L)(20).
Person-time for follow-up for each participant was calculated from the date of the baseline survey to the date of subsequent visits before T2D diagnosis or censoring. For participants lost to follow-up, the time to censoring was set to half of the median follow-up time of participants who successfully completed the follow-up visits(Reference Woodward21).
Ascertainment of non-dietary covariates
Covariates were collected through structured questionnaires and health examinations conducted using standardised protocols and procedures to ensure consistency across study centres. Interviewers administered questionnaires to collect information regarding participant demographic characteristics (age, sex, education level and menopausal status) and lifestyle factors associated with T2D (regular exercise, alcohol consumption and smoking). Height and weight were measured to the nearest 0·1 cm and 0·1 kg, respectively, with participants wearing light clothing and no shoes. BMI was calculated as weight (kg) divided by height squared (m2). Blood samples were collected after a minimum 8-hour fast, and fasting blood glucose concentrations were measured in serum using an ADVIA 1650 Automated Analyzer (Siemens, New York, NY, USA).
Statistical analyses
All analyses were conducted separately for men and women. Cumulative average overall DDS were categorised into three score ranges (0 to 3·0, >3·0 to 4·0, and > 4·0 to 5·0), and within-group DDS were categorised into quartiles (Q1–Q4). The lowest category served as the reference group. Descriptive data were presented as means and SD for continuous variables and as numbers (n) and percentages (%) for categorical variables. A general linear model was used to obtain age-adjusted means and the SE or percentages according to categories of cumulative average overall and within-group DDS. Linear trends were tested by treating the median values of each score category as continuous variables.
To estimate T2D incidence rate ratios (IRR) and 95 % CI across DDS categories, a modified Poisson regression model with a robust error estimator was applied(Reference Callas, Pastides and Hosmer22,Reference Zou23) . Both age-adjusted and multivariable-adjusted IRR were reported. In the multivariable model, we adjusted for age (years), higher education level (≥12 years of education, yes or no), regular exercise (≥3 times/week and ≥30 min/session, yes or no), smoking status (never, past or current) in men, current smoking status (yes or no) in women, alcohol consumption (mL/day), BMI (kg/m2), fasting blood glucose at baseline (mg/dL) and total energy intake (kcal/day). To assess sex-related interaction, a cross-product term between sex and DDS categories was added to the multivariable models, and Wald tests were used to evaluate multiplicative interaction.
To visualise the relationships between overall DDS categories and dietary diversity patterns across food groups, radar charts were constructed. These charts depict the diversity scores relative to the population mean, stratified by overall DDS category and sex. Two types of visualisations were produced: one showing the five components of within-group DDS (Grains and their products, Meat/Seafood/Eggs/Legumes/Nuts, Vegetables/Seaweed/ Mushrooms, Fruits, and Milk and Dairy products) and another showing their 18 subgroups.
Sensitivity analyses were performed to evaluate robustness: (1) additional adjustment for dietary factors previously linked to T2D, including folate(Reference Hong, Woo and Kim24), calcium(Reference Oh, Woo and Kim25), glycaemic load(Reference Krishnan, Rosenberg and Singer26), total isoflavone(Reference Woo, Kim and Lee27), magnesium(Reference Lopez-Ridaura, Willett and Rimm28) and cereal fibre(Reference Krishnan, Rosenberg and Singer26) – with energy adjustment by the residual method(Reference Willett29); (2) exclusion of participants with new-onset T2D reported within one year to minimise reverse causation; and (3) restriction to participants who completed at least two follow-up surveys. For the within-group DDS analyses, we additionally adjusted for the other four within-group DDS scores.
All analyses were performed using SAS software version 9.4 (SAS Institute, Cary, NC, USA). Radar charts were created using R version 4.0.0 (https://www.r-project.org). A two-sided P value < 0·05 was considered statistically significant.
Results
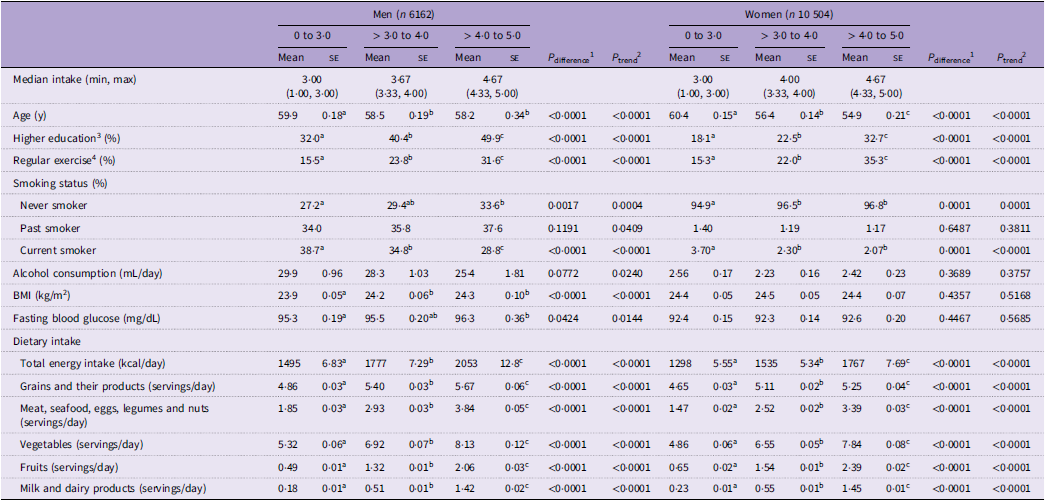
A total of 16 666 participants contributed to 96 609 person-years of follow-up data (men: 35 712; women: 60 897), during which 953 incident T2D cases occurred (men: 413; women: 540) over a median follow-up of 5·96 years (interquartile range, 3·17–8·76). Baseline general characteristics of the study population are summarised in Supplemental Table 2. Table 1 presents the age-adjusted characteristics of the study participants according to cumulative average overall DDS. Participants in the highest DDS category, both men and women, had higher levels of education, total energy intake and consumption of all five food groups (serving/day). They were also younger and more likely to be regular exercisers and never-smokers compared with those in the lowest DDS category. Additionally, men in the highest DDS category had lower alcohol consumption (p linearity = 0·0240) but higher BMI (p linearity < 0·0001) and fasting blood glucose (p linearity = 0·0144), although similar results were not evident among the high-DDS women. Similar patterns were noted across quartiles of within-group DDS (data not shown).
Age-adjusted characteristics of the study participants according to cumulative average overall dietary diversity score category

Table 1. Long description
Panel A: The table presents data for men with dietary diversity scores ranging from 0 to 3.0, greater than 3.0 to 4.0, and greater than 4.0 to 5.0. It includes median intake, age, education level, regular exercise, smoking status, alcohol consumption, BMI, fasting blood glucose, dietary intake, and servings of various food groups. Panel B: The table presents similar data for women within the same dietary diversity score categories. The table shows trends and differences in characteristics across different dietary diversity score categories for both men and women.
All values were adjusted for age and expressed as the mean ± se for continuous variables or percentage for categorical variables.
1 P values for differences were obtained using the general linear model. Mean values with different superscripts (a, b, c) within a row were significantly different based on Tukey’s multiple comparison test.
2 P values for linear trends were obtained by treating the median value of each group as a continuous variable.
3 Higher education is defined as ≥12 years of education.
4 Regular exercise is defined as ≥3 times/week and ≥30 min/session.
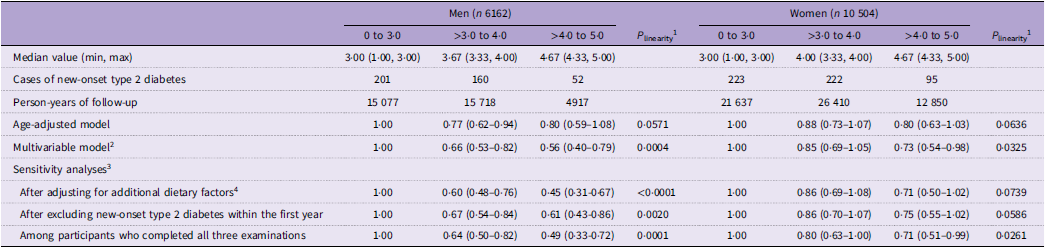
Table 2 presents the T2D IRR and 95 % CI according to overall DDS category. A clear inverse association between overall DDS and T2D risk was evident for both men and women (IRR = 0·56, 95 % CI = 0·40–0·79, p for linear trend = 0·0004 for men; IRR = 0·73, 95 % CI = 0·54–0·98, p for linear trend = 0·0325 for women). Sensitivity analyses, including adjusting for nutrient intake, excluding cases of new-onset T2D within the first year and restricting to participants with three examinations, confirmed these findings. Estimates were also robust to alternative assumptions about the timing of T2D onset for cases with an unobserved onset date. Assigning onset to the midpoint of the interval since the last diabetes-free visit, or to the day immediately following that visit, yielded IRR for the highest DDS category of 0·53 to 0·55 in men and 0·71 to 0·72 in women, showing little difference from the main analysis. Because the Korean Genome and Epidemiology Study–CVD Association Study comprises three cohorts, we also estimated the associations separately within each cohort and combined the cohort-specific multivariable estimates using inverse-variance–weighted fixed-effects meta-analysis. The inverse association was consistent in direction across all three cohorts in both sexes, and the pooled estimates were essentially identical to those from the combined analysis (highest v. lowest category: IRR = 0·61, 95 % CI = 0·43–0·87 in men; 0·72, 0·53–0·96 in women) (Supplemental Table 3).
Type 2 diabetes incidence rate ratios and 95 % CI according to cumulative average overall dietary diversity score category

Table 2. Long description
A table comparing type 2 diabetes incidence rates among men and women based on dietary diversity scores. The table has 12 rows and 10 columns. Column headers are: Men (n 6162), 0 to 3.0, > 3.0 to 4.0, > 4.0 to 5.0, P_linearity, Women (n 10 504), 0 to 3.0, > 3.0 to 4.0, > 4.0 to 5.0, P_linearity. Row labels are: Median value (min, max), Cases of new-onset type 2 diabetes, Person-years of follow-up, Age-adjusted model, Multivariable model, Sensitivity analyses, After adjusting for additional dietary factors, After excluding new-onset type 2 diabetes within the first year, Among participants who completed all three examinations. Row 1: Median value (min, max): Men: 3:00 (1:00, 3:00), > 3:0 to 4:0: 3:67 (3:33, 4:00), > 4:0 to 5:0: 4:67 (4:33, 5:00), Women: 3:00 (1:00, 3:00), > 3:0 to 4:0: 4:00 (3:33, 4:00), > 4:0 to 5:0: 4:67 (4:33, 5:00). Row 2: Cases of new-onset type 2 diabetes: Men: 201, 160, 52, Women: 223, 222, 95. Row 3: Person-years of follow-up: Men: 15 077, 15 718, 4917, Women: 21 637, 26 410, 12 850. Row 4: Age-adjusted model: Men: 1:00, 0:77 (0:62-0:94), 0:80 (0:59-1:08), P_linearity: 0:0571, Women: 1:00, 0:88 (0:73-1:07), 0:80 (0:63-1:03), P_linearity: 0:0636. Row 5: Multivariable model: Men: 1:00, 0:66 (0:53-0:82), 0:56 (0:40-0:79), P_linearity: 0:0004, Women: 1:00, 0:85 (0:69-1:05), 0:73 (0:54-0:98), P_linearity: 0:0325. Row 6: Sensitivity analyses: After adjusting for additional dietary factors: Men: 1:00, 0:60 (0:48-0:76), 0:45 (0:31-0:67), P_linearity: <0:0001, Women: 1:00, 0:86 (0:69-1:08), 0:71 (0:50-1:02), P_linearity: 0:0739. Row 7: After excluding new-onset type 2 diabetes within the first year: Men: 1:00, 0:67 (0:54-0:84), 0:61 (0:43-0:86), P_linearity: 0:0020, Women: 1:00, 0:86 (0:70-1:07), 0:75 (0:55-1:02), P_linearity: 0:0586. Row 8: Among participants who completed all three examinations: Men: 1:00, 0:64 (0:50-0:82), 0:49 (0:33-0:72), P_linearity: 0:0001, Women: 1:00, 0:80 (0:63-1:00), 0:71 (0:51-0:99), P_linearity: 0:0261.
1 P values for linear trends were obtained using a modified Poisson regression with robust error estimation, which treated the median value of each score category as a continuous variable.
2 The multivariable model was adjusted for age (years), higher education (≥12 years of education), regular exercise (≥3 times/week and ≥30 min/session), alcohol consumption (ml/day), BMI (kg/m2), baseline fasting blood glucose (mg/dL) and total energy intake (kcal/day). Additionally, smoking status (never, past, or current) in men and current smoking status (yes or no) in women were also included.
3 The multivariable model was further adjusted for nutrients or for specific subgroups of participants.
4 Nutrients included were dietary folate, calcium, glycemic load, isoflavone, magnesium and cereal fibre, which are known to be associated with the risk of type 2 diabetes.
The within-group DDS analyses (Table 3) showed inverse associations between T2D and diversity within specific food groups. The DDS for ‘Milk and Dairy products’ was inversely associated with T2D risk in both men (Q4 v. Q1: IRR = 0·69, 95 % CI = 0·53–0·90, p linearity = 0·0162) and women (Q4 v. Q1: IRR = 0·70, 95 % CI = 0·54–0·92, p linearity = 0·1322). The DDS for ‘Fruits’ was significantly and inversely associated with T2D risk in men (IRR = 0·70, 95 % CI = 0·52–0·94; p linearity = 0·0158), while the DDS for ‘Vegetables/Seaweed/Mushrooms’ was inversely associated with T2D risk in women (IRR = 0·73, 95 % CI = 0·55–0·97; p linearity = 0·575). No significant sex-related interactions were found for overall DDS (p for interaction = 0·308) or for the within-group DDS (all p > 0·05). Additional adjustment for the total quantity of the corresponding food group produced little change in most estimates; however, the association for ‘Fruits’ in men was attenuated, whereas that for ‘Vegetables/Seaweed/Mushrooms’ in women was strengthened, with wider CI for some estimates (Supplemental Table 4).
Type 2 diabetes incidence rate ratios and 95 % CI according to quartile (Q) of cumulative average within-group dietary diversity score

Table 3. Long description
The table presents data on the incidence rate ratios (IRR) and 95% confidence intervals (CI) for type 2 diabetes according to quartiles (Q) of cumulative average within-group dietary diversity scores (DDS) for various food groups. The table is divided into sections for different food groups: Grains and their products, Meat/Seafood/Eggs/Legumes/Nuts, Vegetables/Seaweed/Mushrooms, Fruits, and Milk and Dairy products. Each section includes median values, cases of new-onset type 2 diabetes, person-years of follow-up, age-adjusted models, and multivariable models for both men and women. For example, in the Grains and their products section, the median value for men in Q1 is 1.00 (0-20), with 78 cases of new-onset type 2 diabetes and 5,708 person-years of follow-up. The age-adjusted model for men in Q1 is 1.00 (0.59-1.03), and the multivariable model is also 1.00 (0.62-1.07). Similar detailed data is presented for other food groups and for women. The table highlights the inverse associations between DDS and type 2 diabetes risk in specific food groups for both men and women.
1 P values for linear trend were obtained using a modified Poisson regression with a robust error estimator, which treated the median value of each score category as a continuous variable.
2 All multivariable models were adjusted for age (years), higher education (≥12 years of education), regular exercise (≥3 times/week and ≥30 min/session), alcohol consumption (mL/day), BMI (kg/m2), baseline fasting blood glucose (mg/dL) and total energy intake (kcal/day). Additionally, smoking status (never, past, or current) in men and current smoking status (yes or no) in women were also included.
Figure 1 illustrates dietary diversity patterns among participants with radar charts. Panels A (men) and B (women) show that participants with high overall DDS (>4·0 to 5·0) had higher within-group DDS across all five food groups compared with those with low overall DDS (0 to 3·0) in both sexes. Panels C (men) and D (women) further highlight specific within-subgroup DDS contributions to within-group dietary diversity, such as nuts within the ‘Meat/Seafood/Eggs/Legumes/Nuts’ and mushrooms within the ‘Vegetables/Seaweed/ Mushrooms’.
Radar charts of within-group and within-subgroup dietary diversity scores (DDS) according to cumulative average overall DDS category, by sex. (A) Men and (B) women, five within-group DDS; (C) men and (D) women, 18 within-subgroup DDS. Dashed lines denote participants in the lowest overall DDS category (0 to 3·0) and solid lines those in the highest category (> 4·0 to 5·0). Values are expressed as a percentage of the corresponding sex-specific population mean (mean = 100 %). In panels C and D, the shaded sectors indicate the five major food groups to which each subgroup belongs.

Figure 1. Long description
Panel A: Radar chart for men with five within-group dietary diversity scores (DDS). The axes represent different food groups: Grains and their products, Vegetables/Seaweed/Mushrooms, Meats/Seafoods/Nuts/Eggs, Fruits, and Milk and Dairy products. Dashed lines denote participants in the lowest overall DDS category (0 to 3.0), and solid lines denote those in the highest category (> 4.0 to 5.0). Values are expressed as a percentage of the corresponding sex-specific population mean (mean = 100%). Panel B: Radar chart for women with five within-group DDS, following the same structure and labels as Panel A. Panel C: Radar chart for men with 18 within-subgroup DDS. The axes represent various food subgroups, with shaded sectors indicating the five major food groups. Panel D: Radar chart for women with 18 within-subgroup DDS, following the same structure and labels as Panel C.
Discussion
In this large population-based prospective cohort, higher dietary diversity, assessed using cumulative average overall DDS, was associated with a lower risk of T2D in both men and women. Within-group DDS analyses further demonstrated inverse associations for ‘Milk and Dairy products’ in both men and women, for ‘Fruits’ in men and for ‘Vegetables/Seaweeds/Mushrooms’ in women. Although the inverse association between overall DDS and T2D risk tended to be more pronounced in men, no significant sex-related interactions were observed. These findings provide new evidence from an Asian population with repeated dietary assessments.
There have been a few studies on the associations between dietary diversity and T2D risk. Among them, the EPIC-Norfolk(Reference Conklin, Monsivais and Khaw13) and, more recently, the multi-country EPIC-InterAct study(Reference Mozaffari, Imamura and Murphy30) reported an inverse association between total dietary diversity and T2D risk, whereas other Western cohorts using single-time dietary assessments found null associations (the Whitehall II study(Reference Masset, Scarborough and Rayner14) and the Multi-Ethnic Study of Atherosclerosis(Reference Otto, Padhye and Bertoni15)). Beyond T2D, evidence regarding dietary diversity and glucose metabolism-related outcomes also remains limited. For instance, the Nurses’ Health Study II found no associations between dietary diversity indices – the Minimum Dietary Diversity for Women and the Food Diversity Index – and the risk of gestational diabetes mellitus(Reference Gicevic, Gaskins and Fung31). In the present study, we found an inverse association between overall DDS and T2D risk, consistent with the findings of the EPIC-Norfolk study(Reference Conklin, Monsivais and Khaw13) and the more recent EPIC-InterAct study, in which consuming all five major food groups was associated with lower T2D incidence across European countries(Reference Mozaffari, Imamura and Murphy30). That study reported a significant association in women but not in men, whereas we observed inverse associations in both sexes; however, neither study detected significant sex modification (p = 0·58 and p = 0·308, respectively), and the sex-specific estimates in EPIC-InterAct were nearly identical (0·84 in men, 0·86 in women), suggesting that the difference in statistical significance may reflect differences in precision rather than sex-specific effects. Considering that previous Western cohort studies relying on single-time dietary assessments reported null associations with T2D(Reference Otto, Padhye and Bertoni15), the use of repeated dietary assessments in our study may have helped minimise measurement errors(Reference Hu, Stampfer and Rimm16), which could partly contribute to the consistency and robustness of the observed associations.
As for within-group DDS, the EPIC-Norfolk study showed inverse associations between specific within-group diversity metrics – dairy, fruit and vegetable diversity – and T2D risk(Reference Conklin, Monsivais and Khaw13). Consistent with these findings, we observed inverse associations for ‘Milk and Dairy products’ in both men and women, for ‘Fruits’ in men and for ‘Vegetables/Seaweeds/ Mushrooms’ in women, despite differences in dietary assessment methods(Reference Conklin, Monsivais and Khaw13,Reference Cooper, Sharp and Lentjes32) . In contrast, the Multi-Ethnic Study of Atherosclerosis study, which assessed within-group diversity of fruits and vegetables based on the number of different items consumed more than once per week as reported in an FFQ, found no significant associations with T2D risk(Reference Otto, Padhye and Bertoni15). We also analysed the associations between 18 specific food subgroups and T2D risk (data not shown). A recent scoping review identified 114 within-group dietary diversity measures and reported substantial variation in the food groups assessed, individual food items included and score ranges(Reference Conklin, Novakovic and Ip33). Notably, all fifteen validated within-group measures identified in the review used individual food items as the scoring unit. Thus, although our classification was based on the KDRI rather than the FAO subgroup structure, our item-based approach to measuring diversity within major food groups is consistent with approaches used in the broader literature. Nevertheless, differences in food group and subgroup definitions across studies should be considered when comparing findings. Although no previous studies have comprehensively examined subgroup-level DDS for direct comparison, prior hypothesis-driven research has consistently suggested that ‘Nuts,’ ‘Mushrooms’ and ‘Seaweeds’ may lower T2D risk(Reference Jenkins, Hu and Tapsell34–Reference Brown, Allsopp and Magee36). Our previous analyses also demonstrated inverse associations of mushroom intake with T2D risk(Reference Kim, Woo and Shin37) and of seaweed intake with blood glucose concentration(Reference Park, Woo and Kim38).
The mechanisms underlying the inverse associations of DDS and T2D remain unclear; however, several potential pathways can be postulated. First, dairy diversity, which was identified as a key contributor to lower T2D risk in both our study and the EPIC-Norfolk study, may exert beneficial metabolic effects through multiple mechanisms. Dairy products provide various components such as whey proteins, peptides and bioactive compounds that collectively improve insulin sensitivity and glucose homeostasis(Reference Agagündüz, Yilmaz and Cemali39). Fermented dairy products, in particular, contain probiotics and bioactive peptides that may modulate the gut microbiota, reduce systemic inflammation and may lower T2D risk(Reference Agagündüz, Yilmaz and Cemali39). These biological effects could partially explain the consistent inverse associations observed for ‘Milk and Dairy products’ in both men and women. Second, the protective effects of diverse fruits and vegetables against T2D risk may be explained by their high content of dietary fibre, essential micronutrients, and bioactive compounds such as flavonoids, carotenoids, vitamin C and phytochemicals(Reference Conklin, Monsivais and Khaw13,Reference Cooper, Sharp and Lentjes32,Reference Bernstein, Tucker and Ryan40–Reference Hozawa, Jacobs and Steffes42) . Fibre-rich foods, including fruits and vegetables, have been associated with greater gut microbial diversity(Reference Hamamah, Iatcu and Covasa43), which is linked to improved metabolic health(Reference Claesson, Jeffery and Conde44,Reference Xiao, Wang and Su45) . They may also influence the production and metabolism of secondary bile acids, such as glycodeoxycholic acid and taurodeoxycholic acid, that have been positively associated with insulin resistance and inflammatory markers including IL-8 and tumour necrosis factor α (Reference Xiao, Wang and Su45,Reference Chen, van den Munckhof and Schraa46) . Furthermore, greater dietary diversity ensures a broader intake of essential nutrients and micronutrients, thereby improving overall nutrient adequacy and metabolic health(Reference Verger, Le Port and Borderon47). Third, nuts and mushrooms contributed substantially to the within-group DDS, providing a rich array of essential nutrients and bioactive compounds not typically obtained from other food groups, as observed in the comparison between high- and low-DDS categories(Reference Ros48,Reference Muszynska, Grzywacz-Kisielewska and Kala49) .
However, energy-dense food groups, such as ‘Grains and their products’ and ‘Meat, seafood, eggs, legumes and nuts’, showed U- or inverted J-shaped associations with T2D risk, with inverse associations observed in intermediate, but not the highest, categories. When analysing subgroups, particularly within the ‘Grains and their products’ group, some unexpected findings were also noted. These results suggest that although the overall DDS may seem crude, it provides a simple yet consistent framework for developing dietary recommendations to prevent T2D. Compared with complex within-group or subgroup-specific diversity indices, the overall DDS offers a more practical and potentially effective approach. This is particularly relevant because excessive dietary diversity within certain energy-source food groups may elevate total energy intake, reduce overall diet quality and lead to weight gain, especially among middle-aged adults(Reference de Oliveira Otto, Anderson and Dearborn50).
This study has several limitations that should be considered when interpreting our findings. First, although repeated data from a validated FFQ were used, the questionnaire could not fully capture dietary diversity due to the limited number of items and the inability to distinguish subtypes within specific categories (e.g. whole v. refined grains). In addition, although averaging repeated FFQ reduces random within-person variation, it does not mitigate systematic measurement error inherent to dietary assessment, such as social desirability bias and underreporting, which may be correlated within individuals over time. Cumulative averaging may also attenuate meaningful changes in dietary behaviour because it characterises long-term average exposure rather than dietary change itself. Second, although the DDS provides a simplified whole-diet index that can serve as a practical public-health guideline, it does not capture the complex interrelationships among food groups – such as how foods are combined, substituted, or balanced within meals – to shape overall dietary patterns(Reference Hu51). Moreover, each food item contributes one point regardless of its metabolic properties, so the score reflects dietary variety rather than dietary quality. Since the risk of T2D is influenced not only by the number of different foods consumed but also by the balance between nutrient-dense and energy-dense foods, this limitation may have led to an underestimation of diet quality differences related to metabolic health. Third, the absence of a standardised method for quantifying dietary diversity complicates cross-study comparisons(Reference Ruel52). Despite extensive statistical adjustments and multiple sensitivity analyses, residual confounding from unmeasured variables, such as genetic predisposition, overall dietary quality or detailed socioeconomic status, cannot be completely ruled out. Moreover, because this was an observational cohort study, causality cannot be established, and other health-conscious behaviours associated with greater dietary diversity may have contributed to the observed associations. Selection bias is another consideration. Participants excluded because of missing covariate data represented only 2·5 % of those eligible (n 440) and differed from those included in sex distribution and regular exercise. In addition, women retained through the second re-visit had slightly higher dietary diversity than those lost to follow-up earlier (3·56 v. 3·48 on a 0–5 scale), whereas no such difference was observed among men. However, estimates restricted to participants who completed all three examinations were similar to those from the main analysis (Table 2 and Supplemental Table 4), suggesting that differential loss to follow-up was unlikely to materially affect our findings, although some residual selection bias cannot be excluded. Lastly, as the study population consisted exclusively of Korean adults aged ≥40 years, the findings may not be directly generalisable to populations with different genetic, dietary or cultural backgrounds. However, given that evidence on dietary diversity and T2D risk has been largely derived from Western populations, these results provide valuable insights from an Asian cohort with distinct dietary patterns. Despite these limitations, this study is, to our knowledge, the first to examine the associations of cumulative average overall and within-group DDS with T2D risk.
Our findings suggest that a higher cumulative average overall DDS is associated with a lower risk of T2D. In addition, greater diversity within specific food groups, particularly ‘Milk and Dairy products’ in both men and women, ‘Fruits’ in men and ‘Vegetables/Seaweeds/Mushrooms’ in women, may also be beneficial. These results support public-health recommendations that emphasise the importance of dietary variety, particularly focusing on nutrient-dense rather than energy-dense foods (e.g. fruits, vegetables and dairy), to prevent T2D.
Supplementary material
For supplementary material/s referred to in this article, please visit https://doi.org/10.1017/S0007114526108733
Data availability statement
The data described in the manuscript, code book and analytic code will not be made publicly available because of data protection regulations of the Korea Disease Control and Prevention Agency (KDCA) and the cohorts involved. Access to KoGES–CAVAS data may be requested from the KDCA.
Acknowledgements
The authors thank the participants and research staff of the Multi-Rural Communities Cohort, the Atherosclerosis Risk of Rural Areas in the Korean General Population cohort and the Kangwha cohort of the KoGES–CAVAS for their contributions to this study.
Financial support
This work was supported by research funds from the Korea Centers for Disease Control and Prevention (2004-E71004-00, 2005-E71011-00, 2006-E71009-00, 2007-E71002-00, 2008-E71004-00, 2009-E71006-00, 2010-E71003-00, 2011-E71002-00, 2012-E71007-00, 2013-E71008-00, 2014-E71006-00, 2014-E71006-01, 2016-E71001-00 and 2017N-E71001-00).
Author contributions
Formal analysis: MK and HWW. Writing – original draft: MK, HWW and MKK. Writing – review and editing: HWW, MK, MHS, SBK, HCK, YMK, and MKK. Methodology: HWW and MKK. Investigation: HWW, MHS, SBK, HCK, YMK, and MKK. Funding acquisition: MHS, SBK, HCK, and MKK. Supervision: MKK.
Competing interests
The authors declare that they have no conflicts of interest.
Ethical statement
This study was conducted according to the guidelines laid down in the Declaration of Helsinki, and all procedures involving human subjects were approved by the Institutional Review Board of Hanyang University (HYUIRB-202106-005). The original cohort protocols were approved by the Institutional Review Boards of Hanyang University, Chonnam National University, and Keimyung University for the Multi-Rural Communities Cohort; Yonsei University Wonju College of Medicine for the Atherosclerosis Risk of Rural Areas in the Korean General Population; and Yonsei University College of Medicine for the Kangwha cohort. Written informed consent was obtained from all participants.


 Open access

