INTRODUCTION
Fire is integral to forest ecosystems in the Great Basin of the United States and much of the U.S. Intermountain West. Fire is a determining factor governing forest structure (Kane et al., Reference Kane, North, Lutz, Churchill, Roberts, Smith and McGaughey2014), while also influencing soil quality and composition and nutrient availability (Morris et al., Reference Morris, Mueller, Nurse, Long and McLauchlan2014, Reference Morris, McLauchlan and Higuera2015; Schlesinger, et al., Reference Schlesinger, Dietze, Jackson, Phillips, Rhoades, Rustad and Vose2016) and biotic community composition (Johnstone et al., Reference Johnstone, Allen, Franklin, Frelich, Harvey, Higuera and Mack2016). The structure and composition of many subalpine ecosystems in the western United States are influenced by fire (Coop and Shoettle, Reference Coop and Schoettle2009). These environments are also sensitive to climatic changes, offering the opportunity for researchers to potentially address how high-elevation ecosystems have responded to past intervals of prolonged warmth, drought, and changes in fire regime (Westerling et al., Reference Westerling, Hidalgo, Cayan and Swetnam2006; Reinemann et al., Reference Reinemann, Porinchu, Bloom, Mark and Box2009, Reference Reinemann, Porinchu, MacDonald, Mark and DeGrand2014; Porinchu et al., Reference Porinchu, Reinemann, Mark, Box and Rolland2010; Kitchen, Reference Kitchen2012, Reference Kitchen2016). For example, it has been hypothesized that the warmer, more arid conditions that characterized the western United States during the Medieval Climate Anomaly (MCA) would have resulted in higher fire frequencies and/or more severe wildfires (Marlon et al., Reference Marlon, Bartlein, Gavin, Long, Anderson, Briles and Brown2012). Understanding fire regimes has been made more urgent given the two recent wildfires in Great Basin National Park (GRBA): the Black Fire (2013) and the Strawberry Creek Fire (2016). Unfortunately, the historical record is not long enough to fully capture how climatic variability influences fire frequency and severity. Longer, millennial-scale records of fire history from specific sites are required to document climate–fire interactions on decadal to centennial time scales (Williams et al., Reference Williams, Cook, Smerdon, Cook, Abatzoglou, Bolles, Baek, Badger and Livneh2020).
Expanding our perspective on the sensitivity of vegetation communities to hydroclimate variability and fire in the Great Basin is particularly useful in the context of the ongoing climatic erraticism (see Loisel et al. Reference Loisel, MacDonald and Thomson2017) observed in the U.S. Southwest and projected regional warming (Loisel et al., Reference Loisel, MacDonald and Thomson2017; USGCRP, 2017; Williams et al., Reference Williams, Cook, Smerdon, Cook, Abatzoglou, Bolles, Baek, Badger and Livneh2020). In recent decades, higher temperatures, reduced snowpack, and a persistent drying trend have altered the seasonality, frequency, and severity of forest fires in the western United States (Westerling et al., Reference Westerling, Gershunov, Brown, Cayan and Dettinger2003, Reference Westerling, Hidalgo, Cayan and Swetnam2006; Westerling, Reference Westerling2016). Sustainable conservation of forest ecosystems in the Great Basin requires an informed understanding of the complex relationship between forest ecosystems and fire, and how this relationship may change in the future. Paleoenvironmental reconstructions of climate, fire regimes, vegetation and forest community structure, and terrestrial and aquatic biogeochemistry provide valuable baseline information that can be used to improve our ability to manage forest ecosystems in light of projected climate change (IPCC, Reference Stocker, Qin, Plattner, Tignor, Allen, Boschung, Nauels, Xia, Bex and Midgley2013).
The Great Basin has been the focus of much climatic and paleoenvironmental research over recent years (Mensing et al., Reference Mensing, Benson, Kashgarian and Lund2004, Reference Mensing, Livingston and Barker2006, Reference Mensing, Smith, Norman and Allan2008, Reference Mensing, Sharpe, Tunno, Sada, Thomas, Starratt and Smith2013; Reinemann et al., Reference Reinemann, Porinchu, Bloom, Mark and Box2009, Reference Reinemann, Porinchu, MacDonald, Mark and DeGrand2014; Salzer et al., Reference Salzer, Bunn, Graham and Hughes2014; Wahl et al., Reference Wahl, Starratt, Anderson, Kusler, Fuller, Wan and Olson2015). These studies have demonstrated that regional hydroclimate has behaved erratically during portions of the late Holocene. Importantly, much potential lies in using past intervals of what Loisel et al. (Reference Loisel, MacDonald and Thomson2017) refer to as “erratic” climate, such as the MCA (AD 900–1300; Meko et al., Reference Meko, Woodhouse, Baisan, Knight, Lukas, Hughes and Salzer2007) or the Little Ice Age (LIA, AD 1400–1700; Mann et al., Reference Mann, Zhang, Rutherford, Bradley, Hughes, Shindell and Ammann2009), as potential analogs of future climate for the region. Here, we present a quantitative reconstruction of the last two millennia of vegetation change, fire history, and sediment geochemistry at Stella Lake (a small tarn located in a subalpine environment within GRBA), paying particular attention to the MCA and LIA. We make use of sedimentary charcoal to reconstruct fire history; C/N, δ13C, and δ15N to document whether evidence of discrete fire events is discernable in the sedimentary geochemical record; and fossil pollen to construct a record of vegetation composition and change. We assess the correspondence between changing thermal conditions (inferred from subfossil chironomids), hydroclimate variability, and wildfire activity. These paleoecological records are compared to determine: the fire history of the last two millennia; how the subalpine vegetation community has responded to fire; and whether evidence of fire and vegetation change is expressed in lake sediment geochemistry. These records are then discussed in the context of existing regional paleoecological records of late Holocene climate, fire, and vegetation change.
STUDY AREA
Climate
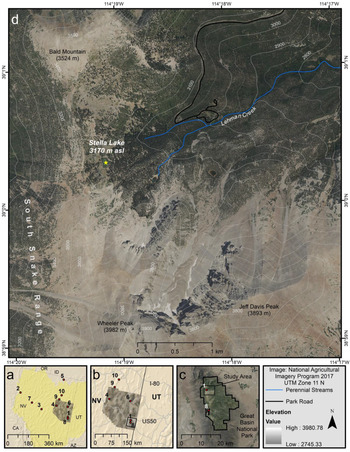
Great Basin National Park is located in the southern Snake Range of the central Great Basin (Fig. 1). The Great Basin is a hydrologically closed, arid region of the western United States characterized by multiple north-south trending ridges, created through stretching of the continental crust (Miller et al., Reference Miller2007). The majority of the region's precipitation falls as snow during the winter months with a lesser amount supplied by convective thunderstorms in the summer (Mock, Reference Mock1996). The climatology of the Great Basin is influenced by atmospheric and oceanic conditions in the eastern tropical Pacific Ocean (Shin et al., Reference Shin, Sardeshmukh, Webb, Oglesby and Barsugli2006). The influence of the El Niño–Southern Oscillation (ENSO) on general circulation patterns and the synoptic climatology of the region makes ENSO the most significant driver of interannual climate variability in the Great Basin (Redmond and Koch, Reference Redmond and Koch1991). Interannual climate variability is also driven by changes in atmospheric dynamics over the northern Pacific Ocean (Wise, Reference Wise2012). Regional precipitation differs by longitude due to the influence of the Sierra Nevada rain shadow. The western Great Basin is drier relative to the central and eastern Great Basin (Xue et al., Reference Xue, Tang, Sun, Wu, Liu and Dou2017), which receive a larger proportion of precipitation in the spring and summer (Western Regional Climate Center, 2008). On a smaller spatial scale, local climatology is driven largely by local topography, as significant temperature and precipitation gradients are associated with elevation (Patrick, Reference Patrick2014) and additional local and regional effects such as rain shadow, aspect, and monsoon status (Shin et al., Reference Shin, Sardeshmukh, Webb, Oglesby and Barsugli2006). A highly spatially resolved gridded climate data set provides robust estimates of local, mean annual precipitation ranging from less than 210 mm in the southern Snake Valley to more than 810 mm along the crest of the Snake Range (1971–2000; PRISM Climate Group, 2014). At GRBA, the mean temperature ranges between 13.5°C (June/July/August; summer) and −7°C (December/January/February; winter) in the high elevations (~3000 m above sea level [m asl]) of the park, while temperature in lower elevations of the park (~2000 m asl) range between 20°C (summer) and −1°C (winter) (Western Regional Climate Center, 2008; Sambuco et al., Reference Sambuco, Mark, Patrick, DeGrand, Porinchu, Reinemann, Baker and Box2020).
Study area and site map: (a) the location of White Pine County, NV (image) (taken from UTM Zone 11; National Agricultural Imagery Program, 2017, https://www.fsa.usda.gov/programs-and-services/aerial-photography/imagery-programs/naip-imagery/index, accessed October 1st, 2017) and the hydrologic Great Basin (shaded yellow) along with locations of paleoecological study sites referenced in the discussion (numbered red dots): (1) Stella Lake (Reinemann et al., Reference Reinemann, Porinchu, Bloom, Mark and Box2009, Reference Reinemann, Porinchu, MacDonald, Mark and DeGrand2014); (2) Pyramid Lake (Benson et al., Reference Benson, Kashgarian, Rye, Lund, Paillet, Smoot and Kester2002; Mensing et al., Reference Mensing, Benson, Kashgarian and Lund2004); (3) Kingston Meadow (Mensing et al., Reference Mensing, Smith, Norman and Allan2008); (4) Newark Valley Pond (Mensing et al., Reference Mensing, Livingston and Barker2006, Reference Mensing, Smith, Norman and Allan2008); (5) Mission Cross Bog (Mensing et al., Reference Mensing, Smith, Norman and Allan2008); (6) Stonehouse Meadow (Mensing et al., Reference Mensing, Sharpe, Tunno, Sada, Thomas, Starratt and Smith2013); (7) Sheep Mountain (Salzer et al., Reference Salzer, Bunn, Graham and Hughes2014); (8) Washington Peak (Salzer et al., Reference Salzer, Bunn, Graham and Hughes2014); (9) Pearl Peak (Salzer et al., Reference Salzer, Bunn, Graham and Hughes2014); (10) Favre Lake (Wahl et al., Reference Wahl, Starratt, Anderson, Kusler, Fuller, Wan and Olson2015); (b) the location of the southern Snake Range (box) within White Pine County; (c) the location of the western Lehman Creek drainage within Great Basin National Park; (d) the location of Stella Lake within the Lehman Creek drainage (yellow star depicts 2009 coring location. (For interpretation of the references to color in this figure legend, the reader is referred to the web version of this article.)

Study Site
The lake sediment record analyzed and discussed in this research was extracted from Stella Lake, NV (39°00.324′N, 114°19.140′W, 3170 m asl; Fig. 1). The lake is a relatively small (1.5 ha), shallow (1.0 m at coring site) glacial tarn, located on the eastern edge of the ridge between Wheeler Peak to the south (3982 m asl) and Bald Mountain (3524 m asl) to the north. The lake has no distinct inlet and is fed primarily through snowmelt, with minor groundwater input (Porinchu et al., Reference Porinchu, Reinemann, Mark, Box and Rolland2010). The lake also has no clear outflow; given the lake's proximity to the headwaters of the Lehman Creek drainage, it is likely that, at higher lake levels, water would have spilled northward into Lehman Creek (Reinemann et al., Reference Reinemann, Porinchu, Bloom, Mark and Box2009). The underlying geology of Stella Lake consists of Cenozoic Prospect Mountain Quartzite and Osceola Argillite of the McCoy Creek Group, overlain by Quaternary glacial deposits (Miller et al., Reference Miller2007). The primary canopy vegetation present in the catchment consists of Picea engelmannii (Engelmann spruce) and Pinus flexilis (limber pine), with Populus tremuloides (quaking aspen), Abies concolor (white fir), Psuedotsuga menziesii (Douglas fir), and Juniperus communis (common juniper) also common (Cogan et al., Reference Cogan, Taylor and Schulz2012). The vegetation understory consists of various subalpine shrubs, sedges, and grasses, including Symphoricarpos oreophilus (mountain snowberry), Ericameria discoidea (whitestem goldenbush), Carex rossii (Ross’ sedge), and various species of bluegrasses (Cogan et al. Reference Cogan, Taylor and Schulz2012). At lower elevations, Pinus monophylla (single-leaf pinyon), Juniperus osteosperma (Utah juniper), Cercocarpus ledifolius (curl-leaf mountain-mahogany), and Artemisia tridentata (mountain big sagebrush) are common (Cogan et al., Reference Cogan, Taylor and Schulz2012).
METHODS
Sediment Core Recovery
A Holocene sediment core was extracted from Stella Lake on August 7, 2009, by researchers from the Ohio State University (OSU) and University of Georgia (UGA). The sediment core was extracted using a modified Livingstone piston corer, deployed from a secured floating platform. Multiple drives were taken at overlapping depth intervals to ensure the continuity of the stratigraphic sequence. A plastic tube was used to recover a 71 cm core consisting of the flocculent uppermost sediment with an intact sediment–water interface. A stainless-steel barrel was used to collect the subsequent sediment cores. The team collected six overlapping sediment core segments totaling 3.35 m. The last 2 ka, which are the focus of this study, are captured in the upper 85 cm. The upper 55 cm of sediment in the plastic tube was described, sectioned at 0.25 cm intervals, and placed into Whirl-Paks© in the field. The sediment between 50 and 52 cm was lost during the sectioning process. The remainder of the sediment in the plastic tube (56 to 71 cm) was extruded and sealed in plastic wrap and aluminum foil. The remaining sections of the GB-SL-09 core were extruded with the visual stratigraphy described and recorded in the field, during extraction. The core sections were then sealed in plastic wrap and aluminum foil for transfer to OSU. In the lab, the cores were split, described in further detail, photographed, and refrigerated. In 2015, the GB-SL-09 core was transferred to the Environmental Change Lab at the UGA Geography Department for additional analyses.
Chronology
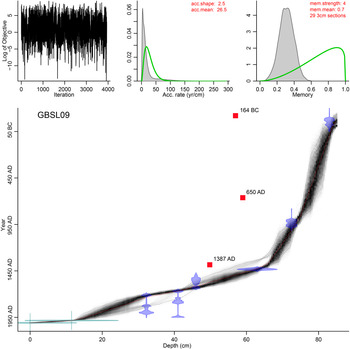
The radiocarbon analysis was conducted at the Center for Applied Isotope Studies (CAIS) at UGA. Radiocarbon dates (14C yr BP) were converted to calibrated ages (cal yr BP) using the IntCal13 (Reimer et al., Reference Reimer, Bard, Bayliss, Beck, Blackwell, Ramsey and Buck2013) calibration curve. One radiocarbon date returned as “modern” and was calibrated using the IntCal13 curve and the pMC (percent modern carbon) value in the open-source calibration program, OxCal 4.3 (Bronk Ramsey, Reference Bronk Ramsey2009). The open-source R package, BACON v. 2.2 (Bayesian Accumulation Model; Blaauw and Christen, Reference Blaauw and Christen2011) was used to produce the age–depth model for the GB-SL-09 core. BACON, which relies on Bayesian statistics, utilizes IntCal13 (Reimer et al., Reference Reimer, Bard, Bayliss, Beck, Blackwell, Ramsey and Buck2013) and the calibration curves associated with the given dates to derive sediment accumulation rates based on a gamma autoregressive process (Blaauw and Christen, Reference Blaauw and Christen2011). The BACON program was run using a gamma distribution (shape 2.5) for the sedimentation rate; the mean sedimentation rate input was estimated to be 26.5 yr/cm. The surface of the core was set to AD 2009 ± 1. The program's output includes a goodness of fit for each depth, with the age reported as calibrated ages (cal yr BP). The output, which provided best-estimate dates (cal yr BP) at 0.25 cm depth intervals, was converted to AD year for plotting and interpretation.
Pollen Analysis
Forty-eight sediment samples (1.0 cm3) were removed for pollen analysis using a needleless syringe. Samples were taken at depth intervals ranging between 0.50 cm and 5.75 cm, with higher sampling resolution undertaken for portions of the core where more detail was desired. The methodology used to isolate pollen grains from the sediment followed standard chemical digestion procedures, with the exception that the sediment samples were not sieved before chemical digestion (Faegri and Iversen, Reference Faegri, Iversen, Faegri, Kaland and Krzywinski1989). Lycopodium spores (batch no. 1031, Lund University, Sweden; 20,848 ± 3457 spores/tablet) were added to each sample to allow for calculations of pollen concentrations and influx (Stockmarr, Reference Stockmarr1971; Supplementary Figs. S1 and S2). Samples were mounted on glass microscope slides using 20 cm2/s silicon oil. Pollen grains and Pediastrum colonies were counted at 400× magnification. Pollen samples were enumerated using a minimum pollen sum of 400 terrestrial pollen grains, where possible. This goal was not achieved for two samples (53.25 cm and 57.25 cm), as pollen concentrations were very low in these samples. For these two samples, a minimum of 300 terrestrial pollen grains was counted. Pollen spores were identified to the highest determinable taxonomic resolution using reference material supplied by George A. Brook (UGA), the University of Nevada–Reno Geography Palynology Lab, established pollen reference keys (Moore and Webb, Reference Moore and Webb1978; Kapp et al., Reference Kapp, King and Davis2000), and the online reference collection provided by the Global Pollen Project (https://globalpollenproject.org, accessed September 1st, 2019; Martin and Harvey, Reference Martin and Harvey2017).
Pollen percentages were calculated from the sum of all terrestrial pollen taxa. Arboreal taxa include Pinus, Picea, Abies, Populus, and Cupressaceae. The shrub layer includes Artemisia, Amaranthaceae, Asteraceae, Ephedraceae, and Salicaceae. Poaceae and Cyperaceae make up the grass/sedge layer. An index relating arboreal to non-arboreal pollen was calculated as (a − b)/(a + b), where a represents arboreal pollen (AP) and b represents non-arboreal pollen (NAP) (Morris et al., Reference Morris, Brunelle, Munson, Spencer and Power2012, Reference Morris, Brunelle, DeRose, Seppä, Power, Carter and Bares2013). The semiarid wetness index (SWI) was calculated as (A − B)/(A + B), where A represents Artemisia and B represents Amaranthaceae. Indices are reported in standard units (SU). The SWI is a modification of the commonly used Artemisia/Chenopodiaceae (A/C) ratio (Mensing et al., Reference Mensing, Benson, Kashgarian and Lund2004; Morris et al., Reference Morris, Brunelle, DeRose, Seppä, Power, Carter and Bares2013). Here we use Amaranthaceae as the denominator, as Chenopodiaceae is now classified as a subgroup of the Amaranthaceae family by the Angiosperm Phylogeny Group (see Chase et al., Reference Chase, Christenhusz, Fay, Byng, Judd, Soltis and Mabberley2016). The A/C ratio has been used as a qualitative proxy for annual growing season moisture availability in arid and semiarid, regions because Artemisia requires more growing season moisture than Chenopodiaceae (Mensing et al., Reference Mensing, Benson, Kashgarian and Lund2004; Herzschuh, Reference Herzschuh2007; Morris et al., Reference Morris, Brunelle, Munson, Spencer and Power2012, Reference Morris, Brunelle, DeRose, Seppä, Power, Carter and Bares2013; Zhao et al., Reference Zhao, Liu, Li, Huang, Sun, Zhao and Herzschuh2012). Detrended canonical correspondence analysis (DCCA) was also conducted, with detrending-by-segments and down-weighting of rare taxa, to estimate vegetation composition change or turnover (beta diversity; Birks, Reference Birks2007).
Charcoal Analysis
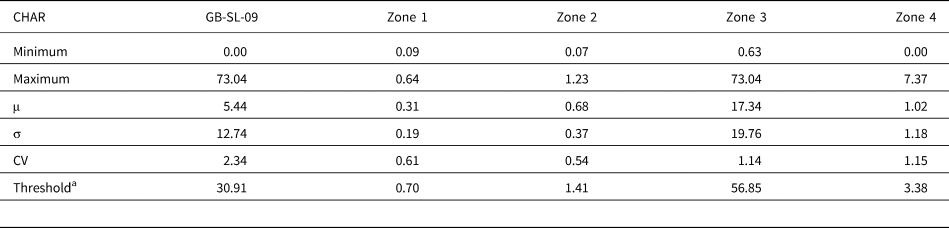
Macroscopic charcoal was analyzed using the protocol available from the Limnological Research Center at the University of Minnesota (http://lrc.geo.umn.edu/laccore/procedures.html, accessed December 1st, 2018). Contiguous samples consisting of 2 cm3 of sediment for charcoal analysis were sampled at 1.0 cm resolution between 0 cm and 29 cm, and contiguous samples consisting of 1 cm3 of sediment were sampled at 0.50 cm intervals between 29 cm and 84 cm to account for changes in sedimentation. By processing 1 cm3 at 0.50 cm intervals, the total volume of sediment processed at 1 cm intervals was kept at 2 cm3 (consistent with the upper 29 cm of the core). This protocol was designed specifically for isolating charcoal >125 μm from lacustrine sediment. For the upper 29 cm of the GB-SL-09 core, 0.50 cm3 was removed from four contiguous 0.25 cm sections and washed into clean, labeled 100 mL beakers using deionized water (DI). For the remaining sections, 0.50 cm3 was removed from each of two contiguous 0.25 cm sections and washed into a 100 mL beaker. This ensured that an equal volume of sediment was analyzed throughout the core, despite the differing depth intervals. Each sample was treated with 25 mL of dilute hydrogen peroxide (6% H2O2) to disaggregate the sediment and blanch organic matter. The beakers were sealed with aluminum foil to prevent contamination and placed in a drying oven at 40°C for 24 hours. Heating the samples serves to expedite the blanching of organic matter. Samples were washed sequentially through 125 μm and 250 μm sieves, using DI. The remaining material was transferred into labeled petri dishes using DI. Two milliliters of sodium hexametaphosphate (0.5% (NaPO3)6) was added to each petri dish, and the samples were placed in a drying oven at 40°C to evaporate any remaining DI. Charcoal fragments were counted using a gridded counting sheet at 100×. Charcoal belonging to each size fraction (125–250 μm and >250 μm) were counted by depth and classified into one of the three charcoal morphotypes: wood, grass, or lattice (Walsh et al., Reference Walsh, Whitlock and Bartlein2008; Supplementary Fig. S3). Charcoal accumulation rates (CHAR; n/cm2/yr, where n is the total number of charcoal particles counted in a sample) were calculated by dividing charcoal concentration (n/cm3) by the number of years per sample (yr/cm). Whole-core statistics (min, max, μ, σ, and coefficient of variance [CV]) were calculated based on CHAR values. Two-sigma CHAR anomalies (CHAR > μCHAR + 2(σ)), occurring in consecutive samples, with less than 20 years separating the samples, were used as the criteria to identify intervals characterized by anomalous charcoal fluxes, which are inferred to reflect “large-magnitude” fire events.
Geochemical Analyses
A total of 120 bulk sediment samples were prepared for geochemical analyses of %C, %N, C/N, δ13C (‰ vs. Vienna Pee Dee Belemnite), and δ15N (‰ vs. air). Samples (0.5 cm3 each) were analyzed at 1.0 cm resolution from 0 cm to 62 cm, 0.50 cm resolution from 63 cm to 64 cm, and 0.25 cm resolution from 64 to 85 cm. The 0.5 mL samples were placed in crucibles and dried in an oven at 40°C for 48 hours to ensure evaporation of any water and then homogenized using a ball mill. The homogenized sediment samples were placed into plastic, labeled vials and freeze-dried for a minimum of 24 hours. Approximately 10–15 mg of freeze-dried sediment from each sample was weighed using a microbalance and placed into silver capsules. Samples were tested for the presence of carbonate every 10 cm by using dilute hydrochloric acid (10% HCl); no reactions were noted. All geochemical analyses were conducted at the CAIS at UGA. A Thermo© Flash 1000 elemental analyzer coupled with a Thermo© Delta V isotope ratio mass spectrometer was used to determine quantitative measures of %C, %N, δ13C, and δ15N from the bulk sediment samples. Samples were analyzed along with reported NIST standards (NIST Bovine 1577c and NIST Spinach 1570a). Each of the CAIS Elemental Analysis-Isotope Ratio Mass Spectrometry (EA-IRMS) systems are required to pass internal certification tests of at least 20 replicates and provide better than 0.15‰ precision (standard deviation). The NIST Bovine and Spinach reference standards were analyzed with every 12 of the unknown bulk sediment samples.
RESULTS
Chronology
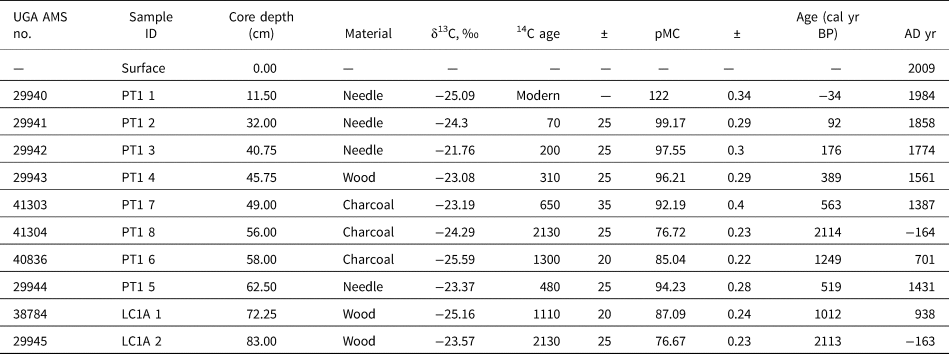
A total of 10 accelerator mass spectrometry (AMS) radiocarbon dates (Table 1) were obtained on the materials taken from the late Holocene portion of the GB-SL-09 core. The chronology for the last two millennia was established by setting the surface of the core to AD 2009 ± 1 and using seven AMS radiocarbon dates obtained on conifer needles (n = 4) and wood fragments (n = 3) (Fig. 2). The 14C dates based on bulk charcoal (n = 3) resulted in anomalously old ages and were excluded from the chronology. Radiocarbon dates taken from bulk charcoal pieces can be vulnerable to inbuilt error and “old wood” effects (Gavin, Reference Gavin2001). The dominant tree species in the Stella Lake catchment, Pinus flexilis and Picea engelmannii, are long-lived trees with life spans of approximately 1000 (Johnson, Reference Johnson2001) and 500 (Uchytil, Reference Uchytil1991) years, respectively. This increases the likelihood that the combusted wood was decades to centuries old at the time of the fire. The “inbuilt age” typically introduces bias, with the result that the 14C ages are older than the actual fire event (Waterbolk, Reference Waterbolk, Mook and Waterbolk1983).
Age–depth model for the sediment core from Stella Lake (gray) overlaid on the calibrated distributions of individual dates (blue). Gray dots indicate the model's 95% probability intervals, determined by BACON v. 2.2 (Blaauw and Christen, Reference Blaauw and Christen2011). 14C dates from bulk charcoal samples (red squares) were excluded from the model. The upper left inset shows the iteration history, the middle inset shows the prior (green line) and posterior (gray area) of the sediment accumulation rate (yr/cm), and the right inset shows the prior (green line) and posterior (gray area) of the memory. (For interpretation of the references to color in this figure legend, the reader is referred to the web version of this article.)

AMS 14C dates for the Stella Lake core.a

a All dates were provided by the University of Georgia (UGA) Center for Applied Isotope Studies (Athens, GA). 14C dates from bulk charcoal samples were excluded from the age–depth model. Ages in cal yr BP represent weighted mean 14C ages calibrated using IntCal13 (Reimer et al. Reference Reimer, Bard, Bayliss, Beck, Blackwell, Ramsey and Buck2013). The cal yr BP ages were converted to year AD by subtracting the midpoint cal yr BP age from AD 1950. AMS, accelerator mass spectrometry; pMC, percent modern carbon.
The BACON derived age–depth model (Fig. 2) indicates that the last two millennia at Stella Lake are represented in the upper 83 cm of sediment. The age–depth model indicates that sedimentation rates were relatively low during much of the first millennium AD. Sedimentation rates initially began to increase at approximately AD 900 (74.25 cm) and increased further at approximately AD 1370 (65.75 cm). Sedimentation rates remained high following AD 1370 and through the remainder of the core. The age–depth relationship and sampling intervals result in a multidecadal mean sample resolution between AD 1500 and AD 2009 and subcentennial mean sample resolution between AD 1500 and AD 1.
Pollen, Charcoal, and Geochemical Analyses
The results of the charcoal, geochemical, and palynological analyses have been divided into four zones based on a visual assessment of the timing of proxy-based inferences of environmental change. Stratigraphy and changes in sedimentation are also characterized by zone. Samples between 50 and 52 cm (AD 1550 to AD 1570) were lost during core sectioning; no data are available for these missing samples.
Zone 1 (83.00–76.00 cm; AD 1–750)
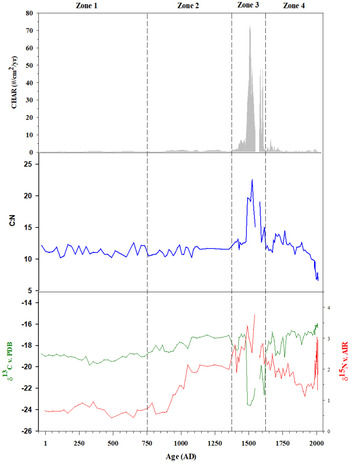
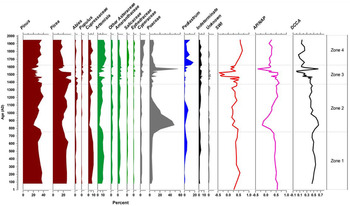
The stratigraphy of this portion of the core varied from light-brown, moderately organic sediment (76.00–77.50 cm), to dark-brown organic sediment (77.50–80.00 cm), to light-brown, less organic sediment (80.00–83.00 cm). Sedimentation rates were extremely low throughout this interval (μzone1 = 0.009 cm/yr). The CHAR values were also extremely low (CHARmax < 1 piece/cm2/yr) over the entirety of Zone 1 (Fig. 3, Table 2). Sediment geochemistry showed little variance through Zone 1 (Fig. 3, Supplementary Table S1). The vegetation community, as inferred from pollen in Zone 1, also showed little variation. Pinus represented between 29% and 40% (μzone1 = 34%; Fig. 4) of the total pollen deposited at Stella Lake and was the dominant canopy taxon during this time. Picea was the co-dominant canopy taxon and ranged between 20% and 30% (μzone1 = 25%). The pollen percentages of all arboreal taxa were relatively stable throughout Zone 1, with AP comprising an average of 70% of total terrestrial pollen during this interval. Shrub-layer pollen percentages were also relatively stable, with Artemisia the dominant taxon (μzone1 = 10%). Poaceae was the dominant taxon in the grass/sedge layer. Poaceae accounted for an average of less than 5% of total pollen over this interval but increased to 8% at approximately AD 750. AP/NAP remained relatively constant from AD 1 to AD 750 (μzone1 = 0.47; Fig. 5) but began decreasing at AD 750 in response to an increase in Poaceae. The SWI was low at AD 1 (0.23 SU; Fig. 5) but increased to near mean values by AD 100 (μzone1 = 0.40) and remained relatively stable throughout the remainder of this zone. DCCA axis 1 scores showed very little change, indicating that the vegetation community was characterized by limited turnover during this interval.
Observed changes in charcoal accumulation rates (CHAR; gray shading) and geochemical analyses of C/Nmass (blue line), δ15N (red line), and δ13C (green line) for Stella Lake, NV. (For interpretation of the references to color in this figure legend, the reader is referred to the web version of this article.)

Pollen taxa percentages grouped by structure (tree, ochre; shrub, green; grass and sedge, gray; aquatic, blue). Semiarid wetness index (SWI), arboreal to non-arboreal (AP/NAP) pollen ratio, and vegetation composition change or turnover (beta diversity) as determined by detrended canonical correspondence analysis (DCCA) also depicted. Solid gray lines delineate zones. MJAT, mean July air temperatures. (For interpretation of the references to color in this figure legend, the reader is referred to the web version of this article.)

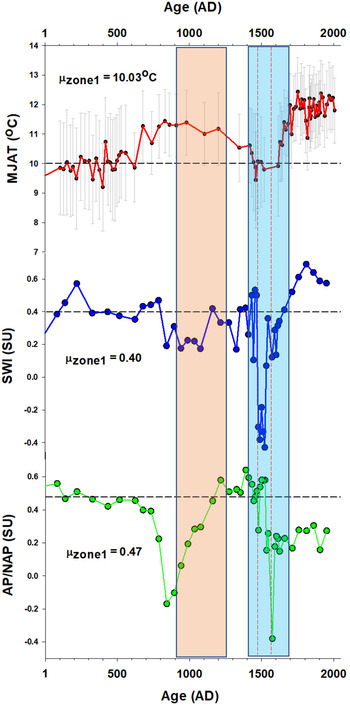
Summary diagram depicting a chironomid-inferred mean July air temperature reconstruction (Reinemann et al., Reference Reinemann, Porinchu, MacDonald, Mark and DeGrand2014) and pollen-based indices (AP/NAP, arboreal to non-arboreal pollen ratio; SWI, semiarid wetness index). Black dashed lines represent mean Zone 1 values for each variable. Red dashed lines indicate the timing of the large-magnitude fire events. The Medieval Climate Anomaly (orange shading; AD 900–1250) and Little Ice Age (blue shading; AD 1400–1700) are also shown. DCCA, detrended canonical correspondence analysis. (For interpretation of the references to color in this figure legend, the reader is referred to the web version of this article.)

Zonal and full-core (GB-SL-09) descriptive statistics for charcoal accumulation rates (CHAR) including calculated threshold values used to determine the occurrence of large-magnitude fires.

a Threshold = μ + 2σ.
Zone 2 (76.00–65.75 cm; AD 750–1370)
The stratigraphy of Zone 2 was homogeneous throughout, consisting of light-brown organic sediment. Sedimentation rates remained low throughout Zone 2 (μzone2 = 0.017 cm/yr); however, the sedimentation rate nearly doubled from the Zone 1 mean to 0.016 cm/yr following AD 850. A threefold increase in CHAR occurred between AD 870 and AD 900 (CHAR = 0.26 and 0.77 particles/cm2/yr, respectively). Changes in δ13C and δ15N were observed within Zone 2. Lake sediment became slightly more enriched in 13C in Zone 2 relative to Zone 1, ranging from −18.68‰ to −17.03‰ (μzone2 = −17.90‰). The most significant geochemical change observed in Zone 2 was in 15N, which became more enriched, doubling in its mean value in Zone 2 relative to its mean value in Zone 1. Enrichment in 15N continued until reaching the Zone 2 maximum value of 2.14‰ at approximately AD 1050. The value of δ15N remained close to 2.00‰ for the remainder of Zone 2. Poaceae reached a first millennium maximum of 48% at approximately AD 840. Pinus and Picea remained the dominant arboreal taxa; however, their percentages decreased, reaching first millennium minima of 20% and 17%, respectively during the ninth century. Understory taxa, such as Cupressaceae and Artemisia, were also reduced in the early portion of Zone 2. Poaceae decreased after AD 850, but grasses continued to represent more than 10% of total terrestrial pollen until approximately AD 1150. Arboreal and shrub-layer taxa increased with the observed reduction in grass-layer taxa, with arboreal taxa representing 74% of terrestrial pollen at AD 1210. At AD 840, AP/NAP reached the second-lowest value of the entire record (AP/NAP = −0.17) but increased to 0.50 by AD 1350. On average, SWI values were slightly lower in Zone 2 than Zone 1. The DCCA results indicate that the maximum turnover in vegetation, which occurred at AD 840, was driven by the increase in Poaceae and subsequent decrease in arboreal and shrub-layer taxa.
Zone 3 (65.75–46.50 cm; AD 1370–1620)
The lower portion of Zone 3 (65.75–59.00 cm) consisted of clayey, less organic, light-brown sediment. The sediment began to darken at 59 cm, and a layer of darker, less cohesive sediment was present between 57 and 47 cm. Large numbers of macroscopic charcoal pieces were visible to the naked eye throughout the upper section of Zone 3. Major increases in the sedimentation rate occurred between AD 1370 and AD 1420. Between AD 1420 and 1430, CHAR increased to 5.00 particles/cm2/yr, and remained between 4.82 and 7.45 particles/cm2/yr until AD 1480. CHAR values exceeded the 2σ threshold identifying a large-magnitude fire event at AD 1490 and remained greater than 2σ in the following seven samples (representing 40 years), with the exception of one sample (55.75 cm; 1520 AD) that fell just below the 2σ threshold. CHAR values exceeding the 2σ threshold were also observed at AD 1580 (CHAR = 47.68 particles/cm2/yr) and AD 1600 (CHAR = 47.37 particles/cm2/yr). A sharp decrease in δ13C (−17.07‰ to −18.44‰) occurred between AD 1370 and AD 1420. A notable enrichment in 15N began at AD 1360 (1.99‰ to 2.78‰), with a local maximum in δ15N occurring at AD 1400. Between AD 1480 and AD 1550, C/N increased rapidly from 12.75 to a maximum value of 22.53 at approximately AD 1520. Notable changes in δ13C also occurred during this interval, falling from −17.44‰ at AD 1480 to the most-depleted value of the entire record (δ13Cmin = −23.60‰) at AD 1510. Two intervals were characterized by increasingly enriched 15N values, AD 1400–1490 and AD 1520–1550, with δ15N increasing above 3.00‰ for the first time in the record at AD 1490. This zone was characterized by both a core maximum (76%) and a local core minimum (30%) in arboreal taxa at AD 1390 and AD 1575, respectively. Populus, which had a relatively low abundance throughout much of the record, reached a core maximum (4%) at AD 1530. AP remained dominant throughout this entire zone, although shrub-layer and Poaceae percentages began to rise after AD 1530. The brief increase in NAP was driven by a greater than 50% increase in grass pollen, which reached a core maximum of 55% at AD 1575. By AD 1620, pollen from arboreal taxa again made up the majority of terrestrial pollen. The AP/NAPmax occurred at approximately AD 1390, while the AP/NAPmin occurred at AD 1580. The SWI reached a 2000 year minimum value (SWI = −0.43) in Zone 3, with the only negative SWI values of the entire record occurring between AD 1480 and AD 1520. The DCCA axis 1 scores document notable floristic turnover between AD 1450 and AD 1550 and again at AD 1580.
Zone 4 (46.50–0.00 cm; AD 1620–2009)
The stratigraphy of the upper 46.50 cm of the GB-SL-09 core consisted primarily of angular/blocky light-brown sediment, with the upper 15 cm highly organic and relatively flocculent. The mean sedimentation rate in Zone 4 was 0.186 cm/yr. CHAR values were significantly lower relative to Zone 3, with zonal mean for CHAR equal to 1.03 particles/cm2/yr. The C/N ratio remained stable through Zone 4 until post–AD 1950, when C/N began to decrease. The only notable increase in C/N values occurred during the mid-eighteenth century, when values reached a zonal maximum of 14.43. The general trend of decreasing δ15N in this zone reversed at AD 1920, when Stella Lake sediments became rapidly enriched in 15N. Pollen percentages in Zone 4 were less variable than in Zone 3. Between AD 1620 and AD 1950 (uppermost pollen sample), AP percentages increased from 53% to 61%. This increase was driven by Pinus, which increased from 25% to 36% during this interval. Artemisia is the dominant understory taxon ranging between 12% and 17% (μzone4 = 14%). Poaceae reached its zonal maximum value of 11% at AD 1630 and decreased to the Zone 4 minimum (3%) at AD 1760. The maximum Cyperaceae percentage of the 2000 year record (9%) occurred at approximately AD 1950. The AP/NAP values indicate that the vegetation community was dominated by non-arboreal taxa throughout this zone. The SWI reached a core maximum at approximately AD 1810, following which time the SWI values decreased.
INTERPRETATION AND DISCUSSION
Climate and Vegetation Change during the First Millennium
Proxy evidence suggests that the fire regime was quiescent within the Stella Lake catchment throughout much of the first millennium. A low sedimentation rate suggests that no major erosional events occurred within the catchment during this interval. The pollen record indicates a compositionally stable subalpine forest surrounded Stella Lake during this interval. The forest was primarily composed of pine and spruce with lesser amounts of sagebrush and juniper present in the shrub level. High AP/NAP values indicate that the canopy of the subalpine forest was likely dense, limiting the expansion of understory vegetation (Carter et al. Reference Carter, Brunelle, Minckley, Shaw, DeRose and Brewer2017; McWethy et al. Reference McWethy, Alt, Argiriadis, Battistel, Everett and Pederson2020). The DCCA results support the inference of stability in the vegetation community, with limited floristic turnover evidenced before approximately AD 750. The SWI values, which capture variations in growing season moisture, remain constant, suggesting that the hydroclimate at Stella Lake was relatively stable during this interval.
Regional paleoclimate records are in general agreement that the Great Basin was both colder and wetter during much of the first millennium relative to the early to mid-Holocene (Mensing et al., Reference Mensing, Benson, Kashgarian and Lund2004; Bird et al., Reference Bird, Abbott, Finney and Kutchko2009; Reinemann et al., Reference Reinemann, Porinchu, Bloom, Mark and Box2009, Reference Reinemann, Porinchu, MacDonald, Mark and DeGrand2014; Christiansen and Ljungqvist, Reference Christiansen and Ljungqvist2012; Salzer et al., Reference Salzer, Bunn, Graham and Hughes2014; Wahl et al., Reference Wahl, Starratt, Anderson, Kusler, Fuller, Wan and Olson2015). Salzer et al. (Reference Salzer, Bunn, Graham and Hughes2014) documented that timberline on Mount Washington (within GRBA), which was approximately 58 m higher than the modern timberline at AD 1, decreased in elevation during the first millennium. Falling timberlines are indicative of cooler growing season conditions, as trees retreat to lower elevations with higher temperatures that are more supportive of tree establishment (Kullman, Reference Kullman1995; Millar et al., Reference Millar, Westfall, Delany, Flint and Flint2015). At Stella Lake Pinus and Picea dominated the forest, comprising 70% of the AP, indicating the existence of a cool, wet climate. Reinemann et al. (Reference Reinemann, Porinchu, MacDonald, Mark and DeGrand2014) determined that mean July air temperatures (MJAT) were, on average, lower than the 2000 year mean temperature for the majority of the first millennium.
The lack of macroscopic charcoal evidence of fire during much of the first millennium at Stella Lake suggests that the consistently cooler, wetter conditions within the region during this interval suppressed fire activity in the Stella Lake catchment. We infer that the expansion in non-arboreal taxa at AD 750 is likely the result of increasing temperatures and lower effective moisture. Reinemann et al. (Reference Reinemann, Porinchu, MacDonald, Mark and DeGrand2014) observed elevated chironomid-inferred MJAT ca. AD 700 and linked the observed increases in MJAT to the warming documented over the Northern Hemisphere (Moberg et al., Reference Moberg, Sonechkin, Holmgren, Datsenko and Karlén2005; Mann et al., Reference Mann, Zhang, Rutherford, Bradley, Hughes, Shindell and Ammann2009; Christiansen and Ljungqvist, Reference Christiansen and Ljungqvist2012; Ahmed et al., Reference Ahmed, Anchukaitis, Asrat, Borgaonkar, Braida, Buckley and Büntgen2013). Regional pollen records also provide support for the onset of increased aridity at this time. Mensing et al. (Reference Mensing, Smith, Norman and Allan2008) document a reduction in the conifer/sage ratio at Mission Creek Bog, NV, which is inferred to reflect a reduction in effective moisture at approximately AD 750. It is likely that the changes in vegetation observed in Stella Lake during the late ninth century are in response to elevated summer temperatures (Reinemann et al., Reference Reinemann, Porinchu, MacDonald, Mark and DeGrand2014) and regional-scale reduction in effective moisture (Meko et al., Reference Meko, Therrell, Baisan and Hughes2001; Benson et al., Reference Benson, Kashgarian, Rye, Lund, Paillet, Smoot and Kester2002; Mensing et al., Reference Mensing, Smith, Norman and Allan2008).
Environmental Change during the MCA
Hydroclimate variability in the western United States during the MCA (AD 900–1300) (Meko et al., Reference Meko, Woodhouse, Baisan, Knight, Lukas, Hughes and Salzer2007) has been well documented (Cook et al., Reference Cook, Woodhouse, Eakin, Meko and Stahle2004; Meko et al., Reference Meko, Woodhouse, Baisan, Knight, Lukas, Hughes and Salzer2007). While multiple multidecadal drought episodes characterize the MCA in the western United States (Meko et al., Reference Meko, Woodhouse, Baisan, Knight, Lukas, Hughes and Salzer2007; MacDonald et al., Reference MacDonald, Kremenetski and Hidalgo2008; Woodhouse et al., Reference Woodhouse, Meko, MacDonald, Stahle and Cook2010), evidence of a wet MCA interval is also evident in this region (Davis Reference Davis1994). Tree ring–based records of hydroclimate variability within the Great Basin (Meko et al., Reference Meko, Therrell, Baisan and Hughes2001, Reference Meko, Woodhouse, Baisan, Knight, Lukas, Hughes and Salzer2007; Cook et al., Reference Cook, Woodhouse, Eakin, Meko and Stahle2004; Cook, Reference Cook2006; Woodhouse et al., Reference Woodhouse, Meko, MacDonald, Stahle and Cook2010; Salzer et al., Reference Salzer, Bunn, Graham and Hughes2014) have identified the existence of notable regional drought during the MCA.
Although Mensing et al. (Reference Mensing, Smith, Norman and Allan2008) indicate that the late first-millennium drought is not well documented, we suggest that the observed changes in vegetation at Stella Lake corroborate the existence of this drought episode. At the onset of the MCA, the vegetation community at Stella Lake was compositionally distinct from that of the stable subalpine forest that existed during much of the first millennium. Although arboreal species remained dominant throughout much of the MCA, grasses became more abundant during the early MCA (approximately AD 820 to AD 900). The reduction in AP/NAP and SWI is inferred to reflect the continued influence of the late first-millennium drought. The increase in sedimentation rates that occurred post–AD 850 may have resulted from reduced stability in the vegetation community, as reflected by elevated turnover, leading to increased erosion.
The evidence from Stella Lake suggests that the late MCA in GRBA was characterized by an increase in effective moisture and the expansion of subalpine forest. The return to a vegetation community compositionally more similar to the one that existed during much of the first millennium in the later portion of the MCA occurred during an interval characterized by lower chironomid-inferred MJAT (Reinemann et al., Reference Reinemann, Porinchu, MacDonald, Mark and DeGrand2014) and increased effective moisture, as evidenced by elevated SWI. Regional hydroclimate varied greatly during the middle and late MCA (Mensing et al., Reference Mensing, Smith, Norman and Allan2008; Woodhouse et al., Reference Woodhouse, Meko, MacDonald, Stahle and Cook2010), with major multidecadal droughts evident during this interval (Meko et al., Reference Meko, Therrell, Baisan and Hughes2001; Cook et al., Reference Cook, Woodhouse, Eakin, Meko and Stahle2004; Cook, Reference Cook2006).
The increase in CHAR and enrichment in 15N, together with the large increase in Poaceae that occurs between AD 870 and AD 900, suggests that higher summer temperatures (Reinemann et al., Reference Reinemann, Porinchu, MacDonald, Mark and DeGrand2014) and decreased effective moisture (Meko et al., Reference Meko, Therrell, Baisan and Hughes2001; Mensing et al., Reference Mensing, Smith, Norman and Allan2008) increased the occurrence of ground fire in the grass/sedge community. Fire regimes characterized by frequent, efficient ground fires do not produce much charcoal, partly because these fires are often small, and charred particles are not carried aloft (Whitlock and Larsen, Reference Whitlock, Larsen, Smol, Birks and Last2001). Whitlock and Larsen (Reference Whitlock, Larsen, Smol, Birks and Last2001) document that the majority of lake-sediment charcoal records from the western United States consist mainly of woody charcoal morphotypes; wood-based charcoal particles are denser and more prone to waterlogging and settling in lake sediments when burned (Vaughan and Nichols, Reference Vaughan and Nichols1995; Whitlock and Larsen, Reference Whitlock, Larsen, Smol, Birks and Last2001). This bias toward the preservation of woody charcoal may have influenced the relative abundance of charcoal morphotypes observed in the Stella Lake record, with woody charcoal likely overrepresented relative to herbaceous and lattice charcoal (Vaughan and Nichols, Reference Vaughan and Nichols1995; Umbanhowar and McGrath, Reference Umbanhowar and Mcgrath1998; Whitlock and Larsen, Reference Whitlock, Larsen, Smol, Birks and Last2001). However, even with the existence of this potential bias, a peak in the relative proportion of nonwoody to woody charcoal is evident at AD 900. Evidence of increasing fire activity within the Stella Lake catchment is also supported by the marked increase in δ15N values. Wildfires increase the flux of N stored in catchment organic matter to aquatic ecosystems (Morris et al., Reference Morris, McLauchlan and Higuera2015). This organic N stock is likely to be enriched in 15N, as volatilization favors releasing 14N to the atmosphere (McLauchlan et al., Reference McLauchlan, Craine, Oswald, Leavitt and Likens2007; Saito et al., Reference Saito, Miller, Johnson, Qualls, Provencher, Carroll and Szameitat2007; Dunnette et al., Reference Dunnette, Higuera, McLauchlan, Derr, Briles and Keefe2014), with the magnitude of 15N enrichment during volatilization likely related to fire severity (Stephan, Reference Stephan2007; LeDuc et al., Reference LeDuc, Rothstein, Yermakov and Spaulding2013; Dunnette et al., Reference Dunnette, Higuera, McLauchlan, Derr, Briles and Keefe2014). It is important to note that the enrichment in δ15N lagged behind the increases in CHAR by over two decades following the inferred increase in ground fires (Wu and Porinchu, Reference Wu and Porinchu2020).
Fire, Vegetation, and Geochemical Response during the LIA
The changes observed within the Stella Lake catchment during this interval, which includes much of the LIA (AD 1400–1700; Mann et al., Reference Mann, Zhang, Rutherford, Bradley, Hughes, Shindell and Ammann2009), were the most dramatic evidenced over the last two millennia. Lower summer temperatures (Reinemann et al., Reference Reinemann, Porinchu, MacDonald, Mark and DeGrand2014) coincided with the expansion of subalpine forest, as inferred by the large increase in arboreal taxa following AD 1370 (AP/NAP = 0.64). The change in vegetation community composition that occurred at Stella Lake between AD 1470 and AD 1480 was driven by a large reduction in the relative abundance of Pinus, which coincided with an increase in Poaceae and Amaranthaceae, although pollen concentrations decreased among all taxa. This shift in the composition of the vegetation surrounding Stella Lake was associated with an unprecedented increase in CHAR and dramatic changes in sediment geochemistry. The concurrent change in multiple proxies at approximately AD 1490 is interpreted as reflecting the occurrence of the first of two large-magnitude (CHAR > 2σ above core μCHAR) catchment-scale fire events at Stella Lake during the LIA.
Based on CHAR, the first notable fire event occurred at AD 1490. This first event, which was characterized by CHAR values exceeding the 2σ threshold in consecutive samples, each of which represented less than a decade of deposition, was inferred to relate to a single large-magnitude catchment-scale event. The transfer of terrestrial organic matter composed primarily of C3 vegetation from the catchment to the lake following the fire is supported by increased C/N, depleted δ13C (Meyers and Teranes, Reference Meyers, Teranes, Last and Smol2001; Wu et al., Reference Wu, Porinchu, Campbell, Mordecai and Alden2019), and elevated δ15N values (Dunnette et al., Reference Dunnette, Higuera, McLauchlan, Derr, Briles and Keefe2014; Morris et al., Reference Morris, McLauchlan and Higuera2015). These changes likely reflect increased erosion in the catchment resulting in an elevated flux of organic N, enriched in 15N by volatilization (McLauchlan et al., Reference McLauchlan, Craine, Oswald, Leavitt and Likens2007; Dunnette et al., Reference Dunnette, Higuera, McLauchlan, Derr, Briles and Keefe2014; Morris et al., Reference Morris, McLauchlan and Higuera2015), and depleted in 13C, due to the abundance of C3 vegetation in the catchment (Meyers and Teranes, Reference Meyers, Teranes, Last and Smol2001; Wu et al., Reference Wu, Porinchu, Campbell, Mordecai and Alden2019). CHAR responded more gradually than the sediment geochemistry, reaching its highest level within 40 years of the fire event. The increase in CHAR that characterized the interval following the onset of the initial large-magnitude fire is likely related to the continued introduction of “secondary” charcoal into the lake via surface runoff. Secondary charcoal has been observed to continually accrue in lakes in the decades following a known fire event (Anderson et al., Reference Anderson, Davis, Miller and Stuckenrath1986; Patterson et al., Reference Patterson, Edwards and Maguire1987), supporting the inference that elevated CHAR values (>2σ) in contiguous samples no more than 20 years apart may be sourced to the same “large-magnitude” fire event. Following this fire, the subalpine forest at Stella Lake began to recover, as evidenced by increases in Picea and other arboreal taxa, including Populus (a taxa commonly found postdisturbance), which reached its highest abundance between AD 1480 and AD 1550. Between AD 1580 and AD 1600, the second large-magnitude fire event occurred. This event was characterized by elevated CHAR values (>2σ) at AD 1580 and AD 1600; the CHAR values of intervening samples, each representing <10 years of deposition, were less than 2σ. The elevated CHAR values at AD 1580 and AD 1600 were determined to represent a single large-magnitude event, as it is unlikely that woody vegetation would recover sufficiently between AD 1580 and AD 1600 to support two catchment-scale fire events within 20 years. Additional evidence for this second catchment-scale fire event includes a core minimum in AP/NAP, notable floristic turnover, and large deviations in δ15N and δ13C ca. AD 1570. The increase in CHAR, which lagged behind the vegetation and geochemical response by approximately two decades, provides additional evidence for the occurrence of a major fire during the late sixteenth century. Based on the magnitude of changes in CHAR and δ15N, it is likely that this second fire was not as large as the first fire event; nevertheless, the fossil pollen evidence indicates that this second fire served to greatly alter the arboreal community surrounding Stella Lake.
It is possible that regional drought and decreased soil moisture availability drove the fire activity (see Marlon et al. Reference Marlon, Bartlein, Gavin, Long, Anderson, Briles and Brown2012) within the Stella Lake catchment during the LIA. Tree-ring reconstructions of summer Palmer Drought Severity Index describe the occurrence of fifteenth- and sixteenth-century “megadroughts” in the western United States (Stahle et al., Reference Stahle, Fye, Cook and Griffin2007). The fifteenth-century megadrought, which occurred between AD 1444 and AD 1481, is evidenced at multiple locations across the western United States (Hughes and Brown, Reference Hughes and Brown1992; Meko et al., Reference Meko, Therrell, Baisan and Hughes2001; Stahle et al., Reference Stahle, Fye, Cook and Griffin2007) and corresponds with the occurrence of the first catchment-scale fire event at Stella Lake, as evidenced by CHAR maxima. The tree ring–based drought reconstruction provided by Stahle et al. (Reference Stahle, Fye, Cook and Griffin2007) indicates that this drought was most severe over the Great Plains, and Hughes and Brown (Reference Hughes and Brown1992) describe evidence of this drought in central California. The sixteenth-century megadrought described by Stahle et al. (Reference Stahle, Fye, Cook and Griffin2007) occurred between AD 1571 and AD 1586, corresponding to the second major fire event at Stella Lake. Before both major fire events, Sacramento River discharge was very low relative to the 2000 year mean (Meko et al., Reference Meko, Therrell, Baisan and Hughes2001), and reconstructions of Colorado River streamflow (Woodhouse et al., Reference Woodhouse, Gray and Meko2006; Meko et al., Reference Meko, Woodhouse, Baisan, Knight, Lukas, Hughes and Salzer2007) indicated low flow during the late fifteenth century. Tree-ring reconstructions of precipitation for Nevada Climate Division 3, derived from Pinus longaeva in the White Mountains, CA, evidenced reduced precipitation during the late sixteenth century (Hughes and Graumlich, Reference Hughes and Graumlich1996). However, it is important to note that this record indicates that catastrophic catchment-scale fire events did not occur during the MCA, an interval characterized by severe multidecadal droughts. The buildup of biomass, particularly woody vegetation, is an important precondition for fire ignition and spread (Swetnam and Baisan, Reference Swetnam, Baisan, Veblen, Baker, Montenegro and Swetnam2003). Persistent low-magnitude ground fires that occur during long dry periods, such as evidenced at Stella Lake during the MCA, may limit fuel accumulation and thereby reduce the likelihood of catchment-scale fire events (Peterson et al., Reference Peterson, Johnson, Agee, Jain, McKenzie and Reinhardt2005). It has been suggested that enhanced variability in precipitation can promote wildfires in many wildland systems (Swetnam and Betancourt, Reference Swetnam and Betancourt1998; Swetnam and Baisan, Reference Swetnam, Baisan, Veblen, Baker, Montenegro and Swetnam2003; Loisel et al., Reference Loisel, MacDonald and Thomson2017). Oscillating wet–dry cycles can enhance fire activity and intensity, with increases in effective moisture facilitating the accumulation of fuels through new growth and fire suppression, and a decrease in effective moisture promoting fuel flammability (Westerling and Swetnam, Reference Westerling and Swetnam2003). In general, the LIA has been described as a period characterized by notable hydroclimate variability (Loisel et al., Reference Loisel, MacDonald and Thomson2017). Regional paleorecords based on lake and bog sediments indicate fluctuating hydroclimate over this interval (Thompson, Reference Thompson1992; Benson et al., Reference Benson, Kashgarian, Rye, Lund, Paillet, Smoot and Kester2002; Mensing et al., Reference Mensing, Benson, Kashgarian and Lund2004, Reference Mensing, Livingston and Barker2006, Reference Mensing, Smith, Norman and Allan2008, Reference Mensing, Sharpe, Tunno, Sada, Thomas, Starratt and Smith2013; Wahl et al., Reference Wahl, Starratt, Anderson, Kusler, Fuller, Wan and Olson2015).
We suggest that it is likely that the influence of regional drought in combination with increasing variability in the precipitation regime during the LIA (Loisel et al., Reference Loisel, MacDonald and Thomson2017) resulted in the two large-magnitude fire events observed at Stella Lake during late fifteenth and late sixteenth centuries. This study provides support for the hypothesis that fuel buildup, resulting from increases in effective moisture, and suitable climate conditions are required for the occurrence of “catastrophic,” catchment-scale fires. A pattern of enhanced fire activity during times of increased hydroclimate variability, as seen in this record, could serve as an analog for future climate–wildfire relations in the southwestern United States, given the increasing hydroclimate variability projected to occur in coming decades (Loisel et al., Reference Loisel, MacDonald and Thomson2017).
Recovery and Changes during the Modern Era
Temperatures in the Northern Hemisphere increased following the LIA (Ahmed et al., Reference Ahmed, Anchukaitis, Asrat, Borgaonkar, Braida, Buckley and Büntgen2013), and local temperatures, as inferred from subfossil chironomids, stayed close to 1°C above the 2000 year mean (Reinemann et al., Reference Reinemann, Porinchu, MacDonald, Mark and DeGrand2014) between AD 1600 and the present. The increase in Pediastrum that occurs at this time is likely related to higher MJAT (Reinemann et al., Reference Reinemann, Porinchu, MacDonald, Mark and DeGrand2014; Wahl et al., Reference Wahl, Starratt, Anderson, Kusler, Fuller, Wan and Olson2015). Reinemann et al. (Reference Reinemann, Porinchu, MacDonald, Mark and DeGrand2014) identify notable changes in chironomid community composition within Stella Lake during the interval characterized by the large-magnitude fire events. Changes in chironomid community composition were inferred to reflect the influence of lower MJAT. The results of this study suggest that the shift in chironomid community composition (Reinemann et al., Reference Reinemann, Porinchu, MacDonald, Mark and DeGrand2014) was a direct response to fire-related changes in aquatic conditions rather than a response to climatic forcing (Fig. 5). Fire was not a major influence on the vegetation community or sediment geochemistry during this interval. Evidence of a minor fire event at approximately AD 1660 in the charcoal record was accompanied by elevated δ15N; however, this minor event was not accompanied by a notable change in catchment vegetation. By the close of the LIA, AP/NAP had stabilized below the mean AP/NAP that characterized Zone 1. The slow “recovery” of arboreal vegetation was mainly influenced by the continued low relative abundance of Picea, which is not as fire tolerant as Pinus. Abundant Pinus together with the large increase in Artemesia suggests that Stella Lake was surrounded by a more open vegetation community that is dissimilar to the vegetation community that existed before fire episodes evidenced in the fifteenth and sixteenth centuries. An increase in the SWI indicates that the post-LIA interval was characterized by increased effective moisture; support for wetter conditions post–AD 1660 is available from Favre Lake, NV (Wahl et al., Reference Wahl, Starratt, Anderson, Kusler, Fuller, Wan and Olson2015), and Ruby Marsh, NV (Thompson, Reference Thompson1992). Variations in sediment geochemistry following the close of the LIA were relatively moderate until the late twentieth century. The enrichment of 15N, which is larger than any time during the past two millennia, is likely driven by agricultural activity (Baron et al., Reference Baron, Hall, Nolan, Finlay, Bernhardt, Harrison and Chan2013, Reference Baron, Barber, Adams, Agboola, Allen, Bealey, Bobnik, Sutton, Mason, Sheppard, Sverdrup, Haeuber and Hicks2014; Hundey et al., Reference Hundey, Russell, Longstaffe and Moser2016; Moser et al., Reference Moser, Baron, Brahney, Oleksy, Saros, Hundey and Sadro2019).
CONCLUSION
This quantitative, high-resolution reconstruction of vegetation change, fire history, and geochemical response from Stella Lake, NV provides much needed information regarding fire occurrence on subcentennial time scales in subalpine environments in the central Great Basin. The Stella Lake record reveals that: (1) Stella Lake was surrounded by a relatively stable subalpine forest during much of the first millennium; (2) changes in catchment vegetation, specifically an increase in Poaceae and decreases in Pinus and Picea, occurred during the late first millennium corresponding to hydroclimate changes at the onset of the MCA; (3) major changes in catchment vegetation and sediment geochemistry during the LIA were driven by the occurrence of two catchment-scale fires during the late fifteenth and sixteenth centuries; and (4) the subalpine forest has not yet recovered to pre-fire forest composition and structure, following the LIA fire events. The first period of significant change in the vegetation community surrounding Stella Lake occurred near the onset of the MCA and was likely driven by higher summer temperatures and regional drought. However, this study also establishes that prolonged reductions in effective moisture and elevated temperature may not lead to the occurrence of catchment-scale fire events, as no large-magnitude fires events are evidenced at Stella Lake during the MCA. The two large-magnitude fire events responsible for the most significant catchment-wide changes in vegetation evidenced in this record occurred during the LIA, an interval characterized by lower temperatures and variable hydroclimate. The combined effects of increased variability in precipitation regime (Loisel et al., Reference Loisel, MacDonald and Thomson2017) and fuel buildup (Westerling and Swetnam, Reference Westerling and Swetnam2003) likely contributed to the occurrence of these fire events during the LIA. We also suggest that changes in chironomid community composition at Stella Lake during the LIA, inferred by Reinemann et al. (Reference Reinemann, Porinchu, MacDonald, Mark and DeGrand2014) as evidence for reduced MJAT, were likely in response to changes in the aquatic ecosystem following catchment-scale fires. Continued research into the complex relationship between the response of subalpine forests to hydroclimate variability and wildfire will assist in the design of effective wildfire management plans in the Great Basin.
Supplementary Material
The supplementary material for this article can be found at https://doi.org/10.1017/qua.2021.17.
Acknowledgments
We would like to thank Gretchen Baker (Ecologist, GRBA) for her continued input and unflagging support of this research. We would like to thank Scott Mensing, Christy Briles, Megan Walsh, and Jiaying Wu for their guidance on pollen and charcoal analyses. We also would like to thank the many students from both UGA and OSU who participated in GBEX and helped during field excursions. We would like to thank Tom Maddox at CAIS, UGA, for his assistance with the geochemical analyses. Comments from Associate Editor Terri Lacourse, Scott Mensing and an anonymous reviewer are gratefully acknowledged.
Financial Support
This research was funded by the Western National Parks Association (WNPA) and the Geological Society of America (GSA).