Clostridioides difficile is the leading cause of healthcare-associated infections (HAIs) in California and nationally 1,Reference Magill, Edwards and Bamberg2 and of gastroenteritis-associated deaths, Reference Hall, Curns, McDonald, Parashar and Lopman3 leading to significant patient morbidity and mortality. Reference Magill, Edwards and Bamberg2,Reference Lessa, Mu and Bamberg4 Among HAIs subject to mandatory reporting by general acute-care hospitals in California, >46% (6,421 of 13,894) reported in 2018 were C. difficile infection (CDI). 1 CDI is believed to occur through a 2-step process: disruption of the colonic microbiome, primarily by antibiotics, followed by exposure to toxigenic C. difficile, or biome disruption in already colonized persons. Reference Bignardi5 Antibiotic use increases the risk for CDI for 3 months after the cessation of therapy, Reference Hensgens, Goorhuis, Dekkers and Kuijper6 during which time patients might receive care at multiple healthcare facilities. Thus, prevention measures for CDI, including hand hygiene protocols, contact precautions, environmental cleaning and disinfection, and antimicrobial stewardship must be implemented across the continuum of healthcare facilities that share patients. Reference McDonald, Gerding and Johnson7 The California Department of Public Health HAI Program targets individual hospitals with high CDI incidence to improve strategies to prevent transmission of C. difficile and to implement robust antibiotic stewardship practices. Since 2015, our program also engages with local health departments and network of healthcare facilities in regional antimicrobial resistance prevention collaborative projects including CDI, in which healthcare facilities work together to implement antimicrobial resistance prevention best practices within their facilities and when sharing patients. 8
California acute-care hospitals report CDI via the National Healthcare Safety Network (NHSN). NHSN CDI laboratory-identified (LabID) event reports contain limited patient information (eg, patient gender, date of birth, date of hospital admission). To obtain additional characteristics of patients with CDI (eg, source of admission, length of stay, payer category, and outcomes such as death), NHSN LabID event data can be linked with patient discharge records from the California’s Office of Statewide Health Planning and Development (OSHPD). 9 This administrative data set can identify unique patients and track their movement between hospital admissions to identify admissions prior to or following an admission related to a CDI event. Thus, these data can be used to assess whether these hospital admissions occurred at the same or at different hospitals. Hospitals linked to subsequent community-onset CDI within 3 months following discharge may be disproportionally exposing patients to antibiotic use and/or C. difficile spores, and these hospitals can be targeted for prevention measures. Although the standardized infection ratio (SIR) adjusts for facility-level risk factors, such as inpatient community-onset admission prevalence rate, 10 this summary measure focuses on cases identified at the facility level and would not capture their influence of CO-CDI cases developed after discharge. Identifying hospitals contributing to subsequent CDI burden may enable opportunities for CDI prevention improvements at exposure hospitals and may prompt earlier identification of CDI cases at diagnosing hospitals. We evaluated a method of identifying hospitals that potentially contribute to the CDI burden and whose SIRs may not always indicate them to be prioritized for public health CDI prevention activities. Our goal is for public health colleagues and hospital epidemiologists to use our study as another tool for identifying opportunities for CDI prevention across the continuum of care and further complement current CDI prevention efforts and allocation of resources, which are often limited in US hospitals.
Methods
Phase 1
Data sources, preparation, and merge
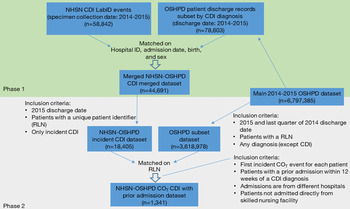
We extracted 2014 and 2015 California inpatient (hospitalized) incident and recurrent healthcare facility-onset (HO-), community-onset (CO-), and community-onset healthcare-facility–associated (CO-HCFA) CDI LabID event data from the NHSN based on specimen collection date. We obtained 2014–2015 patient discharge hospital records from the OSHPD. We used the NHSN surveillance definitions to determine incident and recurrent CO-, CO-HCFA, and HO-CDI LabID events. 11 CDI LabID events collected ≤14 days of a prior event were excluded from the analysis. CO-CDI and CO-HCFA CDI LabID events were combined (referred to as COT-CDI events throughout this study) to capture LabID events diagnosed ≤3 days of admission. We developed an internal hospital cross link in which each OSHPD ID had a corresponding NHSN ID, and we merged this cross link with the CDI LabID events data set. We created a subset discharge data set with only observations that had CDI as one of the diagnoses based on the International Classification of Diseases, Ninth Revision, Clinical Mondification (ICD-9-CM) codes: ICD-9-CM 00845 and ICD-10-CM A047. We matched the records based on 4 key variables: hospital ID, data of birth, gender, and date of hospital admission. We also allowed the match to account for 1 and 2 days of admission off in the NHSN data set. That is, if an exact admission date was not found for a record and the admission in NHSN was 1 or 2 days later compared to the OSHPD admission date, but all other key variables matched, we considered the record to be a match (Fig. 1). We excluded records missing any of the key matching variables, and we removed possible duplicate records if all 4 matching key variables were the same for >1 observation by keeping the observation with the first specimen collection date (for the CDI LabID event data set) or the first discharge date (for the OSHPD data set).
Flow diagram with overview of NHSN and OSHPD data merging process and steps.

Descriptive analysis
We summarized patient characteristics (ie, age, admission source, length of stay, payer category, and inpatient mortality) for all discharge records (main OSHPD data set) and for the CDI matched case records (further stratified by CDI onset: COT vs HO). We also identified the proportion of patients with >1 hospitalization related to CDI.
Phase 2
Data preparation and main analysis
To calculate the proportion of patients that had a hospital admission within 12 weeks prior to a CDI diagnosis and whether the admission occurred in the same versus in a different hospital, we selected from the CDI/OSHPD merged data set only patients discharged in 2015 that had incident COT CDI and with a record linkage number (RLN) available. From the main OSHPD data set, we obtained patients with an RLN that had any diagnosis (except CDI) and were discharged during 2015 (or in the last quarter of 2014 to enable identification of discharges within 12 weeks prior to a 2015 CDI event). The choice of a 12-week period has been described in previous studies. Reference Chitnis, Holzbauer and Belflower12 We selected the first incident CDI diagnosis for patients with multiple CDI admissions and the last (most recent) admission for patients with multiple admissions before a CDI diagnosis. We defined hospitals that admitted patients that later developed COT CDI at a different hospital as exposure hospitals and hospitals that identified patients with COT CDI as diagnosing hospitals. We excluded admissions to the diagnosing hospitals if they were direct transfers from independent skilled nursing or intermediate care facilities. For the exposure hospitals, we obtained the number of patients admitted before developing COT CDI at a different hospital and the overall number of admissions for that time period (within patients with an RLN), and we calculated an exposure rate (per 10,000 admissions). We stratified hospitals by NHSN hospital type: community (further subdivided into small <125 beds, medium 125–250 beds, and large >250 beds); major teaching; pediatric; rehabilitation; critical access; long-term acute care; and acute psychiatric, chemical dependency, or psychiatric health. We used the exposure rate to rank NHSN reporting exposure hospitals within their hospital types when applicable (ie, only those with an available SIR). We analyzed those hospitals within the highest percentile (90th–100th) for comparability with the 2015 hospital SIR (eg, whether these high-ranked exposure hospitals had a SIR lower, higher, or no different than the national baseline). We also calculated a composite CDI rate (including CO-, HO-, and CO-HCFA events) per 10,000 admissions for each exposure hospital. We analyzed the correlation between hospital exposure rate and SIR and the former with the composite CDI rate. All analyses were completed using SAS version 9.4 software (SAS Institute, Cary, NC). This project was reviewed and received a nonresearch determination by the Committee for the Protection of Human Subjects under the California Health and Human Services Agency.
Results
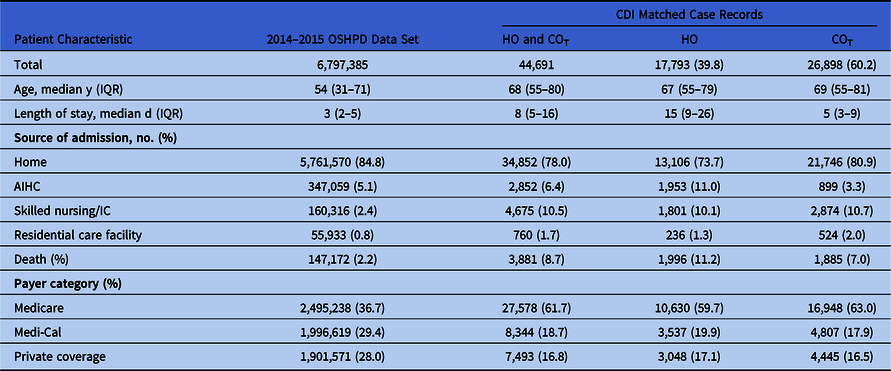
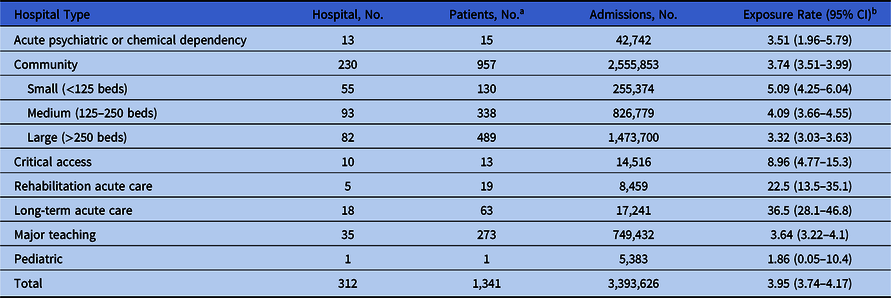
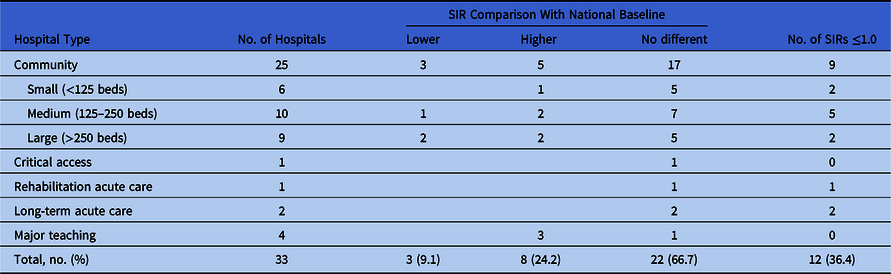
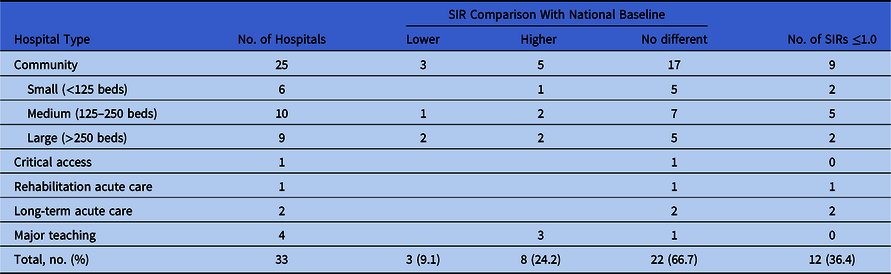
The OSHPD discharge data set reported 78,603 records with CDI as one of the diagnoses in 2014–2015. Hospitals reported 58,842 NHSN inpatient incident and recurrent CDI events in 2014–2015. We matched 44,691 NHSN CDI records (76.0%) with an OSHPD hospital discharge record (Fig. 1); 26,898 matched cases (19,507 CO- and 7,391 CO-HCFA; 60.2%) were COT-CDI and 17,793 (39.8%) cases were HO-CDI. When comparing the characteristics of the CDI matched-case records with the overall patient discharge records, patients with CDI matched-case records were older (median age, 68 years), had a longer hospitalizations (median, 8 days), and were admitted from a skilled nursing setting or intermediate care at a higher percentage (10.5%) compared to the patients from the overall patient discharge records. Medicare represented the major payer category for CDI matched-case records (61.7%) and the overall patient discharge records (36.7%). The inpatient mortality rate in CDI matched-case records was 8.7% compared to 2.2% in the overall discharge population. When comparing HO CDI with COT-CDI case-matched records, inpatient mortality was higher among HO-CDI patients (11.2%) compared with COT-CDI patients (7.0%); the median length of stay for HO-CDI patients was 15 days compared to 5 days for patients with COT-CDI matched-case records (Table 1). Among 36,215 patients that had a unique patient identifier (record linkage number), 4,338 (12.0%) had 2 or more hospitalizations (range, 2–8) with a CDI diagnosis during the 2014–2015 study period. Within 12 weeks prior to an incident COT-CDI event, 5,234 of the patients (14.5%) had an admission not related to CDI, and 1,574 of these prior admissions (30.1%) occurred in a different hospital. The median time between the 2 hospital admissions was 15 days (IQR, 4–38). Of the 1,574 patients, 233 (14.8%) were admitted from a skilled nursing facility before admission to the diagnosing hospitals and were excluded from the analysis (Table 2). The median length of stay for patients at the exposure hospitals (before a COT-CDI event) was 5 days (IQR, 3–9) compared to 6 days (IQR, 4–11) at the diagnosing hospitals (COT-CDI event identified). The median length of stay for all patient admissions from exposure hospitals and diagnosing hospitals was 3 days. Of 324 NHSN reporting hospitals, 47 (14.5%) were exposure hospitals but not diagnosing hospitals, and 25 (7.7%) hospitals were only diagnosing hospitals. Among the hospital types, long-term acute-care hospitals had the highest rates of sharing patients that later developed COT-CDI at a different hospital, followed by rehabilitation acute-care hospitals and critical-access hospitals (Table 2). We did not find an association between exposure rate and SIR by hospital. When comparing rankings for exposure hospitals within the 90th–100th percentile, overall, 66.7% of the hospitals had an SIR no different than the national baseline: 9.1% were lower; 24.2% were higher than the national baseline; and 36.4% of the SIRs were ≤1.0 (Table 3). Hospital exposure rate was positively associated with hospital CDI composite rate (Spearman’s ρ correlation coefficient, 0.15; P = .01).
Characteristics of Admissions From the Main OSHPD Data Set and the CDI Matched Case Records, California, 2014–2015

Note. OSHPD, Office of Statewide Health Planning and Development; CDI, Clostridioides difficile infection; HO: healthcare facility-onset; COT, community-onset and community-onset healthcare facility-associated combined; AIHC: acute inpatient hospital care; IC, intermediate care; IQR, interquartile range.
Hospital Exposure Rates by Hospital Type
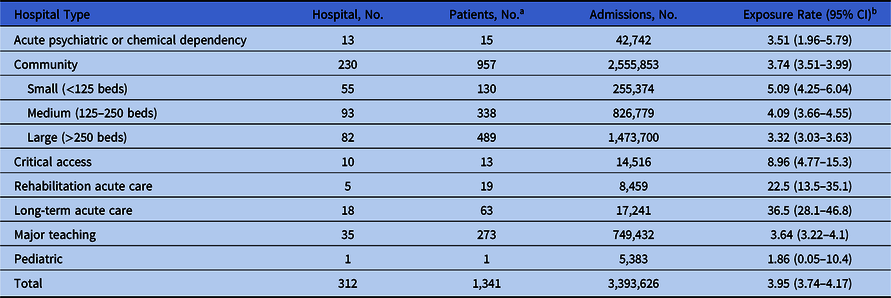
Notes. COT, community-onset and community-onset healthcare facility-associated combined; CDI, Clostridioides difficile infection.
a No. of patients discharged that later developed COT CDI diagnosed at a different hospital.
b Rate per 10,000 admissions, 95% exact Poisson confidence limits.
Comparison of High-Ranked (Within 90th–100th Percentile) Exposure Hospitals With the 2015 Standardized Infection Ratio (SIR) by Hospital Type
Discussion
To the best of our knowledge, this is the first state-level study to demonstrate the use of NHSN LabID event data in combination with an administrative discharge data to characterize CDI in California hospitals. We assessed statewide interfacility sharing of patients with CDI and the identification of hospitals likely exposing patients to antibiotics and/or C. difficile spores. In particular, 25 high-ranked exposure hospitals (76%) would not necessarily be targeted for prevention based on their SIR comparison to the national baseline (ie, SIR no different or lower than the national baseline). Thus, the ranking of exposure hospitals using an exposure rate highlighted a distinctive way of identifying hospitals to be selected for CDI prevention assessment in addition to their SIR.
Recent studies have also highlighted the utility of linking surveillance and administrative data sets to enhance HAI surveillance. Reference Lee, Ronksley and Conly13,Reference Yi, Perkins and Kazakova14 Because the use of ICD codes alone can be problematic for HAI surveillance, Reference Redondo-González, Tenías, Arias and Lucendo15,Reference Goto, Ohl, Schweizer and Perencevich16 our study used a nationally recognized surveillance system (ie, the NHSN) to more accurately estimate the potential CDI burden in hospitals; we strengthened our analysis of the NHSN data by linking it with an administrative data set to identify important patient characteristics not included in LabID events. To ensure a robust merge between NHSN and OSHPD records, we used a subset of OSHPD records to only include patients that had CDI as one of the 25 diagnoses before linking the data based on the 4 key patient identifiers. Still, a higher number of cases was identified from OSHPD through ICD codes than from NHSN LabID events, suggesting that ICD codes may include a previous diagnosis of CDI from patient history. Still, we included the record if CDI was indicated in any diagnostic code position (up to 25) because our goal was to account for any possible CDI case in OSHPD to match with NHSN records (our gold-standard data set). We believe that the 76% successful merge of CDI LabID events provided a good representation of the CDI occurrence in California hospitals. The percentage of cases merged is also comparable to those in previous studies. Reference Hatfield, Baggs and Winston17 As expected, our study showed that patients with the CDI case records had a median age of 68 years and that Medicare beneficiaries accounted for 62% of the CDI case records. Nevertheless, the use of a statewide patient discharge data set yielded the inclusion of an additional 38% of CDI case records with other insurance types (or with no insurance), providing a comprehensive cohort with which to evaluate CDI in California licensed general acute-care hospitals reporting to the NHSN. Epidemiologic features, such as age and inpatient mortality of our CDI case records, were consistent with those previously reported. Reference Lessa, Mu and Bamberg4,Reference Mitchell and Gardner18,19
Unfortunately, we were not able to access CDI data in other healthcare facility types such as outpatient, long-term care settings, and veterans’ hospitals, and we were not able to evaluate patient exposures from these settings with the available data sets. Nonetheless, we identified the sources of direct admission for patients diagnosed with CDI. In particular, CDI matched-case admissions were directly admitted from a skilled nursing or intermediate care setting at a higher percentage (8% difference) compared to the overall discharge admissions. This finding highlights the importance of sharing of patients with CDI for disease transmission within these interconnected acute-care and long-term care facilities.
The calculation of hospital exposure rates provides a novel method for identifying hospitals potentially exposing patient risk factors for CDI that are then diagnosed at other hospitals. Because SNFs play an important role in disease transmission, Reference Garg, Mirza and Girotra20,Reference Campbell, Giljahn and Machesky21 we excluded direct admissions from SNFs to diagnosing hospitals to avoid erroneously attributing that admission to the exposure hospital, so that the role of exposure hospitals may have been underestimated.
We ranked the exposure hospitals based on hospital type to enable fair comparisons among these facilities. Long-term acute-care hospitals (LTACHs) showed the highest exposure rates. This finding was not unexpected because this setting has been shown to have high CDI incidence. 1,Reference Chopra and Goldstein22 LTACH patients are at particularly high risk for CDI given their age, prolonged hospitalizations, prior hospitalizations, severe underlying comorbidities, multiple and longer courses of antibiotics, and deficiencies in infection control. Reference Chopra and Goldstein22 Rehabilitation acute-care hospitals had the second highest exposure rate, suggesting that this setting could be a possible target for CDI prevention, which would not normally be targeted by the SIR. Patients from rehabilitation hospitals are also likely at risk for CDI because they tend to be older, to be recovering from surgical procedures, and to have had extended antibiotic therapy exposures and prior hospitalizations.
The hospital exposure rate was not correlated with that hospital’s CDI SIR, which might be the result of patients admitted to the exposure hospital for conditions associated with short-term stays and antibiotic administration, such as community-acquired pneumonia, and subsequent development of CDI after discharge. This finding should be explored by further examining high-exposure hospitals. However, the slightly positive association between exposure rate and hospital composite CDI rate provides supporting evidence that high-ranked exposure hospitals also have a high CDI burden in their facility and that they are potential healthcare drivers for CDI susceptibility and transmission contributing to the CDI burden at different hospitals. Thus, high-ranked exposure hospitals might have a combination of high colonization pressure facilitating transmission of C. difficile spores and gaps in antibiotic stewardship practices leading to CDI predisposition.
Overall, this study allowed us to better describe characteristics of patients with CDI in California, to improve our understanding of the movement of patients with CDI between healthcare settings, and to detect healthcare facilities that could be potentially exposing patients to risk factors for CDI, which can complement targeted public health interventions and activities to address prevention.
Acknowledgments
We are grateful to all California hospitals reporting their data into NHSN and for the Office of Statewide Health Planning and Development for the patient discharge data provided for this study. We also thank the Healthcare-Associated Infections Program, especially Melissa Kealey PhD, for their valuable support.
Financial support
All authors have no financial support to disclose.
Conflicts of interest
All authors report no conflicts of interest relevant to this article.