Implications
Reduction of enteric methane (CH4) emissions from cattle is becoming an increasing concern due to its global warming potential. This original research uncovers new information on technical and economic factors for commercial dairy herds directly or indirectly associated with lactating dairy cow gastro-enteric CH4 production. The obtained results contribute to identifying practices associated with reduced lactating dairy cow CH4 production in practice, and to assess the economic viability of herds emitting little CH4 in a context of sustainable dairy farming. This could influence both farmers’ approach to achieving CH4 reduction, and the ways in which policy makers could provide effective support.
Introduction
According to the Intergovernmental Panel on Climate Change, agriculture and forestry is responsible for 24% of the greenhouse gases (GHG) emitted world-wide (Intergovernmental Panel on Climate Change, 2014). Cattle production represents the largest part of this, generating carbon dioxide, CH4 and nitrous oxide. Gastro-enteric CH4 from anaerobic fermentation of feed in the rumen and hindgut is the largest source of cattle GHG, representing 46.5% of total cattle emissions (Food and Agriculture Organization of the United Nations (FAO), 2013). In addition to the environmental pollution, 2% to 12% of gross energy is lost through CH4 emissions, which reduces the consumed energy available for the cow (Johnson and Johnson, Reference Johnson and Johnson1995).
Understanding factors influencing gastro-enteric CH4 production from dairy cows is an important step in reducing its impact. These factors have been widely studied and include: the level of dry matter intake (DMI); feed composition (e.g. starch, fibre and lipid content); feed processing; herd management (e.g. breed, available grasslands); and genetics (e.g. Gerber et al., Reference Gerber, Henderson and Makkar2013; Hristov et al., Reference Hristov, Oh, Lee, Meinen, Montes, Ott, Firkins, Rotz, Dell, Adesogan, Yang, Tricarico, Kebreab, Waghorn, Dijkstra and Oosting2013; Pickering et al., Reference Pickering, Oddy, Basarab, Cammack, Hayes, Hegarty, Lassen, McEwan, Miller, Pinares-Patiño and de Haas2015). However, such studies were usually conducted using a small number of animals and farms. In addition, the effects of a limited number of factors at a time was usually studied under controlled conditions in experimental settings, with other factors being fixed (e.g. Brask et al., Reference Brask, Lund, Weisbjerg, Hellwing, Poulsen, Larsen and Hvelplund2013; Hart et al.; Reference Hart, Huntington, Wilkinson, Bartram and Sinclair2015, Hatew et al., Reference Hatew, Bannink, Van Laar, De Jonge and Dijkstra2016).
Beyond this, results on the relationship between gastro-enteric CH4 and the economic performance of dairy herds are scarce in the research literature. The only economic aspects studied were the estimation of the cost of specific enteric CH4 mitigation measures, such as the adoption of specific feeding strategies (e.g. Van Middelaar et al., Reference Van Middelaar, Dijkstra, Berentsen and De Boer2014; Moraes et al., Reference Moraes, Fadel, Castillo, Casper, Tricarico and Kebreab2015). Studies analysing the link between all GHG emissions at the farm level and economic results have also been carried out in several countries, but these did not focus on gastro-enteric CH4 production only and assumed equal CH4 emissions for all cows in the herd, often based on literature reference values or mechanistic models (e.g. Beukes et al., Reference Beukes, Gregorini, Romera, Levy and Waghorn2009; Thomassen et al., Reference Thomassen, Dolman, Van Calker and de Boer2009; O’Brien et al., Reference O’Brien, Hennessy, Moran and Shalloo2015). Given the economic difficulties encountered by dairy farmers (i.e. volatile milk price, increasing input prices), it would be useful to study such relationships in order to avoid profitability loss when global management strategies to mitigate CH4 production are adopted.
A major issue for any study of gastro-enteric CH4 at a herd level in a commercial environment is the difficulty in providing reasonable estimates of CH4 production on a large scale. Recent advances have been reported in the use of milk mid-IR (MIR) spectra and lactation stage-based predictions (Vanlierde et al., Reference Vanlierde, Vanrobays, Dehareng, Froidmont, Soyeurt, McParland, Lewis, Deighto, Grandl, Kreuzer, Gredler, Dardenne and Gengler2015), which have already been used successfully in a large-scale study on lactating dairy cows (Vanlierde et al., Reference Vanlierde, Vanrobays, Gengler, Dardenne, Froidmont, Soyeurt, McParland, Lewis, Deighton, Mathot and Dehareng2016). In this context, the objective of the present study was to investigate the univariate relationships between lactating dairy cow gastro-enteric CH4 production (g/day) predicted from milk MIR spectra and technical and economic variables in commercial dairy herds. To achieve this objective, individual cow milk MIR CH4 predictions were pooled for each herd and each year and associated with technical and economic variables from the corresponding herds and years. Correlations were used to study univariate relationships between milk MIR CH4 and technico-economic variables.
Material and methods
Operations of data editing, processing and statistical analyses were implemented using SAS® 9.4 software (Statistical Analysis Software; SAS Institute Inc. Cary, NC, USA) and R 3.4.1.
Data
Two different data sets were merged to achieve the objective of this study: the Walloon milk recording database and the dairy herd accounting database, both managed by the Walloon Breeding Association (AWE, Ciney, Belgium). The milk recording data set includes milk production and milk composition data as well as milk MIR spectra expressed on individual cow and test-day level. Milk MIR spectra are obtained by the analysis of individual milk samples on MilkoScan FT6000 spectrometers (Foss, Hillerod, Denmark) at the ‘Comité du Lait’ laboratory (Battice, Belgium). Milk recording data are collected every 4 or 6 weeks. This study used 525 697 individual records from 40 314 dairy cows in 206 herds registered for the Walloon milk recording from January 2007 to April 2014. The accounting data set contains technico-economic data expressed at herd and year level. All studied herds had Holstein as the main breed, at least 5 months of milk recording per accounting year, more than 10 cows per recording day and more than 60% of cows registered for milk recording. Data were combined to obtain 1024 records including technical and economic variables as well as a milk MIR CH4 prediction calculated on a herd and year basis.
Technical variables
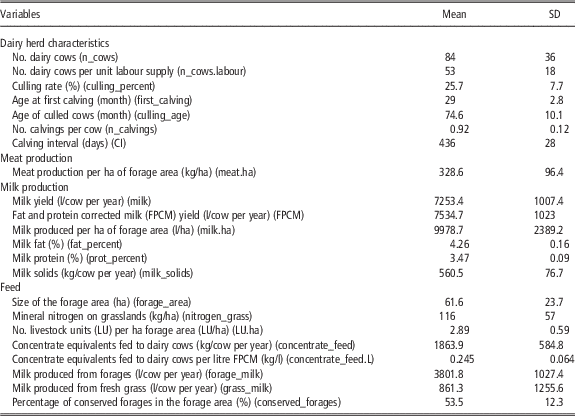
The list and descriptive statistics of technical variables, divided into four categories, are presented in Table 1. The category ‘dairy herd characteristics’ includes variables relative to the number of cows, calvings and culling. ‘Meat production’ includes meat production per hectare of forage area. The category ‘milk production’ includes milk yield variables and milk composition variables. The category ‘feed’ relates to forage areas management and concentrate feed. All technical variables used in this study concern dairy cows only and do not take young stock into account, except the following variables: meat production per ha forage area, size of the forage area, mineral nitrogen on grasslands, number of livestock units per ha of forage area and percentage of conserved forages in the forage area. These apply to young animals from the dairy herd such as heifers and calves, as well as to the dairy cows.
Description of the technical variables for the 1024 dairy cow herd_year records

Abbreviations of the variable names are in round brackets.
Economic variables
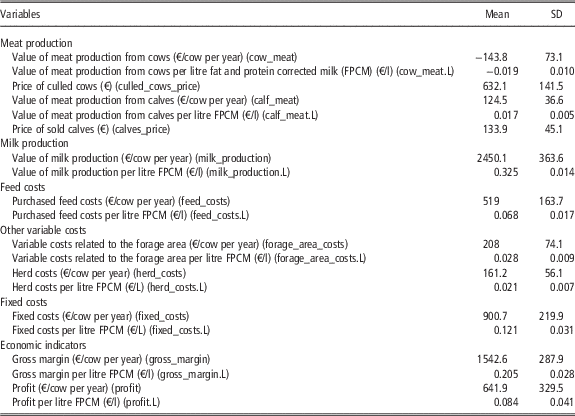
The list and descriptive statistics of economic variables, divided in six categories, are presented in Table 2. All economic variables are part of two economic indicators: the gross margin and profit allocated to the dairy cows, expressed per cow (€/cow per year) or per litre of fat and protein corrected milk (FPCM) (€/l FPCM). They are calculated in the accounting database as:
 $$\eqalignno{ {\rm Gross}\,{\rm margin} \, {\equals}&\, ( {{\rm value}\,{\rm of}\,{\rm milk}\,{\rm production} }\cr &{ {\plus} {\rm value}\,{\rm of}\,{\rm meat}\,{\rm production}\,{\rm from}\,{\rm cows}} \cr & {{\plus} {\rm value}\,{\rm of}\,{\rm meat}\,{\rm production}\,{\rm from} \,{\rm calves}} )\cr &{{\rm \minus }\,( {{\rm purchased}\,{\rm feed}\,{\rm costs} } } \cr & {\plus}{\rm proportional}\,{\rm costs}\,{\rm related}\,{\rm to}\,{\rm the}\,{\rm forage}\,{\rm area } \cr & {{\plus}{\rm herd}\,{\rm costs}} ) $$
 $${\rm Profit}\, {\equals}\, {\rm gross}\,{\rm margin}-{\rm fixed}\,{\rm costs }$$
Description of the economic variables for the 1024 dairy cow herd_year records

Abbreviations of the variable names are in round brackets.
All variables included in equations (1) and (2) and in Table 2 concern dairy cows only, without taking young stock into account. The value of meat production from calves, which only takes into account the value of new-born calves, is also included in the dairy cow gross margin and profit as it is a production from the dairy cows. Herd costs include veterinary costs, medicines, litter and miscellaneous costs. The gross margin and profit (per cow or litre FPCM) were corrected to remove the year effect caused by large fluctuations in milk and purchased feed prices over the years. This step is necessary in order to analyse data from different years together as one data set. The two variables ‘value of milk production’ and ‘purchased feed costs’ (per cow or litre FPCM) were therefore corrected as follows:
 $$\eqalignno{ {\rm Corrected}\,&{\rm value}\,{\rm of}\,{\rm milk}\,{\rm production} \cr & \, {\equals}\, {{{\rm Value}\,{\rm of}\,{\rm milk}\,{\rm production} } \over {{\rm Average}\,{\rm annual}\,{\rm price}\,{\rm for}\,{\rm 100}\,{\rm l}\,{\rm of}\,{\rm milk}}} \cr & {\times}{\rm Average}\,{\rm price}\,\left( {{\rm for}\,{\rm all}\,{\rm years}} \right)\,{\rm for}\,100\,{\rm l}\,{\rm of}\,{\rm milk} $$
 $$\eqalignno{& {\rm Corrected}\,{\rm purchased}\,{\rm feed}\,{\rm costs} \cr & \ \ \ {\equals}\, {{{\rm Purchased}\,{\rm feed}\,{\rm costs}} \over {{\rm Average}\,{\rm annual}\,{\rm price}\,{\rm of}\,{\rm the}\,{\rm concentrate}\,{\rm equivalent}}} \cr & \ \ {\times}{\rm Average}\,{\rm price}\, \left( {{\rm for}\,{\rm all}\,{\rm years}} \right)\,{\rm of}\,{\rm the}\,{\rm concentrate}\,{\rm equivalent} \cr & $$
Corrected gross margin and profit were calculated by summing their respective components (equations (1) and (2)), including the two corrected variables (equations (3) and (4)).
Herd- and year-based milk mid-IR methane predictions
Milk MIR CH4 predictions from individual cows were pooled to obtain one prediction for each herd and year. First, CH4 production (g/day) (MIR-CH4) from individual lactating dairy cows was predicted from the recorded milk MIR spectra using the dependent-lactation-stage equation developed by Vanlierde et al. (Reference Vanlierde, Vanrobays, Gengler, Dardenne, Froidmont, Soyeurt, McParland, Lewis, Deighton, Mathot and Dehareng2016). The equation has cross-validation R 2 and standard error of 0.70 and 70 g/day, respectively. We consider the equation to be appropriate for the milk MIR spectra used in this study as reference values in the calibration set came from similar Walloon herds (Vanlierde et al., Reference Vanlierde, Vanrobays, Gengler, Dardenne, Froidmont, Soyeurt, McParland, Lewis, Deighton, Mathot and Dehareng2016). MIR-CH4 records were predicted only for cows with days in milk between 5 and 365. To discard potential outlier records, MIR-CH4 predictions with a standardised Mahalanobis distance from the calibration set higher than 10 were discarded (Whitfield et al., Reference Whitfield, Gerger and Sharp1987) as well as the 0.5% upper and 0.5% lower data. Second, one MIR-CH4 prediction was calculated for each herd and each year (i.e. herd_year-based MIR-CH4; HYMIR-CH4) in order to match technico-economic variables expressed on a herd and year basis. In this way for each herd and year the median of individual MIR-CH4 records was calculated for each month of milk recording. The median was used instead of the mean because it is less affected by potential extreme values that could occur within a test day of milk recording. The median values were corrected for the year effect as follows:
 $$\eqalignno{ & {\rm Corrected}\,{\rm MIR}{\hbox {-}}{\rm CH}_{4} \,{\rm monthly}\,{\rm median} \cr & \, \quad {\equals}\, ( {{\rm MIR}{\hbox {-}} {\rm CH}_{4} \,{\rm monthly}\,{\rm median}-{\rm annual}\,{\rm MIR}} {\hbox {-}}{\rm CH}_{4} {\,{\rm mean}}){\rm } \cr & \quad \quad {\plus}{\rm MIR}{\hbox {-}}{\rm CH}_{4} \,{\rm mean}\,{\rm for}\,{\rm all}\,{\rm years} $$
Then, for each year, the corrected herd_year median values were modelled using the GLM with herd and month as fixed effects. The least squares mean of the herd effect obtained was finally used as HYMIR-CH4 for all further analyses. CH4 production (g/day) was used as CH4 trait preferentially to CH4 intensity (g/kg milk) in this study because it appeared that CH4 intensity was very highly correlated with milk yield (r=−0.94 v. r=0.11 for HYMIR-CH4), meaning that most studied relationships would have been dependent on milk yield.
Relationships study
The normality of the distribution for HYMIR-CH4 and technico-economic variables was assessed by measuring skewness and kurtosis. Non-normal variables were transformed using a base 10 logarithm function. The relationships between each technico-economic variable and HYMIR-CH4 were studied individually by using Pearson correlation coefficients (r). The correlation values were deemed significantly different from zero when P values were lower than 0.05. Relationships between HYMIR-CH4 and technico-economic variables were tested for quadratic effect by using the GLM with a quadratic term to ensure they were appropriate for correlation analysis requiring approximate linear relation.
Results
The mean for HYMIR-CH4 was 476 g/day, with a SD of 15.8 g/day. The minimum and maximum values were 423 and 526 g/day, respectively.
Technical variables
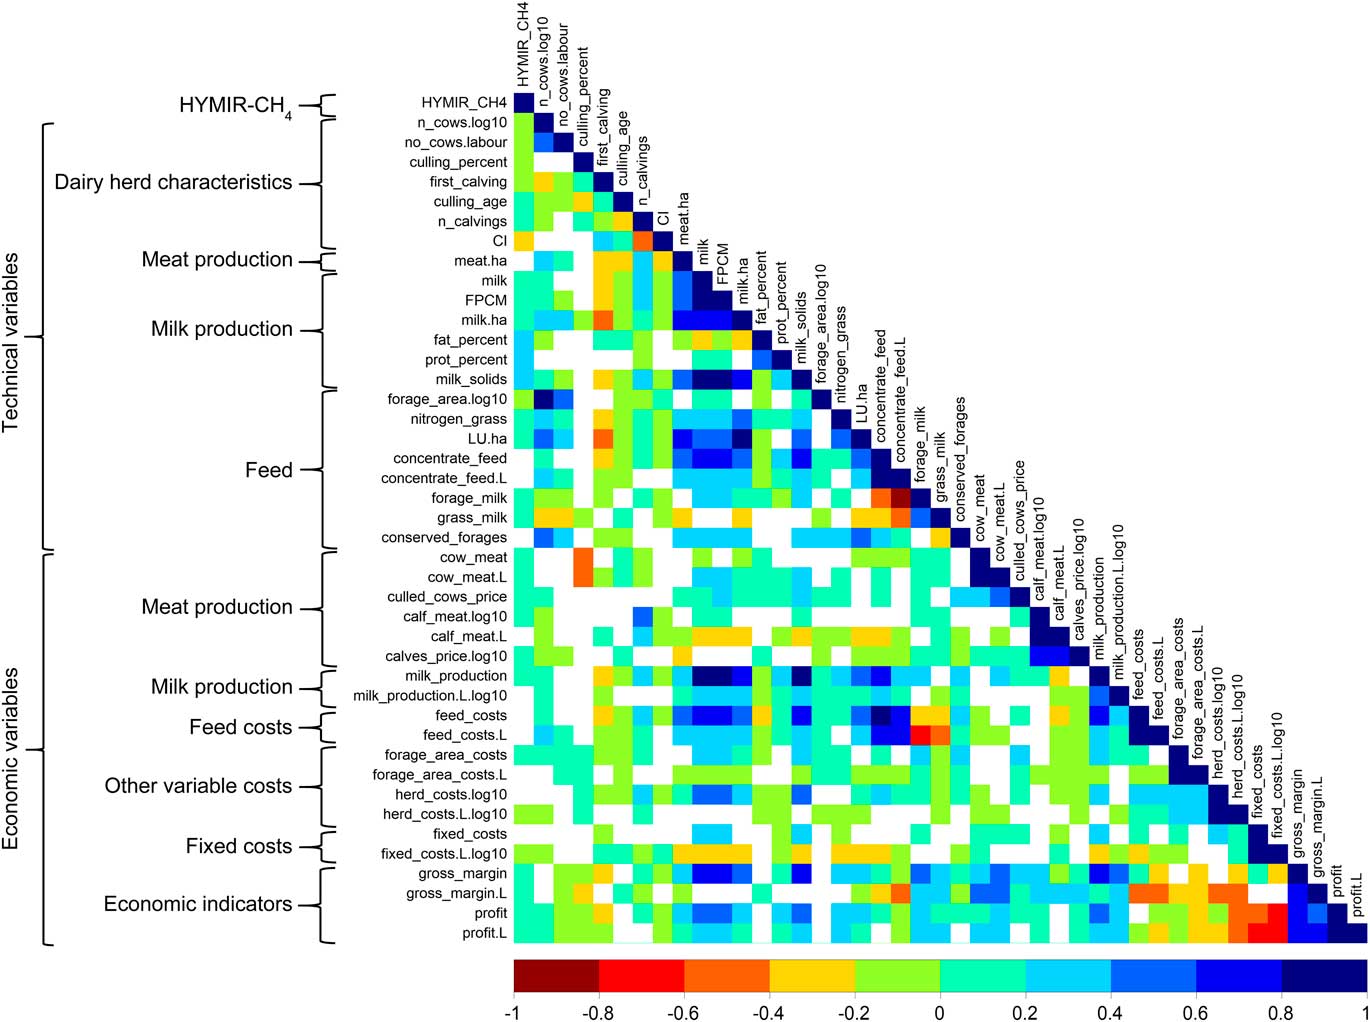
Correlations between HYMIR-CH4 and technical variables are presented in Figure 1. Significant r (P<0.05) ranged between |0.06| and |0.38|. Regarding herd characteristics, low HYMIR-CH4 herds had a higher culling rate (r=−0.15), higher age at first calving (r=−0.09), lower age of culled cows (r=0.06), longer calving interval (r=−0.21) and a lower number of calvings per cow (r=0.10). Low HYMIR-CH4 was also associated with a higher number of dairy cows (log10) (r=−0.13) and higher number of dairy cows per unit labour supply (r=−0.10). Looking at meat production, the number of kilograms of meat produced per hectare of forage area did not change depending on the level of HYMIR-CH4 (P>0.05). Concerning milk production variables, milk fat and protein percentages were lower in low HYMIR-CH4 herds; the correlation with HYMIR-CH4 was the highest for these two variables (r=0.38 and 0.33, respectively). Low HYMIR-CH4 herds produced less milk (r=0.11), less FPCM (r=0.18), less milk solids (r=0.20) and less milk per hectare of forage area (r=0.08) compared with high HYMIR-CH4 emitters. As for feed, the size of the forage area (log10) was larger (r=−0.14) and the number of livestock units per hectare was lower (r=0.07) for herds producing less HYMIR-CH4. Lower HYMIR-CH4 production was associated with a lower quantity of mineral nitrogen applied on grasslands (r=0.15) as well as a lower quantity of milk produced from forages (r=0.12) and from fresh grass (r=0.09). The quantity of concentrate equivalents fed per litre FPCM and the proportion of conserved forages in the forage area did not show any significant difference for low or high HYMIR-CH4 herds (P>0.05), though there was a trend (0.05<P<0.10) for higher concentrate equivalents per cow for high HYMIR-CH4 herds.
(colour online) Heatmap of correlations between lactating dairy cow herd_year-based milk mid-IR CH4 production (HYMIR-CH4) and herd_year technico-economic variables. Abbreviations for technico-economic variables are provided in Tables 1 and 2. Variable with names ending with ‘.log10’ were log-transformed. White colour means non-significant relationship (P>0.05).

Economic variables
Correlations between HYMIR-CH4 and economic variables are presented in Figure 1. Significant r (P<0.05) ranged between |0.07| and |0.19|. HYMIR-CH4 was positively linked to gross margin per cow and per litre FPCM (r=0.19 and 0.09, respectively). The profit per cow and per litre FPCM followed the same positive trend as the gross margin (r=0.18 and 0.16, respectively). Regarding meat production, low HYMIR-CH4 was associated with lower value of meat production from cows expressed either per cow or per litre FPCM (r=0.15 and 0.19, respectively). The value of meat production from calves per cow (log10), the price of culled cows and the price of calves (log10) were also lower for herds producing less HYMIR-CH4 (r=0.07, 0.08 and 0.08, respectively). The value of milk production per cow was lower for herds producing less HYMIR-CH4 (r=0.16), but there was no significant relationship for the value of milk production per litre FPCM (log10) (P>0.05). Feed costs per cow and per litre FPCM were not significantly different for herds with low or high HYMIR-CH4 (P>0.05). Regarding other costs, low HYMIR-CH4 herds had lower variable costs related to the forage area per cow (r=0.13). There was a trend (0.05<P<0.10) for lower variable costs related to the forage area per litre FPCM for low HYMIR-CH4 herds. No relation was observed for the herd costs per cow (P>0.05), but low HYMIR-CH4 was associated with higher herd costs per litre FPCM (log10) (r=−0.07). Fixed costs per litre FPCM (log10) were higher for herds emitting less HYMIR-CH4 (r=−0.14), but there was no significant relationship for fixed costs per cow (P>0.05).
Discussion
Herd- and year-based milk mid-IR methane predictions
HYMIR-CH4 values were within the range of CH4 measurements reported in the literature, varying from 300 to 600 g/day, though the SD was inferior to those reported in previous papers for individual cows, varying from 50 to 150 g/day (e.g. Hart et al., Reference Hart, Huntington, Wilkinson, Bartram and Sinclair2015; Hatew et al., Reference Hatew, Bannink, Van Laar, De Jonge and Dijkstra2016; Hristov et al., Reference Hristov, Oh, Giallongo, Frederick, Harper, Weeks, Branco, Price, Moate, Deighton, Williams, Kindermann and Duval2016). The reason is that HYMIR-CH4 is expressed at the herd level, which reduces the individual cow variability existing within herds.
An important consideration about the obtained results was that the univariate relationships between HYMIR-CH4 and technico-economic variables were weak as r were always lower than |0.38|. Despite this, significant relationships were highlighted and general assumptions could be made. The observed relationships could be direct or indirect and do not imply causality.
Relationship with milk composition
It was observed that, amongst technical variables, milk fat and protein content were the variables that best correlated with HYMIR-CH4 (r=0.38 and 0.33, respectively; Figure 1). An increase in milk fat and protein content was associated with higher HYMIR-CH4 (Figure 1). These relationships were not just an artefact of the method used to predict CH4 in this study. Indeed, MIR-CH4 predictions obtained by the equation were not just the result of specific milk components already predicted by MIR but the result of the new recombination of global spectra information using other spectral regions (Dehareng et al., Reference Dehareng, Delfosse, Froidmont, Soyeurt, Martin, Gengler, Vanlierde and Dardenne2012; Vanlierde et al., Reference Vanlierde, Vanrobays, Dehareng, Froidmont, Soyeurt, McParland, Lewis, Deighto, Grandl, Kreuzer, Gredler, Dardenne and Gengler2015). The relationship between HYMIR-CH4 and fat content is partially explained by the fact that milk fat content and composition and CH4 production are both dependent on ruminal fermentation (Dehareng et al., Reference Dehareng, Delfosse, Froidmont, Soyeurt, Martin, Gengler, Vanlierde and Dardenne2012). Carbohydrates are the primary source of energy for the cow. The end products of carbohydrate degradation are, amongst others, volatile fatty acids (VFA; the three principle VFA are acetate, butyrate and propionate), CO2 and H2. During the fermentation process, acetate and butyrate promote CH4 production. The same VFA also increase the fat content in milk, especially short-chain saturated fatty acids (FA) (Moss et al., Reference Moss, Jouany and Newbold2000; National Research Council, 2001). In practice, on the one hand, Soyeurt et al. (Reference Soyeurt, Dardenne, Gillon, Croquet, Vanderick, Mayeres, Bertozzi and Gengler2006) showed a correlation of 0.95 between milk fat content and the proportion of milk saturated FA (constituting 70% of total milk FA). On the other hand, Chilliard et al. (Reference Chilliard, Martin, Rouel and Doreau2009) showed a positive relationship between daily CH4 production and milk saturated FA. This could explain why milk fat content was positively linked to HYMIR-CH4 in the present study.
Regarding protein content, there is little evidence in the literature to suggest that milk protein content is related to CH4 production. A possible explanation might be that higher DMI might be needed in order to provide more energy for higher milk protein production. This would also lead to more CH4 production as DMI is a driver for CH4 production (National Research Council, 2001; Muetzel, Reference Muetzel2011). In addition, there could be an indirect relationship between HYMIR-CH4 and milk protein content due to the positive correlation existing between milk fat content and milk protein content (Figure 1).
Relationship with milk yield
In the current study, increasing milk or FPCM production as well as milk solids yield was associated with increasing HYMIR-CH4 (Figure 1). Garnsworthy et al. (Reference Garnsworthy, Craigon, Hernandez-Medrano and Saunders2012) showed that CH4 production was positively related to milk yield (R 2=0.50). This also agrees with the findings of Gerber et al. (Reference Gerber, Vellinga, Opio and Steinfeld2011). The reason mentioned by Garnsworthy et al. (Reference Garnsworthy, Craigon, Hernandez-Medrano and Saunders2012) was that milk yield is positively linked to DMI, which is a primary driver for CH4 production. In contrast, Bell et al. (Reference Bell, Potterton, Craigon, Saunders, Wilcox, Hunter, Goodman and Garnsworthy2014) showed that the link between milk yield and CH4 production (mg/l of eructed air) varied amongst commercial farms; CH4 production increased with increasing milk production on most farms, but decreased on some farms. The author suggested that this disparity may reflect differences in cow diet composition, energy efficiency and management. Kandel et al. (Reference Kandel, Vanrobays, Vanlierde, Dehareng, Froidmon, Gengler and Soyeurt2017) also cited similar arguments to explain the weak relationship observed between MIR CH4 production and milk yield (r=0.33) in their study. For example, Holstein herds selected for higher feed efficiency can produce more milk at a given level of DMI compared with Holstein herds with a lower feed efficiency, which means higher milk yield without higher production of CH4 (as CH4 production is correlated with DMI) (Muetzel, Reference Muetzel2011; Kristensen et al., Reference Kristensen, Jensen, Østergaard, Weisbjerg, Aaes and Nielsen2015). The role of different diets fed to low- or high-yielding dairy cows (e.g. forages v. concentrates) can also have an impact on the relationship between milk yield and CH4 production (c.f. paragraph below). This might explain the weak relationships observed in the current study involving herds with different genetic performances and management practices.
Relationship with feed
The effect of diet type on CH4 has largely been studied in controlled experiments. For example, concentrate feed is known to decrease CH4 emissions per kg DMI through higher propionate production in the rumen (hydrogen sink) compared with acetate (hydrogen source used by methanogens to generate CH4) and through accelerated passage rate in the digestive tract. However, it could increase CH4 production per cow and day in some cases because of increased feed intake, though different effects were observed depending on the context of the experiment (Moss et al., Reference Moss, Jouany and Newbold2000; Knapp et al., Reference Knapp, Laur, Vadas, Weiss and Tricarico2014). In the current study, there was no relationship observed between HYMIR-CH4 and the quantity of concentrate equivalents given per cow or per litre FPCM. There was, however, a slight trend (0.05<P<0.01) towards lower HYMIR-CH4 for herds fed less concentrate equivalents per cow, in line with some literature results (Figure 1; Knapp et al., Reference Knapp, Laur, Vadas, Weiss and Tricarico2014). It also appeared that low HYMIR-CH4 herds had a lower quantity of milk produced from forages and fresh grass (Figure 1). This could be due to lower intake of forages and fresh grass. This lower intake could be the result of lower genetic DMI capacity, which is known to reduce CH4 production (Muetzel, Reference Muetzel2011), or a lower proportion of grass in the diet compared with other feed for some herds. Indeed, a lower proportion of forages and grass may lead to less CH4 per unit DMI because of lower acetate production in the rumen compared with propionate (Moss et al., Reference Moss, Jouany and Newbold2000). Lower DMI could also be due to lower forage quality (more fibrous and less digestible – reflected by less nitrogen on grasslands in this study; Figure 1) (Warner et al., Reference Warner, Podesta, Hatew, Klop, Van Laar, Bannink and Dijkstra2015). Similarly to our study, Bell et al. (Reference Bell, Potterton, Craigon, Saunders, Wilcox, Hunter, Goodman and Garnsworthy2014) investigated differences in CH4 production between different diets on commercial dairy farms in the same country (partial mixed ration v. partial mixed ration with grazed pasture), but found no significant difference. The reason suggested by the author was that diets could be all of relatively equal quality despite different components, or that more detailed information on diet composition was needed. Besides, in the current study low HYMIR-CH4 herds seemed to show some characteristics of more extensive management of forage areas – that is a lower number of livestock units per ha, lower milk production per ha and lower quantity of mineral nitrogen applied on grasslands (Figure 1).
Relationship with herd characteristics
In addition, the obtained results revealed that herds producing less HYMIR-CH4 seemed to have lower reproduction and health performances (c.f. herd characteristics, Figure 1). Information about similar relationships is scarce in the literature, but indirect relationships could be assumed. According to Lucy (Reference Lucy2001), a longer calving interval or lower number of calvings per cow (observed in this study for low HYMIR-CH4 emitters; Figure 1) might reflect reproduction problems. According to Drogoul et al. (Reference Drogoul, Gadoud, Joseph, Jussiau, Lisberney, Mangeol, Montmeas and Tarrit2004), higher age at first calving, as observed for low HYMIR-CH4 emitters in this study (Figure 1), can be associated with suboptimal nutrition or reproduction problems in heifers. Higher culling rate and lower age of culled cows, also observed for low HYMIR-CH4 emitters (Figure 1), could be associated with herds that have more health (e.g. lameness, mastitis), fertility or production problems (Adamczyk et al., Reference Adamczyk, Makulska, Jagusiak and Węglarz2017). According to Lucy (Reference Lucy2001) and Windig et al. (Reference Windig, Calus and Veerkamp2005), it is possible that suboptimal reproductive management could be linked to less global care of the herd by the farmer, suboptimal feeding and health conditions, all three of which are also often linked to lower milk production performances (associated with low HYMIR-CH4 in this study). Higher number of cows per labour supply for low HYMIR-CH4 emitters (Figure 1) might also mean that the farmer has less time to care for all cows well. These assumptions could explain the observed indirect relationships with HYMIR-CH4.
Relationship with economic results
Lower gross margin and profit per cow and litre FPCM were associated with low HYMIR-CH4, though large variability between herds was observed, meaning that it is possible to find lactating dairy herds with both reduced CH4 production and good economic results. Due to the lack of information regarding dairy cow gastro-enteric CH4 production and economy, the interpretation of the relationships between HYMIR-CH4 and economic variables was based on interactions with the technical variables discussed previously.
The lower gross margin per cow for low HYMIR-CH4 herds was the result of the lower value of milk production and the lower value of meat production from cows and from calves expressed per cow (r value of milk production per cow|gross margin per cow=0.75, r value of meat production from cows per cow|gross margin per cow=0.28 and r value of meat production from calves per cow|gross margin per cow=0.26, Figure 1). In this study, the value of meat production from cows was calculated on the basis of the value of the kg exported out of the dairy herd (i.e. sold animals such as culled cows, dead animals), plus kg related to inventory change, minus kg imported into the dairy herd (i.e. heifers becoming cows and purchased cows). The observed lower value of meat production from cows expressed per cow could thus partly be due to higher a culling rate observed in the technical part (r culling rate|value of meat production from cows per cow=−0.47, Figure 1). Indeed, higher culling rate would mean more heifers are needed, which usually have higher value than culled cows. Another reason could be the slightly lower value for culled cows (r price of culled cows|value of meat production from cows per cow=0.36, Figure 1).
The value of meat production from calves took into account the value of new-born calves sold or calves raised on the farm. The observed lower value of meat production from calves expressed per cow for low HYMIR-CH4 emitters could be partly explained by a lower number of calvings per cow (r number calvings per cow|value of meat production from calves per cow=0.40, Figure 1). The observed lower value of milk production from cows associated with low HYMIR-CH4 emitters was the result of lower milk production (r milk yield|value of milk production per cow=0.95, Figure 1). The lower variable costs related to the forage area per cow for herds producing less HYMIR-CH4 might be partly explained by decreased chemical inputs for low HYMIR-CH4 emitters (r mineral nitrogen on grasslands|variable costs related to the forage area per cow=0.20, Figure 1) or by lower contracting costs.
Regarding the gross margin per litre FPCM, the observed lower value for low HYMIR-CH4 emitters was probably mainly the result of lower value of meat production from cows per litre FPCM and higher herd costs per litre FPCM (r value of meat production from cows per litre FPCM|gross margin per litre FPCM=0.41 and r herd costs per litre FPCM|gross margin per litre FPCM=−0.51, Figure 1). Lower profit per litre FPCM for low HYMIR-CH4 herds was also due to increased fixed costs per litre FPCM (r fixed costs per litre FPCM|profit per litre FPCM=−0.74, Figure 1). The lower value for meat production from cows per litre FPCM could partly be due to a higher culling rate (r culling rate|value of meat production from cows per litre FPCM=−0.46, Figure 1) or a slightly lower value for culled cows (r price of culled cows|value of meat production from cows per litre FPCM=0.40, Figure 1). The observed reduction in herd costs and fixed costs per litre FPCM with increasing HYMIR-CH4 was most probably due to the dilution effect of slightly higher FPCM yield, because herd costs and fixed costs per cow did not vary with HYMIR-CH4.
Intensity of the relationships
The weak relationships between HYMIR-CH4 and technico-economic variables in this study could be due to other factors in addition to those already explained above for specific variables. First, this study used a CH4 indicator (cross-validation R 2=0.70; Vanlierde et al., Reference Vanlierde, Vanrobays, Gengler, Dardenne, Froidmont, Soyeurt, McParland, Lewis, Deighton, Mathot and Dehareng2016) and no direct measurements on animals, which could have led to some imprecisions. In contrast, studies involving respiration chambers for CH4 measurement are expected to reduce CH4 variation compared with on-farm CH4 measurements (Garnsworthy et al., Reference Garnsworthy, Craigon, Hernandez-Medrano and Saunders2012b; Bell et al., Reference Bell, Potterton, Craigon, Saunders, Wilcox, Hunter, Goodman and Garnsworthy2014). Also, the present study comprised technico-economic variables and CH4 predictions expressed at the herd level. A similar study with individual cow data could make it possible to confirm these relationships or to find new ones, but some individual data are not easily available on a large scale. Besides, as mentioned in the introduction, CH4 production is influenced by several factors, with some important drivers reported in scientific literature being DMI and feed composition, which are themselves influenced by many other factors. Therefore, other variables which were not available in the databases used in this study might be more strongly associated with HYMIR-CH4 (e.g. herd genetics, concentrate and forage type and composition, farm environment, Hristov et al., Reference Hristov, Oh, Lee, Meinen, Montes, Ott, Firkins, Rotz, Dell, Adesogan, Yang, Tricarico, Kebreab, Waghorn, Dijkstra and Oosting2013; Knapp et al., Reference Knapp, Laur, Vadas, Weiss and Tricarico2014). Moreover, it is important to highlight that there was a large diversity of animals and management practices between herds in the studied data set. This means that several management factors varied simultaneously and in different ways for all commercial farms considered, with possible antagonistic effects and interactions. This differed from many studies reported in the literature in which animals often had a similar genetic background and were housed under the same conditions. In those studies, the effect of only one factor on CH4 production was usually assessed with other factors being fixed (e.g. Garnsworthy et al., Reference Garnsworthy, Craigon, Hernandez-Medrano and Saunders2012; Warner et al., Reference Warner, Podesta, Hatew, Klop, Van Laar, Bannink and Dijkstra2015). These reasons can explain the low correlations obtained in the present study, which arguably better represent the reality on commercial farms.
Conclusion
In conclusion, this study highlighted the fact that low lactating dairy cow gastro-enteric CH4 production was associated, on a herd and year level, with lower milk fat and protein percentages and lower FPCM yield, as well as with other characteristics such as more extensive management of forage areas or suboptimal reproduction and health performances. Results suggested that some of these characteristics lead to lower economic performances for herds producing less CH4. Due to the use of on-farm data, the relationships observed in the present study were weaker than in research conducted in controlled conditions and a large variability in technical and management practices was observed for herds with similar CH4 production. This implies that the numerous relationships between HYMIR-CH4 and technico-economic variables should be further studied in more detail, including the consideration of interactions and co-evolution aspects between variables. Conclusions drawn in this study regarding CH4 production could contribute to advanced studies taking into account other GHG and environmental impacts such as those assessed by life cycle analyses.
Acknowledgements
The authors acknowledge the milk laboratory Comité du Lait (Battice, Belgium) for providing spectral data and the Plateau de Calcul et Modélisation Informatique (CAMI) of the University of Liège, Gembloux Agro-Bio Tech for computing resources.