Introduction
Nanolayered composites (NLCs) have attracted much attention due to their excellent mechanical properties in recent years.[Reference Zhang, Liu and Sun1–Reference Zhang, Feng, Li, Lu, Huang, Wu and Chu5] However, metallic NLCs always exhibit poor ductility due to the strongly constrained dislocation activities with decreasing individual layer thickness (h).[Reference Li, Tan and Zhang6,Reference Zhang, Lei, Liu, Niu, Chen, Liu, Zhang and Sun7] In recent years, some researchers mainly focused on the relationship between the length scale-dependent fracture mode of NLCs and the strengthening mechanism or the constraint effect of a ductile layer on a brittle layer.[Reference Zhu, Li, Zhang, Tan and Liu8,Reference Zhang, Zhang, Liu, Zhang and Sun9] When the multilayer thickness is decreased to a few nanometers and tens of nanometers, dislocation activity is considered to be strongly suppressed and fatigue cracks tend to be localized at weak layer interfaces[Reference Evans, Rühle, Dalgleish and Charalambides10–Reference Verma and Jayaram13] and grain boundaries (GBs) of constituent layers.[Reference Wang, Volkert and Kraft14–Reference Anwar Ali, Radchenko, Li and Budiman17]
In recent years, the importance of tuning GB structure/morphology to enhance the extrinsic toughness of nanocrystalline materials is gradually revealed.[Reference Watanabe and Tsurekawa18–Reference Daniel, Meindlhumer, Zalesak, Sartory, Zeilinger, Mitterer and Keckes23] Through multiple crack deflection during fracture process, Daniel et al.[Reference Daniel, Meindlhumer, Baumegger, Zalesak, Sartory, Burghammer, Mitterer and Keckes21] enhanced fracture toughness of nanocrystalline TiN films up to 150% by fabricating tilted columnar grains with chevron-like shape instead of the traditional columnar microstructure. However, the effect of GB morphology/distribution of constituent layers on the fracture mode, especially fatigue cracking mode of NLCs, has not been investigated well. Ali et al.[Reference Anwar Ali, Radchenko, Li and Budiman17] observed the intergranular brittle failure of h = 20 nm Cu/Nb NLC beams fabricated by physical vapor deposition and attributed that to the columnar GBs with a high density. Since the weak GBs of nanograins are prone to cracking,[Reference Meyers, Mishra and Benson24,Reference Padilla and Boyce25] an increase in the tortuosity degree of the cracking path by artificially arranging nanocrystalline GBs in constituent layers seems to be an effective way to enhance cracking resistance of metallic NLCs. However, the quantitative relationship between fatigue crack deflection path and initial GB arrangement is still not understood well.
In this paper, a stochastic model was developed to quantitatively correlate the fatigue crack deflection path with the cross-sectional microstructure and the GB arrangement. The ultrafine-scale h = 20 nm and h = 5 nm Cu/W multilayers were adopted as a model material and corresponding microstructure and GB arrangement-dominant fatigue cracking mode were observed to verify the stochastic model.
Model description
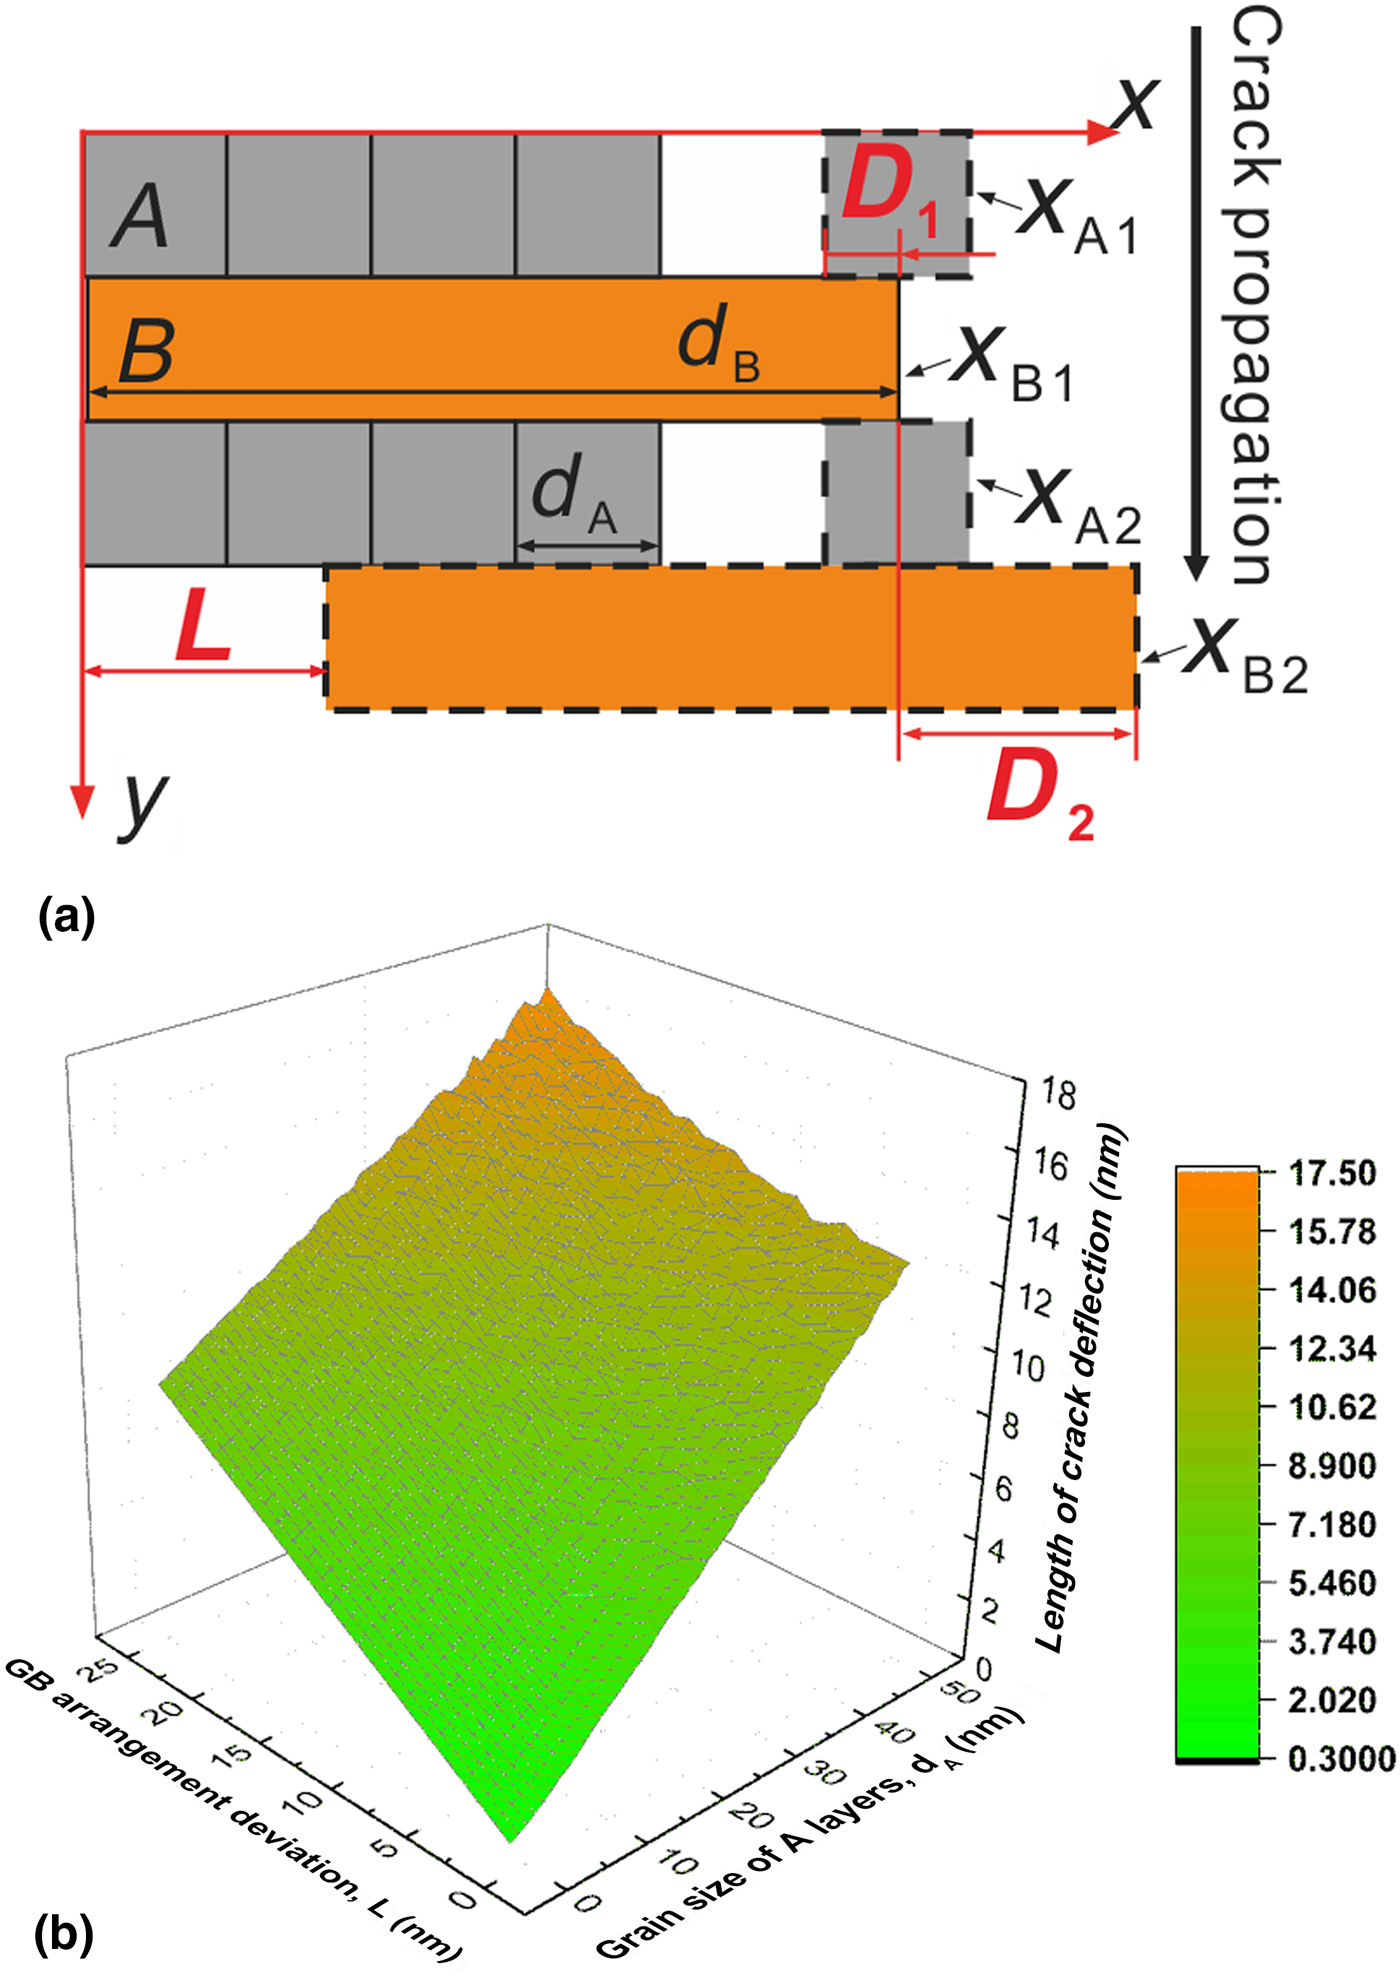
In the present study, the ultrafine-scale multilayers are simply modeled as a laminated structure that consisted of two constitute layers named A and B. The layer thickness applicable to the model is from several nanometers to tens of nanometers, as depicted in Fig. 1(a). A fatigue crack is assumed to initiate from the topmost A layer and grow along the y direction, as indicated by an arrow. Assuming that the crack would propagate along the GBs in constituent layers in the y direction, a crack approaching the interface has to advance along the interface for a certain distance until it reaches the nearest GB. Thus, the tortuosity degree of the crack path defined by the length of crack deflection along the layer interface depends on x axis location of GBs of adjacent constituent layers in front of the crack tip. In other word, the problem of the fatigue cracking path has been transformed into a random arrangement of GBs in a mathematical way. Here, GB arrangement deviation (L) is defined as the deviated length between the GBs of adjacent B layers along the y direction, which could quantitatively reveal the disorder degree of the GB arrangement. Due to the principle of propagating along the nearest GB, the maximum value of L is half of the grain size of B layers. In order to simplify the problem, only the GB arrangement of the B layers is considered.
(a) Schematic illustration of the stochastic model and (b) the calculated length of crack deflection as a function of GB arrangement deviation and grain size of A layers.
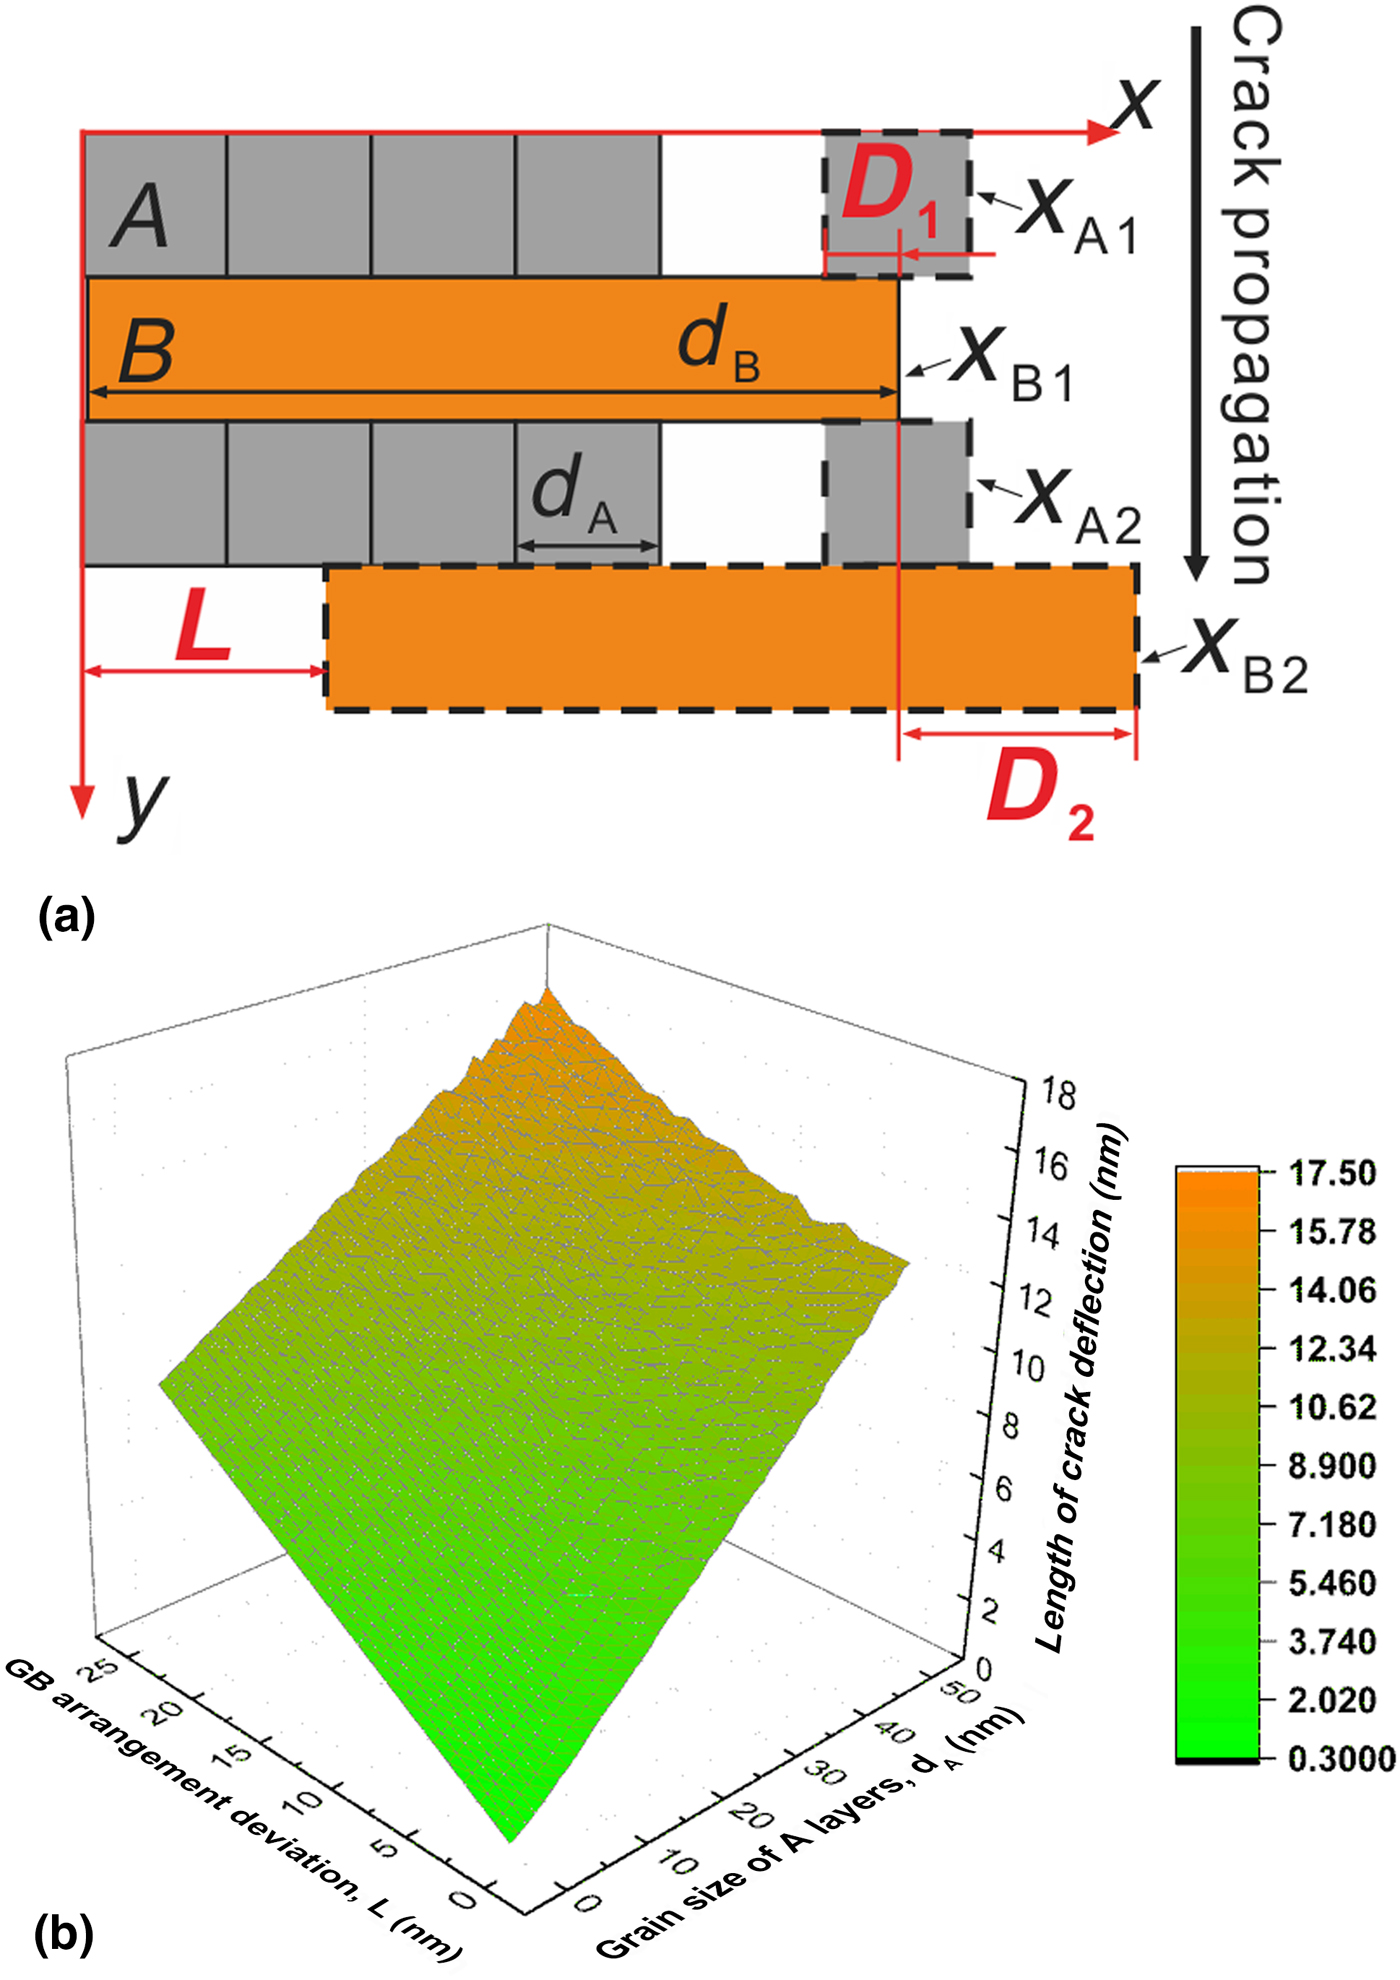
Firstly, the x axis location of GBs in front of the crack tip is defined as x ij, where i and j represent the constituent layers and the corresponding number of layers, respectively. The grain size of the B layers is assumed to be the GB location of the topmost B layer in front of the crack tip (x B1 = d B). The GB location of the second B layer relative to x B1 depends on L (x B2 = x B1 + L). The GB location of the upmost A layer (D 1) relative to x B1 is supposed to range from zero to half of the grain size of A layers (d A) under the condition of random arrangement (|x B1 − x A1|∈[0, d A/2]). Similarly, the GB location of the second A layer relative to x B1 is also in the same range (|x A2 − x B1|∈[0, d A/2]). Since the GB locations of the second A and B layers have been figured out, then the range of the distance between them (D 2) could be also obtained as|x B2 − x A2|∈[|L − d A/2|, L + d A/2]. Apparently the above calculation reveals that the length of crack deflection between the adjacent A and the B layers decreases with decreasing d A and L. A computer program was written using MATLAB® where the lengths of crack deflection were obtained by generating and averaging three random numbers (|x B1–x A1|, |x A2–x B1| and |x B2–x A2|) within their ranges which represent the average distance between adjacent GBs of constituent layers. The cyclic number of program running is set as 1 × 10⁴ to produce reliable results.
Secondly, a variation of d A from 0 to 50 nm and that of L from 0 to 25 nm is put into the program and the length of crack deflection as calculated by the model is presented in Fig. 1(b) as a function of GB arrangement deviation and grain size of the A layers for a fixed grain size of the B layers (50 nm). A clear trend shows that the deflection length decreases gradually with decreasing GB arrangement deviation and grain size of the A layers. When d A and L are smaller, the advance distance for the crack to reach the nearest GBs along x direction is decreased due to the enhanced degree of GB alignment. The model indicates that the tortuosity of the fatigue cracking path and the corresponding resistance to crack propagation for the ultrafine scale NLCs could be further enhanced through artificial interlacing GBs as far as possible. Thus, it is expected that an effective way to enhance fatigue properties of ultrafine scale NLCs without sacrificing the strength is to increase the in-plane grain size of constituent layers and cross-sectional GB arrangement deviation under constant layer thickness. However, considering the stronger epitaxial growth tendency of integral columnar grains with decreasing h to a few nanometers,[Reference Zhou, Zhang, Wei, Wang, Huang and Xu4,Reference Chen, Liu, Sun, Yu, Song, Wang and Zhang26] the resistance to crack propagation from the layer interface could be seriously weakened due to the increasing degree of the GB arrangement. As a result, there might be a trade-off between strength and fatigue properties and the corresponding balance should be made for the ultrafine-scale multilayers.
Experimental results and discussion
In order to verify the reliability of the stochastic model in describing the fatigue cracking path of ultrafine-scale multilayers, the cross-sectional crack propagation behavior of h = 20 nm and h = 5 nm Cu/W multilayers was studied. The Cu/W multilayers were deposited onto a polyimide (PI) substrate by direct current magnetron sputtering (Von Ardenne CS400ES) at room temperature. Before deposition, a base pressure in a chamber was evacuated to 5 × 10⁻⁷ Torr. The process pressure was 4 × 10⁻³ Torr with Ar plasma during deposition and the sputtering deposition was at a rate of 0.70 nm/s for Cu layers and 0.29 nm/s for W layers. The first layer on the polyimide substrate was Cu and the last layer (outmost layer) was W and the total film thickness was 600 nm. The cross-sectional microstructure was characterized by a transmission electron microscopy (TEM, FEI Tecnai F20). Repeated bending fatigue tests under constant deflection control (R = −1) were conducted on a home-built electromagnetic-driven apparatus at room temperature.[Reference Dai, Zhu and Zhang27,Reference Zheng, Luo, Wang and Zhang28] Dimensions of cantilever beam-type samples were 3 mm in width and 11 mm in length and the bending deflection was fixed to 2 mm. The Cu/W multilayers with different h were fatigued to 107 cycles at a frequency of 50 Hz. In order to analyze the fatigue cracking behavior along the thickness direction (TD), fatigued Cu/W multilayer samples were cross-sectioned by a three-ion-beam cutting instrument (EM TIC-3X), and then observed by the scanning electron microscope (Zeiss Supra 35).
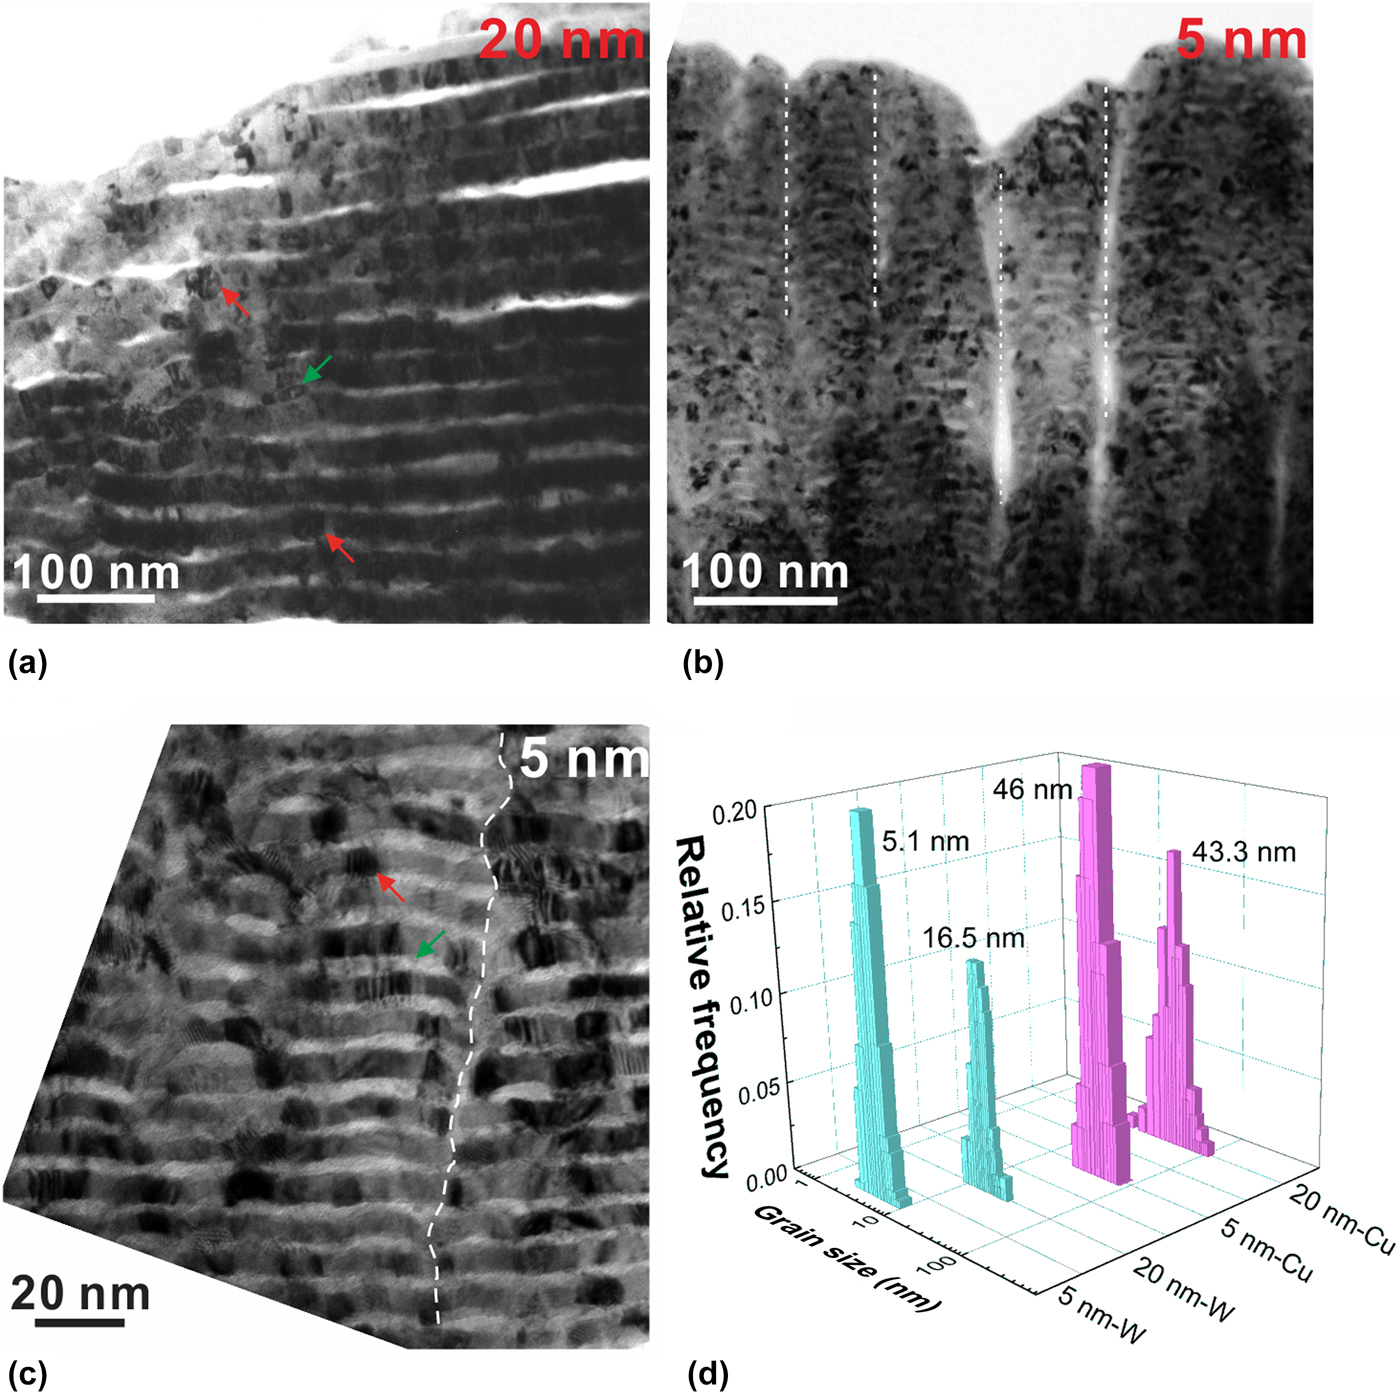
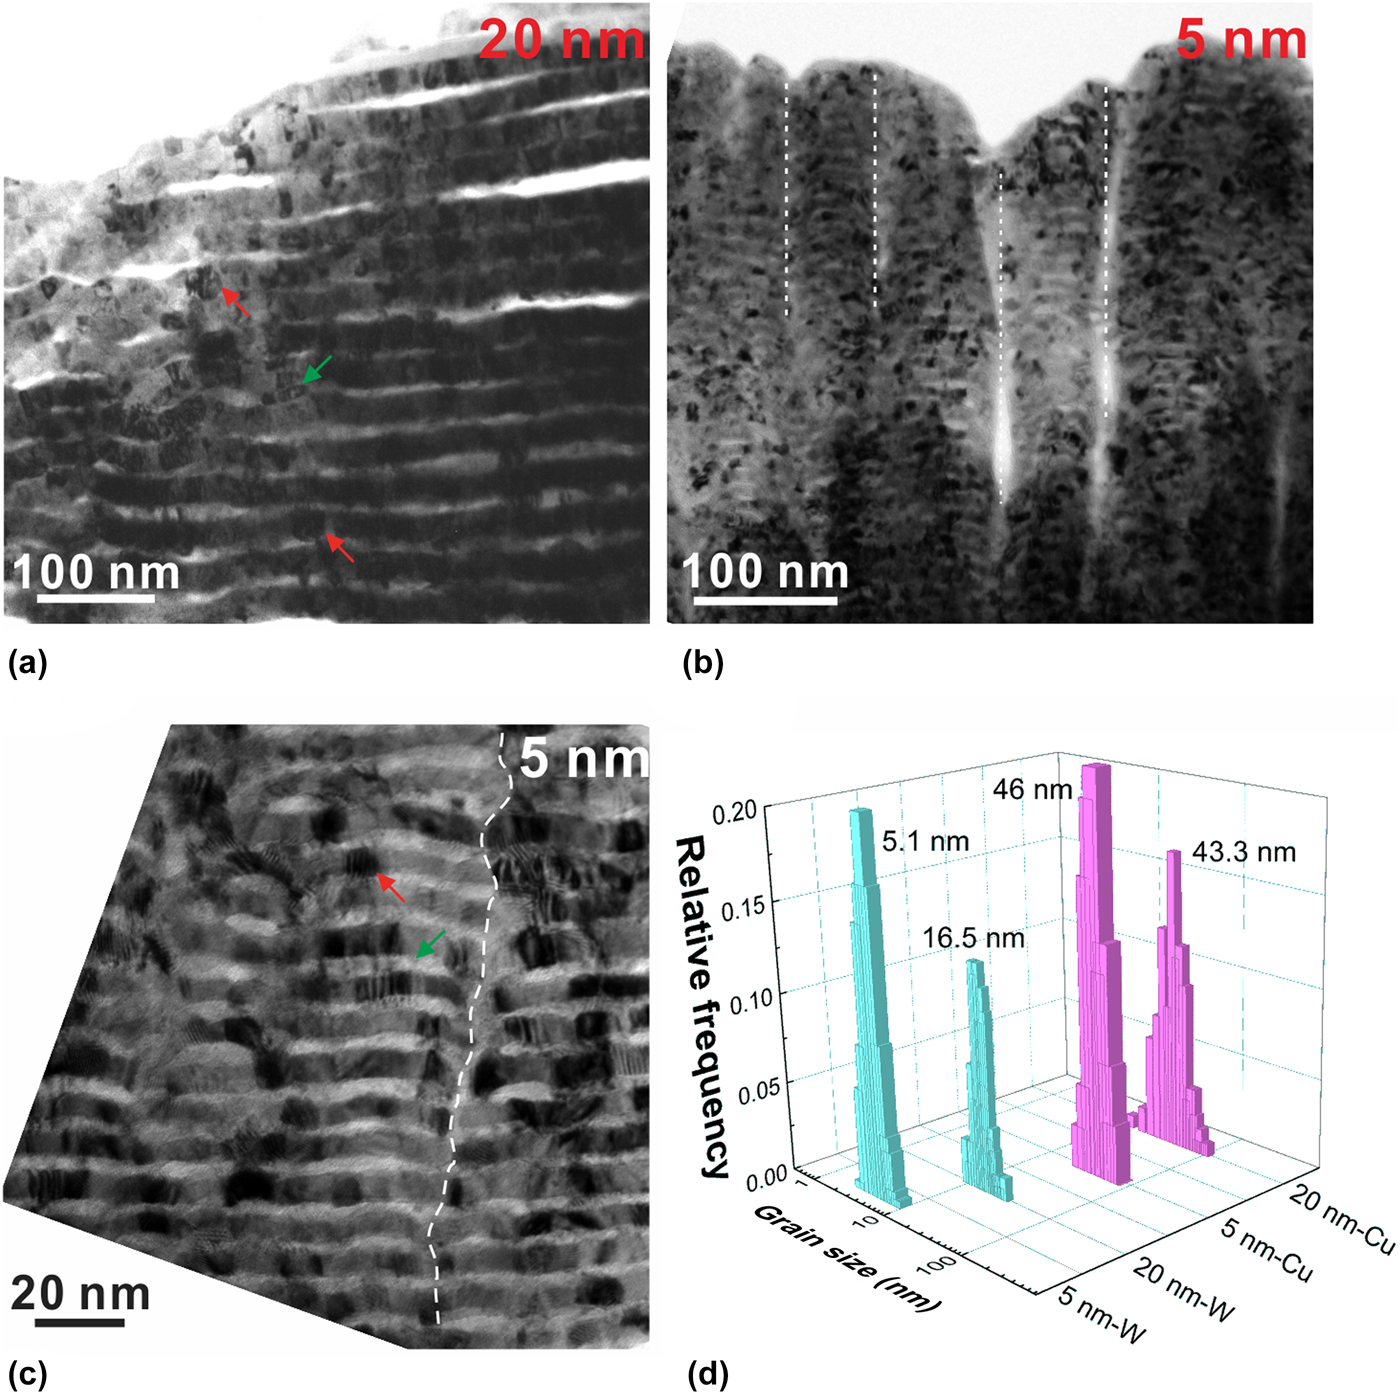
Cross-sectional TEM images of the h = 20 nm and 5 nm samples indicate that cross-sectional grain morphologies of the Cu and the W layers were pancake (green arrows) and equiaxed shape (red arrows) respectively, as shown in Figs. 2(a)–2(c). Statistical analysis in Fig. 2(d) shows that the average grain size (d) of the W layers decreases from ~17 to ~5 nm with decreasing h from 20 to 5 nm, while that of the Cu layers is almost the same as about 45 nm. It is also worth mentioning that the constituent layers appear to be bent and have a periodically wavy structure with an average period width of 46.7 nm formed in the h = 5 nm samples (several layer interfaces adjacent to PI are flat). The columnar boundaries of the wavy structure (dash lines) located in the “valley” consist of GBs of the Cu and the W layers, as shown in Fig. 2(c). Obviously, the local microstructure, especially for the GB arrangement, varied in the samples with different h.
Cross-sectional TEM observation of the Cu/W multilayers with (a) h = 20 nm and (b) h = 5 nm. (c) Local magnified image of columnar boundaries of periodically wavy structure for h = 5 nm samples. (d) Grain size distribution of constituent layers with h = 20 and 5 nm.
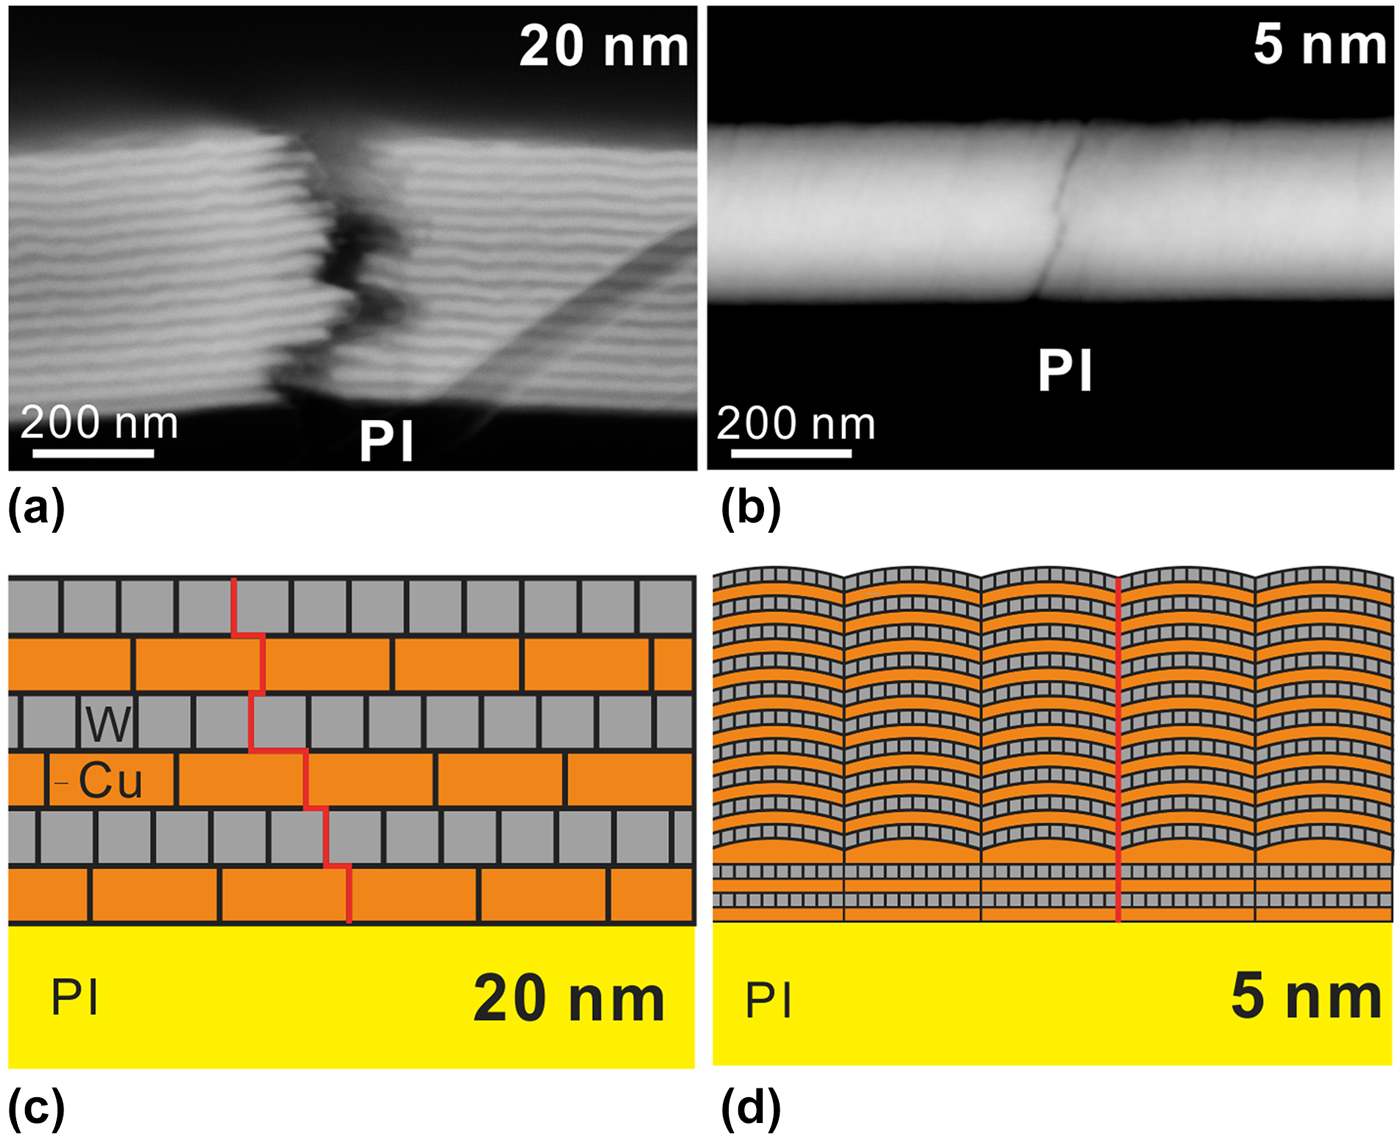
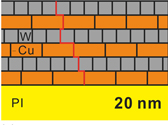
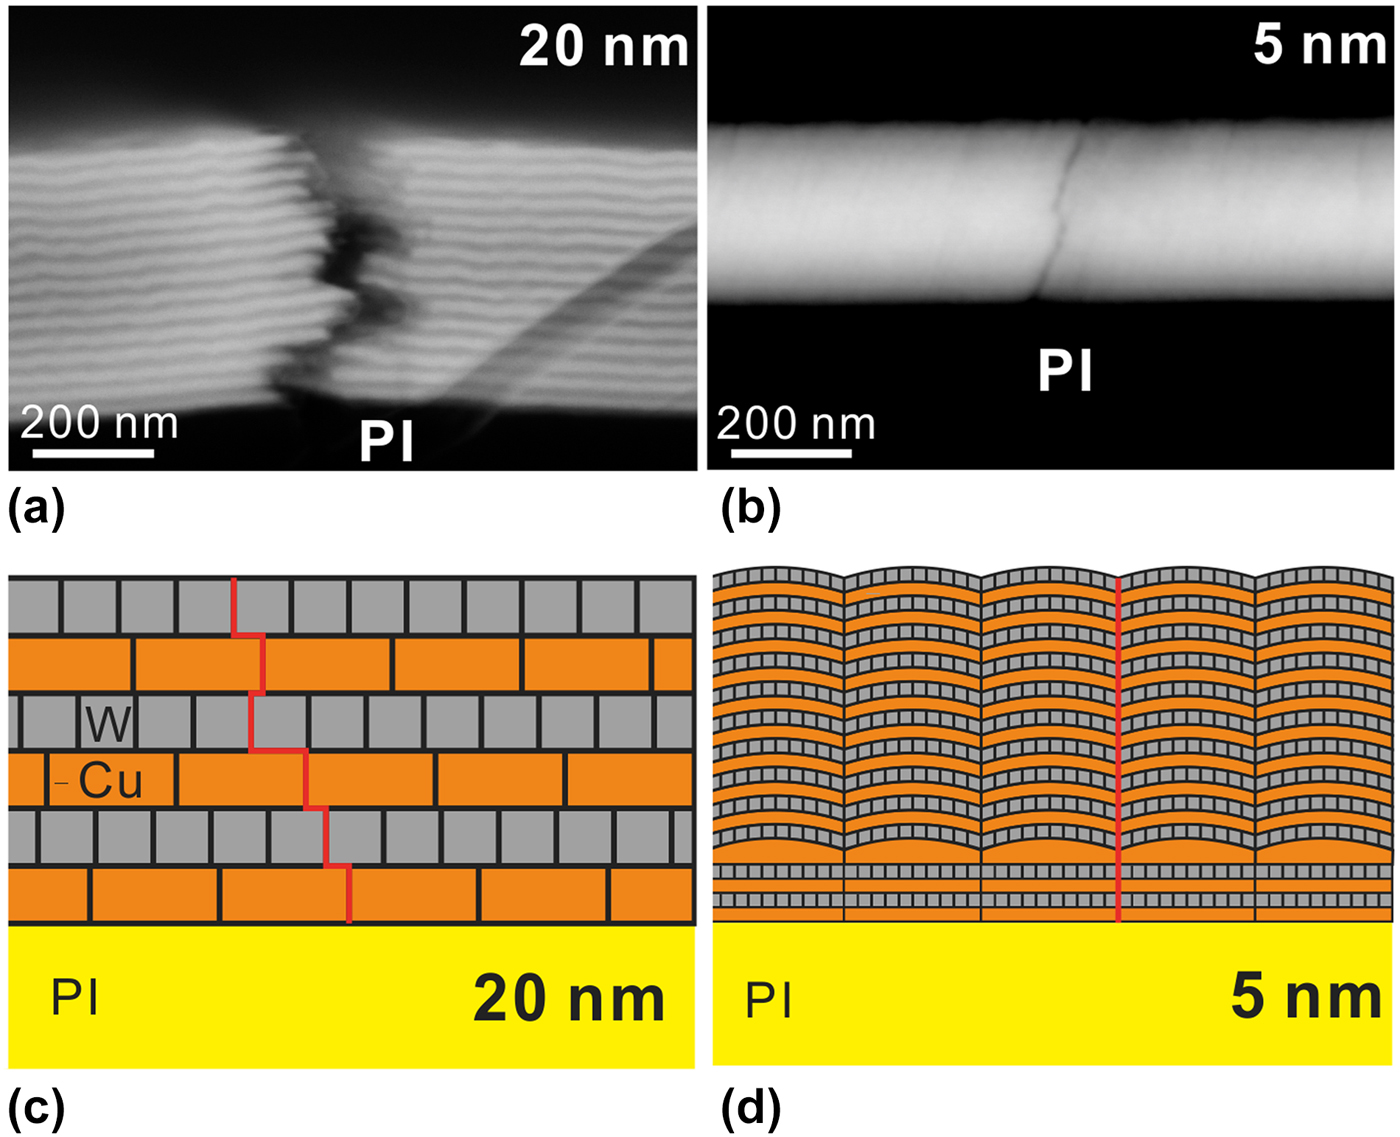
Figures 3(a) and 3(b) show the cross-sectional morphologies and corresponding cracking behavior along TD. For the h = 20 nm samples, the multiple steps near the fracture indicate that the fatigue crack tends to propagate both along TD and the direction parallel to the layer interface. For the h = 5 nm samples, the crack tends to propagate straightly through TD without evident crack deflection and local delamination. Regarding the fact that the dislocation activity is strongly suppressed at such nanoscale and the Cu/W interfaces and GBs of constituent layers are both prone to cracking, the transition of the fatigue cracking behavior could be attributed to the variation of the cross-sectional GB arrangement. For the h = 20 nm samples, cracks approaching the Cu/W interface have to advance along the interface for a relatively long distance and then further propagate along the GBs of adjacent layers due to interlacing GBs, as shown in Fig 3(c). While for the h = 5 nm samples, the stronger growth tendency of integral columnar grains greatly enhances the degree of Cu GBs alignment in adjacent Cu layers along TD. Thus, fatigue cracks could propagate through the columnar GBs in constituent layers, as depicted in Fig. 3(d).
Cross-sectional observation of crack propagation behavior for (a) h = 250 nm and (b) h = 5 nm samples. Schematic illustration of the fatigue cracking process of (c) h = 20 nm and (d) h = 5 nm Cu/W multilayers.
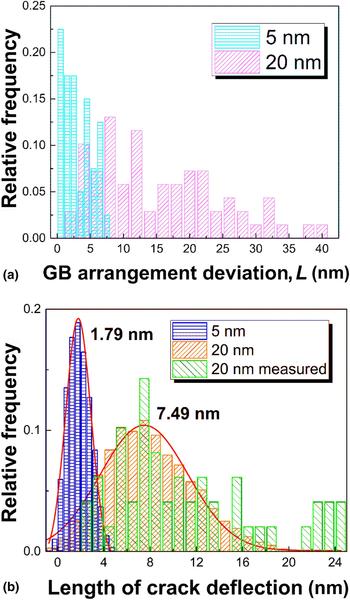
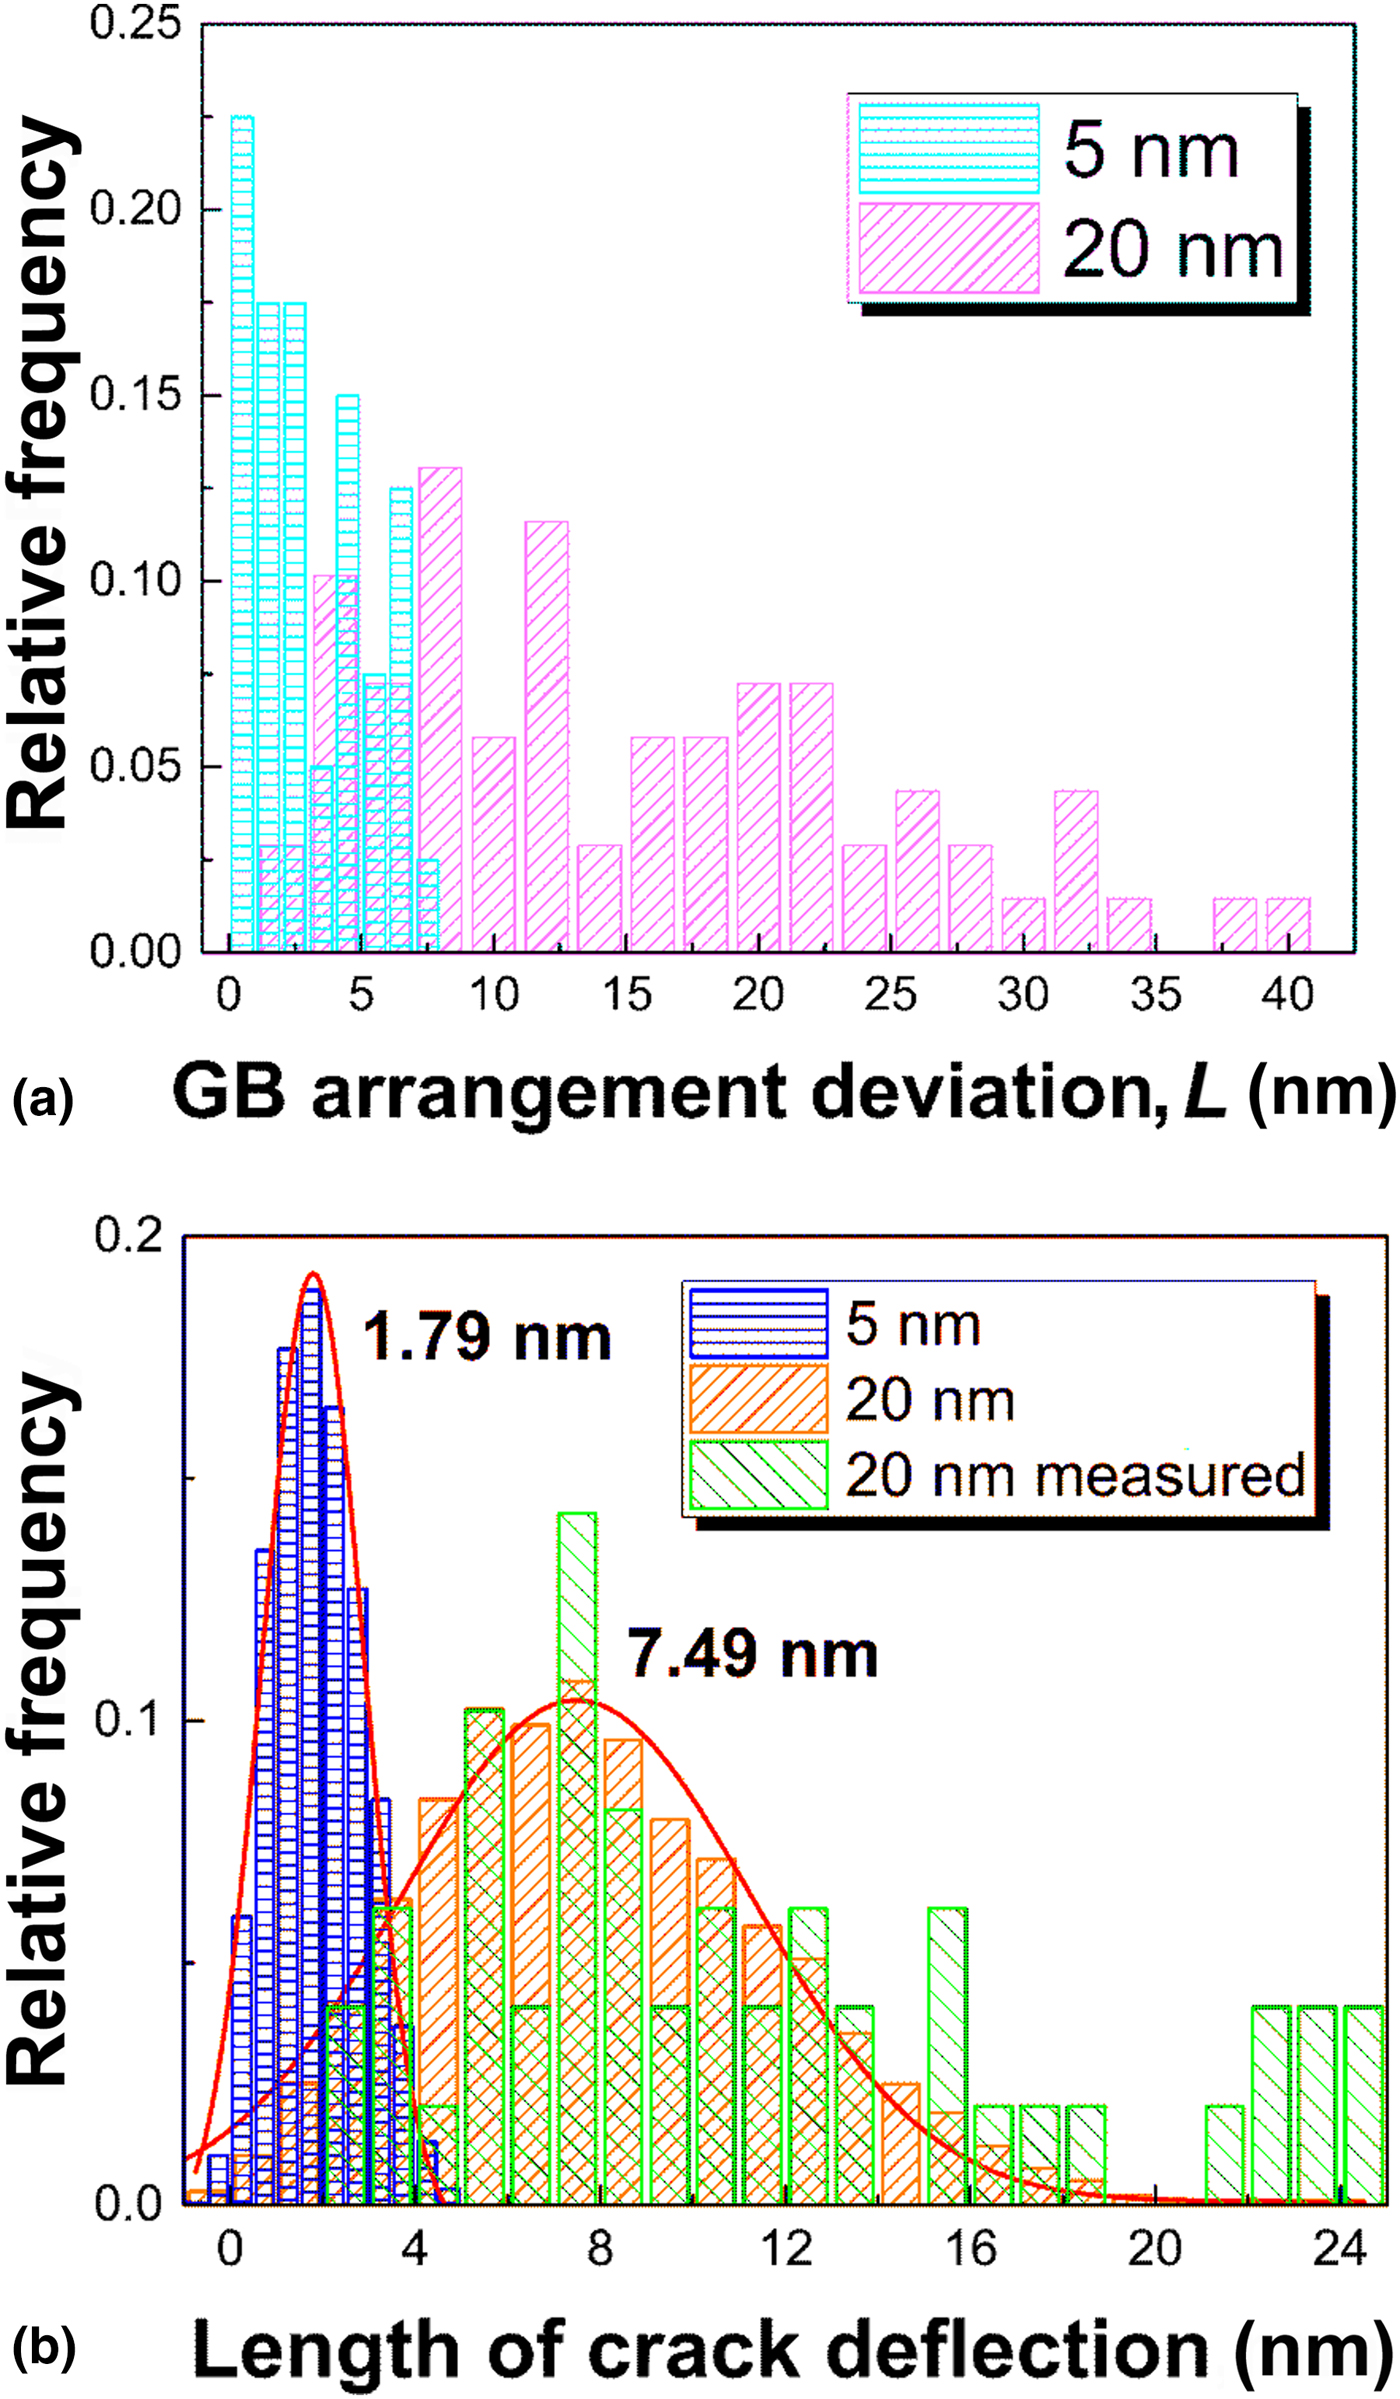
Here, we define GB arrangement deviation (L) as an average value of the deviated length between the GBs of adjacent Cu layers along TD, which was measured according to the TEM cross-sectional images. From the statistic distribution of the L values shown in Fig. 4(a), one can find that L ( $\overline {L_{20}} = 15\,{\rm nm}$) of the h = 20 nm samples is much larger than that (
 $\overline {L_5} = 3\,{\rm nm}$) of the h = 5 nm samples because the periodically-wavy structure in the h = 5 nm samples leads to more regular GB arrangement of the Cu layers [Fig. 1(c)]. The grain sizes and GB arrangement deviation of the h = 5 and 20 nm Cu/W multilayers are put into the program and the values of d W and L are also designed to randomly derive from each set which consists of measured values to reveal the effect of real structure as far as possible. Corresponding results are shown in Fig. 4(b). The deflection length of the h = 5 nm samples is only 1.79 nm which is in good coincidence with the observed straight crack propagation path along the columnar GBs shown in Fig. 3(b). The calculated average deflection length of the h = 20 nm samples is about 7.49 nm and the corresponding data distribution is similar to that of measured values. It seems that the evaluated stochastic model could well reflect the effect of GB arrangement on the fatigue cracking path of the Cu/W multilayers with h of 5 and 20 nm. From the model, it is believed that maximizing the crack resistance of ultrafine scale multilayers could be achieved by eliminating the brittle GBs of constituent layers and increasing the disorder degree of GB alignment as far as possible. Combined with the strongly constrained dislocation activity at the ultrafine scale, the nanoscale multilayers with superior strength and high fatigue cracking resistance could be fabricated and applied as MEMS components[Reference Lopes, Vieira, Borges, Fernandes, Rodrigues, Alves, Barradas, Apreutesei, Steyer, Tavares, Cunha and Vaz29] and protective coatings.[Reference Bull and Jones30]
(a) Statistic distribution of GB arrangement deviation L for h = 20 nm and 5 nm samples and (b) the calculated length of crack deflections for h = 20 nm and 5 nm samples.
Conclusion
A stochastic model was established to reveal that the fatigue crack deflection length decreases gradually with decreasing GB arrangement deviation and grain size of constituent layers, which could be instructive for design and fabrication of ultrafine-scale multilayers with superior strength and high fatigue cracking resistance. The observation and quantitative analysis of fatigue cracking behavior of the h = 5 nm and 20 nm Cu/W multilayers could verify the model. The evident transition of the cracking mode from crack deflection along the interface direction to straight penetration along TD is due to the enhanced degree of the cross-sectional GB arrangement as h decreases from 20 to 5 nm.
Acknowledgments
This work was supported by the National Natural Science Foundation of China (NSFC, Grant Nos. 51571199, 51601198, and 51771207).