I. INTRODUCTION
Compared to semiconductor microelectronics, the value added per silicon wafer in crystalline silicon (c-Si) photovoltaics (PV) is comparatively low. Thus, the wafer production still accounts for about 30% of the total costs of a Si solar cell module. 1 At the same time the price of the polysilicon feedstock, which accounts for half of the wafer costs, is expected to stabilize after a long-lasting drop in prices during the last years. Reference Yisng2 Accordingly, the amount of Si used per cell has to be reduced to further diminish wafering costs, which is key for further cost reductions in PV specified by the price learning curve. 1 Besides handling limits, the lowest achievable Si consumption is limited by the kerf loss that standard and advanced wire-saw wafering techniques are inevitably accompanied by Kerfless techniques for the production of silicon wafers aim to overcome this constraint and can thus make a substantial contribution to the PV module price reduction.
During the last decades, several approaches for kerfless wafering have been developed. Many of them are based on the introduction of a weaker release layer into a thick solid wafer that can act as a determined breaking point during the lift-off of an upper layer of high quality crystalline silicon. The release layer can be generated below the surface of a high-quality silicon wafer, for instance by implantation of hydrogen ions in the SmartCut Reference Bruel3 and PolyMax Reference Henley, Kang, Liu, Tian, Wang and Chow4 processes or by electrochemically etching in the macroporous silicon process. Reference Brendel and Ernst5 In other approaches the release layer is produced on top of the silicon substrate, followed by an epitaxially grown high-quality crystalline silicon layer on top, which can be detached afterward. Examples include porous silicon Reference Brendel6 and CaF2 (Ref. Reference Hayes and Clemens7) acting as release layers.
The lift-off of a thin crystalline silicon film without the need of a weakened release layer was firstly described by Tanielian in 1985 Reference Tanielian, Blackstone and Lajos8 and recently revisited. Reference Dross, Robbelein, Vandevelde, van Kerschaver, Gordon, Beaucarne and Poortmans9–Reference Kwon, Yang, Yoon, Um, Lee and Yoo13 Here, an adhesive stressor layer on top of a thicker silicon substrate is used to induce the exfoliation of a thin substrate portion. The cracking path follows a trajectory with minimized shear components, resulting in the lift-off of a layer with constant thickness. The theory behind this effect is described in the work of Hutchinson and Suo. Reference Suo and Hutchinson14
In the “Stress induced Lift-off Method” (SLIM-cut) by Dross et al. Reference Dross, Robbelein, Vandevelde, van Kerschaver, Gordon, Beaucarne and Poortmans9 this layer is made of screen-printed metal paste. Stress is induced owing to a mismatch of the coefficients of thermal expansion (CTE) during firing. During the “Controlled Spalling Technology” process by Bedell et al. a stressor layer that is sputter-deposited and exhibits a certain amount of tensile stress is combined with an external force applied to an additional handling layer to induce exfoliation. Reference Bedell, Shahrjerdi, Hekmatshoar, Fogel, Lauro, Ott, Sosa Cortes and Sadana10,Reference Bedell, Fogel, Lauro, Shahrjerdi, Ott and Sadana11 The “Semiconductor On Metal” (SOM) process by Rao et al. makes use of an electrochemically deposited metal layer and thermally induced stresses. Reference Rao, Mathew, Saha, Smith, Sarkar, Garcia, Stout and Gurmu12 With this process, exfoliated crystalline silicon wafers up to 8 inch in diameter were demonstrated. Reference Rao, Mathew, Sarkar, Smith, Saha, Garcia, Stout, Gurmu and Ainom15
A key requirement for the use of spalled silicon layers for solar cells is the preservation of the high electronic quality of the silicon material. The material must not degrade to an efficiency-limiting level during the lift-off process, where the material is exposed to enormous mechanical forces with stresses up to several hundred MPa. Masolin et al. identified near-surface hole traps in exfoliated silicon layers by measuring deep-level transient spectroscopy and electron-spin resonance. Etching off 4.5 µm of material from the cracked surface side completely removed these defects. Reference Masolin, Simoen, Kepa and Stesmans16 Martini et al. reached minority carrier lifetimes of 461 µs on a 100 µm thick foil of 1 Ω cm n-type material. Reference Martini, Kepa, Debucquoy, Depauw, Gonzalez, Gordon, Stesmans and Poortmans17 Measuring quasi-steady-state photoconductance (QSSPC) Reference Sinton18 on free-standing exfoliated silicon films, Saha et al. found no degradation of the bulk carrier lifetime compared to the parent substrate before lift-off and showed a solar cell produced from a 25 µm thick exfoliated SOM silicon layer with nickel rear contact and an efficiency of 14.9% on a small area. Reference Saha, Hilali, Onyegam, Sarkar, Jawarani, Rao, Mathew, Smith, Xu, Das, Sopori and Banerjee19 These results are encouraging for using spalled layers as solar cell absorber materials.
Different stressor layer materials have been used for the exfoliation of thin foils of crystalline Si so far, including sputtered or electrodeposited Ni Reference Bedell, Shahrjerdi, Hekmatshoar, Fogel, Lauro, Ott, Sosa Cortes and Sadana10–Reference Rao, Mathew, Saha, Smith, Sarkar, Garcia, Stout and Gurmu12 and Ni–Cr, Reference Tanielian, Blackstone and Lajos8 screen-printed metal paste, Reference Dross, Robbelein, Vandevelde, van Kerschaver, Gordon, Beaucarne and Poortmans9 glued metal stripes, Reference Schönfelder, Breitenstein, Rissland, de Donno, Bagdahn, Sopori and Sinton20 and polymers. Reference Martini, Kepa, Debucquoy, Depauw, Gonzalez, Gordon, Stesmans and Poortmans17,Reference Bellanger, Brito, Pera, Costa, Gaspar, Martini, Debucquoy and Serra21 Within this paper, we present exfoliated silicon foils that were produced using an evaporated Al film as stressor layer. The use of a metal shows a distinct advantage for photovoltaic applications: To reduce the wafering costs it is preferable not to remove the stressor layer after lift-off but to use it as a functional layer. A metallic layer can act as a rear contact electrode in the solar cell. Therefore the rear side of the solar cell is processed before applying the stressor and rear contact layer. After lift-off, the solar cell front-side can be processed. As an additional benefit, the metal layer can act as a mechanical support for the brittle Si layer during processing. We dub our bilayers MEMO-foils, where MEMO stands for MEtal supported MOnocrystalline silicon. We use Al from a physical vapor deposition as a stressor and supporting layer. Al is inexpensive, lightweight, and already well-established as a solar cell material. Stress in the layer is generated during thermal cycling owing to different CTEs in the wafer and the metal. The difference of one order of magnitude in CTE between the two materials (Al: 23.1 × 10⁻⁶ K−1 vs. Si: 2.6 × 10⁻⁶ K−1 at room temperature) Reference Hatch22,Reference Masolin, Bouchard, Martini and Bernacki23 allows for significant thermal stresses and therefore exfoliation at moderate temperatures below 200 °C. Reference Hensen, Niepelt, Kajari-Schroder and Brendel24 This is desired, as the number of defects in the spalled silicon layer is expected to rapidly increase if the brittle–ductile transition temperature of silicon at 729 °C is exceeded during exfoliation. Reference Bedell, Shahrjerdi, Hekmatshoar, Fogel, Lauro, Ott, Sosa Cortes and Sadana10,Reference Masolin, Bouchard, Martini and Bernacki23
This paper discusses the conceptual advantages of this material system for kerfless wafering of solar cells. We give an overview of the foil properties and the potential for solar cells. We investigate the stressor layer properties and discuss the conditions that lead to successful exfoliation of suitable foils. We describe a module concept to integrate the thin MEMO bilayers into solar modules. Finally we discuss the conditions for successful integration of the layers, namely the mechanical stability of the bilayers under elevated temperatures, which defines the applicable processing conditions, and the estimated achievable price advantages over conventional c-Si module concepts by conducting a detailed cost estimation.
II. SAMPLE PREPARATION, EXFOLIATION, AND ELECTRONIC PROPERTIES OF MEMO-LAYERS
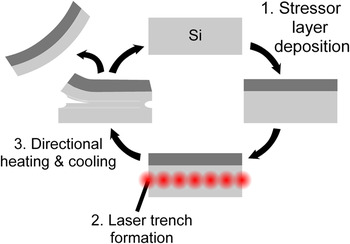
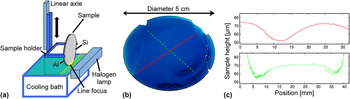
To obtain a smooth and homogeneous exfoliated Si surface we use directed cooling for the lift-off. The process flow is schematically shown in Fig. 1. We use an ATON 600 in-line evaporation system from Applied Materials (Alzenau, Germany) Reference Heinemeyer, Mader, Münster, Dullweber, Harder, Brendel, Hoornsta, Schubert and Beaucarne25 to deposit the 40–120 µm thick Al stressor layers on a 700 µm thick Si substrate that was passivated with an Al2O3–SiN x -stack. Subsequently we create a laser notch at the side of the substrate that acts as the crack initiating site and helps to guide the exfoliation process. The setup for the exfoliation process is sketched in Fig. 2(a). We mount the sample above cooling bath and heat it up by a halogen lamp, which leads to compressive stress in the metal layer. Afterward we cool the sample by immersing it into the bath to induce tensile stress and therefore enable spalling: the tensile stress inside the metal layer leads to tensile stress along the Si edge and a high stress intensity at the tip of the laser notch. At a certain stress level, the fracture toughness of the Si is overcome and a crack starts to grow from the notch across the sample. To obtain a smooth cracked surface we have to avoid the development of multiple crack fronts. Reference Bedell, Shahrjerdi, Hekmatshoar, Fogel, Lauro, Ott, Sosa Cortes and Sadana10 We secure this by the geometry of the exfoliation setup: the vertically immersed sample is directionally cooled down from one side to the other. In that way the requirements for spontaneous spalling are always only fulfilled within a confined area of the sample and the expansion of the crack front can be controlled. Reference Kajari-Schröder, Hensen, Niepelt and Brendel27 Additionally, the geometry of the setup results in the creation of a region of locally enhanced cooling and strain rates that lead to locally enhanced stresses in the Al layer, adding another level of control. More details on the exfoliation process and the temperature dynamics therein are given in the reference by Hensen et al. Reference Hensen, Niepelt, Kajari-Schroder and Brendel24
Metal-supported direct exfoliation process: A metal stressor layer is deposited on the starting wafer. Then, a laser notch is created at the wafer side. Finally, thermal treatment is used to induce mismatch stress in the metal-Si bilayer that leads to exfoliation of a thin Si film.

(a) Setup for directional heating and cooling. Reference Hensen, Niepelt, Kajari-Schroder and Brendel24 (b) Exfoliated Si foil after Al removal. (c) Profilometer scans across the sample measured along the lines indicated in (b). Pictures (c) and (b) are reprinted from Ref. Reference Niepelt, Hensen, Knorr, Steckenreiter, Kajari-Schröder and Brendel26.

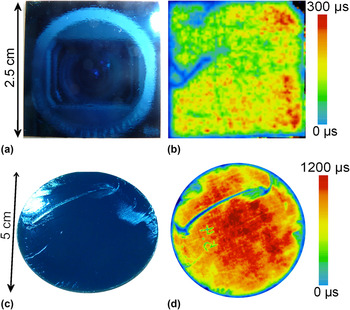
We use two different Al sources for the stressor layers: high-purity (99.98%) Al 99.98 and lower purity Al 99.7. The choice of Al has an influence of the applicable stressor layer thicknesses. With Al 99.98 we need at least 80 µm thick stressor layers for exfoliation. For Al 99.7, also thinner stressor layers down to 40 µm thickness can be used, although there is still room for optimization in terms of process stability. We get the best control over the process with 120 µm thick Al 99.98 layers. In this case we obtain 50–80 µm thick silicon foils by stress induced lift-off from the 700 µm thick parent wafer (FZ, 0.5 Ω cm p-type). Reference Niepelt, Hensen, Knorr, Steckenreiter, Kajari-Schröder and Brendel26 Figures 2(b) and 2(c) show an exfoliated sample after Al removal and the respective Profilometer scans of the surface. Reference Niepelt, Hensen, Knorr, Steckenreiter, Kajari-Schröder and Brendel26 The sample appears very smooth over almost the entire cracked silicon surface with some rougher areas at the outer regions. Lifetime measurements at Al2O3-passivated layers via spatially resolved infrared lifetime mapping (ILM) Reference Ramspeck, Bothe, Schmidt and Brendel28 [Fig. 3(b)] reveal an effective minority carrier lifetime up to 182 µs average at an estimated carrier concentration of Δn = 1.1 × 1015 cm−3 and minority carrier diffusion lengths in the spalled layers of 10 times the layer thickness. Reference Niepelt, Hensen, Knorr, Steckenreiter, Kajari-Schröder and Brendel26 We use QSSPC to estimate the bulk lifetime in the spalled layer at room temperature and obtain a value of 380 µs, which is 2.5 times lower than the theoretically estimated value of 967 µs. Reference Schlangenotto, Maeder and Gerlach29,Reference Richter, Glunz, Werner, Schmidt and Cuevas30 Thus, we see some significant degradation of the material in the thin wafer, despite the still excellent effective lifetimes that facilitate the use of the wafer for high-efficiency solar cells. The measurements on the substrate after the lift-off [Fig. 3(d)] reveal little to no degradation of the carrier lifetime due to the exfoliation process. Reference Niepelt, Hensen, Knorr, Steckenreiter, Kajari-Schröder and Brendel26 The line spot with lower lifetimes in Fig. 3(d) is caused by the collision of two crack fronts and can be avoided by using appropriate exfoliation parameters. The results demonstrate that the spalling process with Al stressor layers is capable of producing thin wafers for highly efficient solar cells without degrading the substrate's electronic quality.
Lifetime measurements on exfoliation samples. (a) Photograph of the cleaved side of a 6.25 cm² exfoliated Si layer; (b) DynILM lifetime mapping of the layer in (a) after lift-off, KOH etching, and passivation with Al2O3. The effective lifetime averaged over the whole sample is 159 µs at an estimated carrier concentration of Δn = 1.1 × 1015 cm−3 and 182 µs at an estimated carrier concentration of Δn = 1.5 × 1015 cm−3 if the upper left quarter of the sample is excluded from averaging. (c) Photograph of the cleaved side of a 2″-diameter Si wafer substrate after layer exfoliation; (d) ILM lifetime mapping after lift-off, KOH etching, and passivation. The effective lifetime averaged over the central 2 × 2 cm² area is 1105 µs at an estimated carrier concentration Δn = 1.1 × 1015 cm−3. Pictures are reprinted from Ref. Reference Niepelt, Hensen, Knorr, Steckenreiter, Kajari-Schröder and Brendel26.

III. THE AL STRESSOR LAYER
A. Al yield strength
Compared to most other metals, pure Al exhibits low stiffness and yield stress. However, the mechanical properties of Al films are strongly affected by crystal grain size and additives. We investigate the mechanical properties of the evaporated Al stressor layers by x-ray diffraction (XRD) stress measurements to determine the applicability of these layers for direct exfoliation.
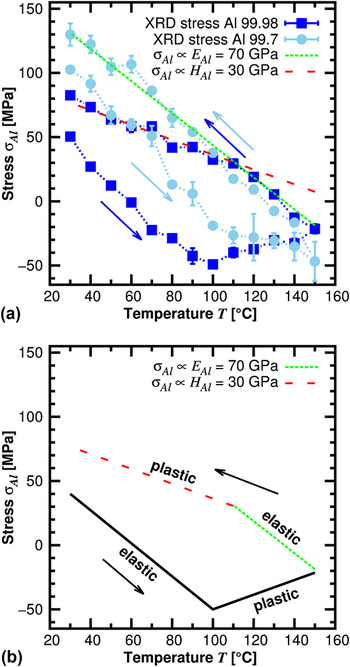
The maximum thermal stress that occurs inside a bilayer of a brittle and a ductile material is governed by the yield strength σy of the ductile material. If the stress level inside the ductile layer reaches σy the material starts to flow and deforms plastically. Thus, the Al yield strength σy,Al, is the most important measure for the applicability of an evaporated Al layer as stressor layer. The exact value of σy,Al, is strongly Al-purity-level-dependent, and thus in our evaporated layers not only coupled to the purity of the Al source, but also the actual vacuum level of our ATON 600 evaporation tool during layer deposition. To measure values of σy,Al of the evaporated Al layers we conduct XRD stress measurements. Reference Macherauch and Müller31 Figure 4(a) shows the stress we measure at the Al surface of Al–Si bilayers during thermal cycling between room temperature and 150 °C. The dark blue squares belong to a bilayer test sample consisting of 10 µm high-purity Al 99.98 and 150 µm Si. The light blue points are obtained from a 40 µm thick Al 99.7 layer on top of a 700 µm thick Si sample, which is the thinnest Al type and layer thickness combination we could use for exfoliation so far. The penetration depth of the x-rays varies from 6 to 31 µm during the measurements. We can assume the measured values as average residual stress values inside the Al layers.
(a) XRD stress measurements of a high-purity Al layer and an Al 99.7 layer on thick Si substrates during thermal cycling. Lines show linear fits to the elastic (green) and plastic (red) deformation regime of the high-purity layer during cooling. (b) Visualization of the elastic and plastic deformation regimes of the high-purity Al layer during thermal cycling.

The stress–strain-relation of the high-purity Al 99.98 shows a hysteresis behavior which is caused by plastic deformation. The hysteresis is highlighted in Fig. 4(b). It can be described by a bilinear stress model Reference Gere32 with a negative strain hardening coefficient during heating and a positive coefficient during cooling. The interesting half of the cycle for the exfoliation process is the cooling half cycle, where tensile stress is built up in the Al layer. This also leads to tensile stress at the Si edge of the sample, fostering crack initiation if high enough. We conduct linear fits on the elastic and plastic region of the cooling half-cycle and obtain the Young's modulus E Al = 70 GPa in the elastic regime. The yield strength σy,Al can be determined from the graph as the stress value where the layer leaves the elastic regime. Because of the temperature dependency of σy,Al, different values have to be considered for the heating and the cooling half-cycle, namely σy,Al,heating = −50 ± 5 MPa and σy,Al,cooling = 30 ± 5 MPa. The values cannot be used as general values for Al layers as they indeed depend on the level of absolute temperature during the thermal cycling. After leaving the elastic regime during cooling, the stress in the layer is further increased by plastic hardening with the hardening coefficient H Al = 30 GPa. The maximum stress value in our measurement is reached at room temperature, where σmax,99.98 ≈ 80 MPa.
For the Al 99.7 layer, which is expected to exhibit a higher yield strength, σy,Al,heating proves to be comparable to the high-purity layer. During cooling however, the lower purity Al shows a nearly linear stress–temperature relation over the whole investigated cooling range from 150 to 30 °C and thus no plastic flow, pointing to a σy,Al,cooling value that must be much higher than for the high-purity Al. The maximum stress value at room temperature is σmax,99.7 ≈ 130 MPa.
B. Minimum Al layer thickness for exfoliation
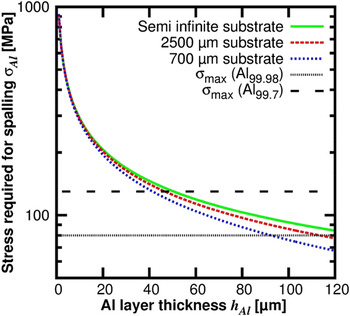
From the maximum stress level it is possible to derive a lower limit for the thickness of the stressor layer for a successful lift-off. Figure 5 displays the minimum stress inside the Al that is needed to induce crack propagation for exfoliation, calculated using the steady state cracking model of Hutchinson and Suo Reference Suo and Hutchinson14 : in order for a crack to propagate parallel to the surface and thus successfully exfoliate a Si layer, the opening mode stress intensity factor K I at the crack initiating site has to exceed the Si fracture toughness K IC. As Si is strongly anisotropic, values for K IC depend on the crack orientation inside the crystal. Literature values are widely spread. In a recent publication, Masolin et al. analyzed the values reported for the low-index breaking planes in more detail and suggested a value of 0.75 MPa m1/2 for a crack along a {100}-plane, Reference Masolin, Bouchard, Martini and Bernacki23 which is the cleavage plane in our directed cooling process. We calculate the stress value in the Al layer for which K I = K IC = 0.75 MPa m1/2. This value corresponds to the minimum actual stress in the Al layer that is needed to let the crack propagate and is displayed in Fig. 5 as a function of Al stressor layer and Si substrate thickness. Please note that the model in Ref. Reference Suo and Hutchinson14 uses the so called equivalent edge load or thermal misfit stress that has to be converted to the actual biaxial stress in the bilayer to compare the model to experimental stress data. Reference Evans and Hutchinson33 These corrections are already applied to the data in Fig. 5.
Minimum stress in the Al layer that is required for successful bilayer exfoliation on Si substrates of different thicknesses in the steady-state-cracking model. The Si fracture toughness is assumed as 0.75 MPa m1/2.

We learn from Fig. 5 that the stress needed for crack propagation grows with increasing substrate thickness and decreasing Al layer thickness. The gray and black dashed lines in Fig. 5 mark the maximum stress values of 80 and 130 MPa that were obtained from the XRD measurement of the high-purity and low-purity Al layers, respectively. The maximum applicable stress values define a minimum stressor layer thickness that we have to ensure for a successful exfoliation process. As the flow stress strongly depends on temperature and strain rate Reference Shi, McLaren, Sellars, Shahani and Bolingbroke34,Reference Bauser, Sauer and Siegert35 the values from the XRD measurement might not be the correct absolute stress values to define a hard limit. However, the thinnest high-purity Al layer that we could use for a successful exfoliation process had a thickness of 100 µm, in accordance with the graph in Fig. 5. With layers from the lower purity Al evaporation source (Al 99.7) we were indeed able to exfoliate Si with thinner Al stressor layers down to 40 µm thickness. Thus, our results are consistent with the theory.
The strength of Al can be adapted to even higher values by selectively adding different alloying components. With the addition of 1% Si or 0.5% Si and 0.5% Cu for example, the flow stress in Al films is enhanced to 211 and 300 MPa, Reference Bader, Kalaugher and Arzt36 respectively. However, when changing to an Al alloy, besides the mechanical properties of the layer also the chemical composition has to be considered to exclude undesired contamination of the solar cell absorber and thus a lowered solar cell performance owing to the choice of the Al stressor layer. Thus, exfoliation with thin Al stressor layers is possible, but a suitable Al alloy has to be selected.
We consider an Al thickness of 40 µm necessary for a working exfoliation process and take this value as a base for the following considerations in this paper. For the exfoliation from a 2500 µm thick substrate with a 40 µm thick Al layer for example, theoretically a stress level of 142 MPa in the Al layer would be sufficient.
C. Al layer thickness and Al/Si thickness ratio
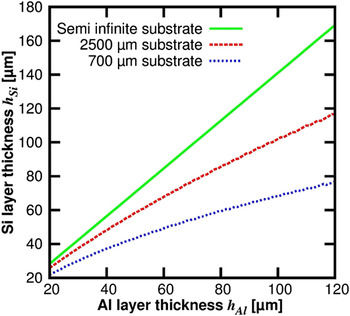
One important aspect for the cost-effectiveness of the MEMO-process and other exfoliation schemes is the material consumption for the stressor and the exfoliated layer. While the stressor layer thickness has a lower limit defined by the strength of the material, the thickness of the exfoliated Si layer also depends on the Al stressor layer thickness as well as the mechanical properties of both materials. The expected thickness ratios can be calculated following the steady-state-cracking theory by Hutchinson and Suo. Reference Suo and Hutchinson14 In Fig. 6 the theoretical exfoliated Si layer thickness h Si is plotted against the Al stressor layer thickness h Al for three different Si substrate thicknesses i.e., 700, 2500 µm and one assumed as semi-infinite. We find that an Al thickness of 40 µm is sufficient to obtain a Si layer thickness of 50 µm, which is convenient for a high-efficiency solar cell from p-type Si, Reference Kerr, Campbell and Cuevas37,Reference Richter, Hermle and Glunz38 if the parent wafer is thick enough. A decreasing substrate thickness lowers the thickness of the spalled layer if the stressor layer is unchanged, accompanied by an increasing dependence on the substrate thickness. With the currently used 700 µm thick parent wafers, the Al/Si-ratio is comparably high. Thus, we propose the use of thicker parent wafers, or alternatively to bond the substrate wafers to a stiff material to make them mechanically thick even when the Si thickness falls below a few hundred micrometers.
Si layer thickness (cracking depth) plotted against Al stressor layer thickness for bilayer exfoliation in the steady state cracking model calculated for three different substrate thicknesses.

An Al thickness of 40 µm and an Al/Si ratio close to one is much more than is usually deemed acceptable in solar cell manufacturing. However, in those cases the metal only fulfills a single function, forming the electrical contact. In the case of exfoliation, the aspired double function of the exfoliation layer must be considered.
IV. INTEGRATION OF MEMO-BILAYERS INTO PHOTOVOLTAIC SYSTEMS
For the integration of MEMO-bilayers into commercial solar cells and modules, several issues have to be addressed. If using the metal layer in its double function, the spalled layers are not compatible with standard cell processes. Instead, the use of an alternative processing route with a suitable cell and module concept is necessary. In addition, the thin silicon layers have to withstand the stresses during further processing without failure, and most importantly, following all considerations a reasonable cost advantage for PV modules from the exfoliation process has to exist to motivate the implementation of a novel wafering technique into the solar module supply chain. In the following we will analyze and discuss each of these points, evaluate the underlying causes of the identified limitations and indicate the steps that are necessary to overcome them.
A. Thin-film/wafer hybrid silicon (HySi) technology by module level processing route
One important aspect of the MEMO concept is the double function of the metal layer that is first used as stressor layer for exfoliation and second as mechanical support and functional layer in the solar cell. While standard solar cell processing cannot be applied to such bilayers, they are compatible with HySi-technology, a concept where the front side of c-Si solar cells is processed after the rear side is processed on wafer level and the wafers are bonded on a large carrier. Reference Brendel, Petermann, Zielke, Schulte-Huxel, Kessler, Gatz, Eidelloth, Bock, Garralaga Rojas, Schmidt and Dullweber39 Due to the simultaneous processing this concept allows the application of cost-effective thin film processes at module level. The approach was developed particularly for the processing of very thin absorbers, as the rigid substrate gives an additional mechanical support during the front side processing. Recently, conversion efficiencies of 20% have been demonstrated with this cell process on wafer-based absorbers. Reference Petermann, Schulte-Huxel, Steckenreiter, Kajari-Schroder and Brendel40 Due to the difference in CTE the spalled MEMO layers tend to be curved. One option is to flatten the bilayer that is pre-stressed after exfoliation under pressure and bond it to a rigid module substrate. After that, a HySi-like processing route can be applied.
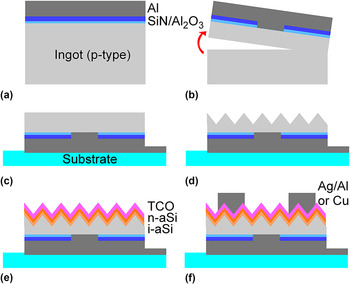
The proposed processing route is schematically depicted in Fig. 7. Prior to the Al stressor layer deposition, the parent wafer surface is (a) passivated with an Al2O3–SiN x -stack that includes local contact openings, forming a passivated emitter and rear cell (PERC) type solar cell rear contact structure directly on the thick substrate. After lift-off (b), the curved bilayers are flattened and (c) permanently bonded to a substrate e.g., glass. Now the Al stressor layer that was used for exfoliation acts as the rear side contact. On the front side of the exfoliated bilayer we deposit an amorphous Si (a-Si:H) layer to form a Si heterojunction (SHJ) cell structure using a plasma enhanced chemical vapor deposition (PECVD) at moderate temperatures, thus compatible with the bonding material at the rear side of the absorber. All processing steps including (d) texturing, (e) forming the a-Si:H-c-SHJ and transparent conductive oxide (TCO) coating, and (f) forming the front contacts are carried out by temperatures below 250 °C.
Solar cell concept for MEMO bilayers. (a) The rear side of the solar cell is defined on the ingot and then exfoliated (b). (c) The bilayer is bonded to a rigid substrate and subsequently textured (d). (e) A PECVD heterojunction and a sputtered TCO coating complete the sunny side of the cell. (f) Finally, front-side metallization is applied.

B. Mechanical stability of MEMO bilayers
Most solar cell processes are carried out at elevated temperatures. While the temperature range in the above described process flow is already lower than in standard solar cell processes, the MEMO Al–Si bilayer with a 50 µm thick Si absorber layer and a 40 µm thick Al contact layer is still experiencing thermally induced stress during cell processing due to the CTE mismatch between the materials. In the following, we analyze the limits in processing conditions, in particular regarding the processing temperature, resulting from the limits in mechanical stability of the bilayer.
Directly after spalling, the Al–Si bilayer is curved. The curvature results from residual stresses inside the bilayer. When the Al layer is removed by wet-chemical etching, the exfoliated Si foil is completely flat [Fig. 2(b)], indicating that the silicon layer itself is globally stress-free. We observe that the Si layer is crack-free to the eye after the lift-off process and the aluminum removal. For the HySi process, the Al remains on the silicon absorber. The mechanically relatively flexible Al–Si bilayer is flattened and then encapsulated for further processing.
The encapsulated bilayer is primarily experiencing stress during processing that is induced by the CTE mismatch between the Si and the Al layer. Module-substrate-induced thermal misfit stresses can also occur, but usually show a lower impact on the strain in the cells than in the encapsulating material. Reference Govaerts, Robbelein, Gonzalez, Gordon, Baert, de Wolf, Bossuyt, van Put and Vanfleteren41,Reference Kim and Cheong42 The Al–Si mismatch stress however can cause interface debonding or crack propagation through the Si layer, especially when the surface is textured. An upper temperature limit can be derived following a procedure by Xu et al. Reference Xu, Ho, Rao, Mathew, Smith, Saha, Sarkar, Vass and Jawarani43 Here, the bilayer is assumed to be flattened under pressure and bonded to a rigid substrate. Then the stress intensity factor K at the textured surface and the energy release rate G at the Al–Si interface are calculated as a function of processing temperature. These values are compared to the fracture toughness of a textured Si surface and the critical energy release rate G C of the interface for debonding as naturally given limits that must not be exceeded during handling. In the case of a MEMO-foil with 50 µm Si and 40 µm Al, we calculate temperature ranges of 360 K (fracture toughness) and 165 K (interface debonding) above room temperature with this method. Not yet included in this evaluation is the plastic behavior of Al that can lead to a significant underestimation of the interface debonding strength. Reference Tvergaard and Hutchinson44 Thus, we extend the model by considering the plastic regime in this paper to derive the processing temperature limits with respect to the two failure modes.
The cracking failure mode, which is crack propagation from the Si surface into the bulk, will only occur if the textured Si surface is exposed to tensile stress. For the bilayer that is flatly bonded to a rigid substrate, this happens during heating, when the Al is faster expanding than the Si due to its larger CTE. From Fig. 4 we can see that the maximum tensile stress in the Si layer and thus at the textured surface does not depend on the maximum processing temperature but on the yield strength of the Al layer during heating, σy,Al,heating, which is of comparable size for both investigated Al purities. In the case of a MEMO-foil with 50 µm Si and 40 µm Al, this Al yield strength would lead to a tensile stress in the Si layer of σSi,max = 40 ± 6 MPa and a maximum stress intensity factor at the textured surface of K I,tex = 125 KPa m1/2. In Fig. 8, K I,tex (solid blue line) is plotted against the applied temperature difference ΔT together with the Si fracture toughness K IC ≈ 750 KPa m1/2. Reference Masolin, Bouchard, Martini and Bernacki23 We find that over the whole displayed temperature range K I,tex < K IC and thus the cracking failure mode is not critical for a MEMO-layer with Al 99.98 bonded to a rigid substrate. It can become critical, however, for other Al alloys. The increasing dotted blue line in Fig. 8 displays the elastic case. If the Al layer stays in the elastic regime up to processing temperatures of more than 360 K above room temperature, the limit from the elastic case calculation defines the maximum applicable process temperature. This case applies for Al alloys with a yield strength above σy,Al ≥ 300 MPa at elevated temperatures.
Stress intensity factor K I (blue solid line) at the Si surface and energy release Rate G (red solid line) of a MEMO bilayer for temperature difference ΔT applied during thermal cycling obtained from elastoplastic analysis. Intermittently dotted lines: G and K I obtained from a fully elastic analysis. Regular dotted lines: Critical Si fracture toughness K IC and interface toughness G C.

The critical value for the delamination failure mode is the maximum amplitude of the thermally induced stresses in the bilayer. The XRD measurement in Fig. 4(a) shows that the maximum amplitude in both investigated layers is reached during cooling. Thus, we have to investigate the stresses induced during cooling to find a temperature limit. From the stresses σAl and σSi in the layers we can then derive the stored potential energy or energy release rate by integrating the strain energy density Reference Gere32
 $$G = {1 \over 2}\left( {\int_0^{{h_{{\rm{Al}}}}} {{{\sigma _{{\rm{Al}}}^2\left( y \right)} \over {{{\overline E }_{{\rm{Al}}}}}}} {\rm{d}}y + \int_{ - {h_{{\rm{Si}}}}}^0 {{{\sigma _{{\rm{Si}}}^2\left( y \right)} \over {{{\overline E }_{{\rm{Si}}}}}}} {\rm{d}}y} \right)\quad ,$$
here,
 ${\bar E_i}$
is the effective Young's modulus, which is defined by the Young's modulus E
i
and Poisson's ratio ν
i
via
 $\bar E_i = {{E_i } \mathord{\left/ {\vphantom {{E_i } {\left( {1 - \nu _i^2 } \right)}}} \right. \kern-\nulldelimiterspace} {\left( {1 - \nu _i^2 } \right)}}$
, of the respective layer with the thickness h
i
, and y is the direction vertical to the surface. To simplify the expression we neglect all curvature-connected terms as the bilayer is flatly bonded and consider only uniaxial stresses.
At the highest temperature point, the Al layer encounters compressive stress at the magnitude of the yield strength of the material at the elevated temperature, which is named σy,Al,cooling in the following, as it denotes the yield strength value that has to be considered during cooling. Cooling down, the Al will contract elastically, first relieving compressive stress and then building up tensile stress. The lower purity Al shows no plastic deformation behavior during cooling in Fig. 4(a). Thus, we can estimate the temperature limit for interface debonding following the procedure in Ref. Reference Xu, Ho, Rao, Mathew, Smith, Saha, Sarkar, Vass and Jawarani43, where the metal stressor layer is considered elastically deforming. The processing limit is derived by comparing the energy release rate in the bilayer to the critical interface release rate of the interface G
C. The debonding limit is set by the temperature T
critical where the energy release rate exceeds the critical energy release rate. Assuming the samples are cooled down to room temperature T
R after processing, this value corresponds to T
critical = T
R
+ ΔT
critical with G(ΔT
critical) = G
C
. The critical rate G
C is defined as the energy per area that is needed to split the interface. While actually being a property of the interface, it is practically appraised as the critical strain energy release rate of the material with the lower crack growth resistance,
Reference Xu, Ho, Rao, Mathew, Smith, Saha, Sarkar, Vass and Jawarani43
which is in this case Si, leading to
 ${G_{\rm{C}}} = {{{K_{{\rm{IC}},{\rm{S}}{{\rm{i}}^2}}}} \mathord{\left/{\vphantom {{{K_{{\rm{IC}},{\rm{S}}{{\rm{i}}^2}}}} {{{\bar E}_{{\rm{Si}}}}}}} \right\kern-\nulldelimiterspace} {{{\bar E}_{{\rm{Si}}}}}} \approx 4\;{{\rm{J}} \mathord{\left{\vphantom {{\rm{J}} {{{\rm{m}}^{\rm{2}}}}}} \right\kern-\nulldelimiterspace} {{{\rm{m}}^{\rm{2}}}}}$
.
However, there are two additional aspects that have to be taken into account here. First, a thin (10–100 nm) dielectric layer is needed between the Al and the Si in HySi technology. The critical strain energy release rate of a SiN x layer on a Si substrate was determined as only 1.5 J/m² and thus we expect such a layer to have a lowering effect on G C. Reference Volinsky, Moody and Gerberich45 Second, the plasticity of the Al leads to a converse effect: work that is needed to plastically deform the Al layer actually raises the value of G C, especially when the Al layer becomes much thicker than the interface itself. Reference Volinsky, Moody and Gerberich45,Reference Wei and Hutchinson46 We conclude from literature that in MEMO-layers the latter effect at least compensates the first one and can thus assume the critical strain energy release rate to be G C ≥ 4 J/m². Using this value we find the processing limit of the elastic case of T critical = 165 K above room temperature for the lower purity Al layer.
The high-purity Al layer only deforms elastically until the yield strength σy,Al,cooling is reached under tensile stress. The temperature difference ΔT y that has been occurred until this point can be obtained from the elastic axial stress expression Reference Xu, Ho, Rao, Mathew, Smith, Saha, Sarkar, Vass and Jawarani43
 $${\sigma _{{\rm{Al}}}} = {{{{\bar E}_{{\rm{Si}}}}{h_{{\rm{Si}}}}} \over {{{\bar E}_{{\rm{Al}}}}{h_{{\rm{Al}}}} + {{\bar E}_{{\rm{Si}}}}{h_{{\rm{Si}}}}}}{\bar E_{{\rm{Al}}}}\left( {\left( {{\alpha _{{\rm{Al}}}} - {\alpha _{{\rm{Si}}}}} \right)\Delta T - {\varepsilon _0}} \right)\quad ,$$
where α
i
is the CTE of the respective material. As the bilayer is assumed to be in the plastic regime before being cooled down, the initial compressive strain ε0 can be written as
 $\varepsilon _0 = {{\sigma _{{\rm{y,Al,cooling}}} } \mathord{\left/ {\vphantom {{\sigma _{{\rm{y,Al,cooling}}} } {\bar E_{{\rm{Al}}} }}} \right. \kern-\nulldelimiterspace} {\bar E_{{\rm{Al}}} }}$
. Then the temperature difference when reaching the yield strain is given as
 $$\Delta {T_{\rm{y}}} = {{{\sigma _{{\rm{y,Al,cooling}}}}} \over {{{\bar E}_{{\rm{Al}}}}\left( {{\alpha _{{\rm{Al}}}} - {\alpha _{{\rm{Si}}}}} \right)}}{{{{\bar E}_{{\rm{Al}}}}{h_{{\rm{Al}}}} + 2{{\bar E}_{{\rm{Si}}}}{h_{{\rm{Si}}}}} \over {{{\bar E}_{{\rm{Si}}}}{h_{{\rm{Si}}}}}}\quad .$$
with σy,Al,cooling = 30 MPa this results in ΔT y = 45 K. This value is in line with the width of the elastic regime during cooling that can be seen in Fig. 4. The energy release rate of the bilayer corresponding to ΔT y is G = 0.27 J/m². Hence, we can also conclude that we do not expect delamination within the elastic regime of the high-purity Al layer.
To calculate the energy release rates for interface debonding during the plastic regime ΔT > ΔT y, we approximate the stress in the layer with the bilinear stress model by
 $${\sigma _{{\rm{Al,plastic}}}} = {\sigma _{\rm{y}}} + {{{{\bar E}_{{\rm{Si}}}}{h_{{\rm{Si}}}}} \over {{{\bar H}_{{\rm{Al}}}}{h_{{\rm{Al}}}} + {{\bar E}_{{\rm{Si}}}}{h_{{\rm{Si}}}}}}{\bar H_{{\rm{Al}}}}\left( {{\alpha _{{\rm{Al}}}} - {\alpha _{{\rm{Si}}}}} \right)\left( {\Delta T - \Delta {T_{\rm{y}}}} \right)\quad ,$$
where the hardening coefficient H Al governs the stress increase in the plastic regime. The stress in the Si-layer in this regime can be described by
 $${\sigma _{{\rm{Si,plastic}}}} = {\sigma _{{\rm{Al,plastic}}}}{{{h_{{\rm{Al}}}}} \over {{h_{{\rm{Si}}}}}}\quad .$$
We can now insert Eqs. (4) and (5) into Eq. (1) and receive the energy release rates. The red lines in Fig. 8 show the calculated values for both the elastic and the elastic–plastic case. In the plastic regime the energy release rate is lowered, resulting in a higher temperature limit compared to the elastic case. From the intersection of G plastic and G C in Fig. 8 we determine the processing range for interface debonding as ΔT critical = 187 K above room temperature. The critical values for both layers do not depend on the initial stress states prior to thermal cycling, as we assume that both samples are first heated up to the plastic regime, where the stress level is governed by the yield strength and not the residual stress, and then cooled down to room temperature.
Please note that our calculations are based on rather conservative assumptions. For the Al 99.7 layer, it was not possible to detect the yield strength during cooling and thus the material was treated as being in the elastic regime, what already results in the lowest possible processing limit. The yield strength of the high-purity layer was obtained by measuring XRD stress cooling down from 150 °C. In reality the material yield strength decreases with increasing temperature. The critical limit then heavily depends on the strain hardening coefficient, which can be assumed as relatively high in this experiment compared to literature. With a hardening coefficient of 15 GPa, as suggested elsewhere, Reference Hu and Huang47 the critical processing temperature range for high-purity Al interface debonding is ΔT critical = 369 K above room temperature. A lower strain hardening coefficient of the Al would thus drastically increase the maximum temperature that can be applied during processing. Besides the material composition, the hardening coefficient H Al also depends on the absolute processing temperature and the cooling rate. Reference Shi, McLaren, Sellars, Shahani and Bolingbroke34 If it is not possible to avoid temperatures during processing that would lead to interface debonding, the introduction of a textured Al–Si interface would be an option to expand the processing limits, as the critical energy release rate for debonding scales with the area of the interface. Hence, our results imply that MEMO-layers are well-suited for low-temperature solar cell processing up to at least 210 °C, depending on the particular properties of the Al layer, and are thus compatible with the proposed module level processing concept. In addition, we carried out some first experiments with dummy material that so far confirmed these findings.
C. Cost estimation
Given the significant deviation of the cell process in Fig. 7 from commercial solar cell concepts, a critical view on the expectable module costs is obligatory. We take the recent publication on sustainable future module costs by Goodrich et al., Reference Goodrich, Hacke, Wang, Sopori, Margolis, James and Woodhouse48 where a standard Si cell and three advanced cell concepts are compared, as a basis for our cost estimation. The model includes detailed price tags for every step in the module supply chain including costs of capital. An additional adjustment function takes into account the different efficiency potentials of the investigated cell technologies and allows for comparison on system level. To compare the MEMO concept within the model we have to make some assumptions and simplifications that are described in the following.
In the model, the required margins for every step in the supply chain are determined using corporate finance instruments. The technology routes have different requirements for manufacturing equipment, staffing and operating supplies, resulting in different required margins for every cell concept. As we do not have comparable corporate finance data for the MEMO concept, we assume the same profit per wafer as required for a wire-sawn wafer as sufficient. For cell and module processing we regard the highest relative margin of the other technologies as necessary for an effective business model. For cell processing, this results in a required margin of 22% as for a SHJ (Heterojunction with intrinsic thin layer/HIT) solar cell process. For module level processing the required margin is 20% as needed for an interdigitated back-contact (IBC) concept. By choosing the costliest option in each step, we minimize the risk of underestimating the required margin of every step in the supply chain for the MEMO concept.
Goodrich includes several variants of wafer thicknesses and Si demands and prices in his model. We calculate with a polysilicon feedstock price of 20 $/kg. Reference Yisng2 We further take into account diamond wire wafering for the non-kerfless cell concepts and assume the Si consumption to be 290 µm/solar cell, including 130 µm kerf loss. This value represents the current technically feasible limit. 1 For the Si thickness of the MEMO-layer we think positive and assume it to be 50 µm. This implies a stable exfoliation process with 40 µm thick Al stressor layers as well as the repeated lift-off from the same thick substrate, which is a challenging task. The first demonstration of multiple spalling from an ingot was published by Bedell on GaAs using a Ni stressor layer. Reference Bedell, Shahrjerdi, Hekmatshoar, Fogel, Lauro, Ott, Sosa Cortes and Sadana10 Results of three exfoliated Si-layers from the same substrate were published by Bellanger using a polymer stressor layer. Reference Bellanger, Brito, Pera, Costa, Gaspar, Martini, Debucquoy and Serra21,Reference Bellanger, Bouchard, Bernacki and Serra49 We further assume for the cost estimation that wire and slurry consumables are not needed for exfoliation and therefore can be omitted. Beyond that we adopt the wafer production costs like utility, building, and maintenance without the consumables from the standard process, as a cost analysis for kerfless wafering by exfoliation at an industrial scale including the laser notch process is not available at present.
The evaporation of 40 µm Al with an in-line evaporator with a throughput of 75 MW/y adds a potentially unattainable cost penalty of 0.06 $/W to the module costs, caused by the comparably high depreciation costs of the evaporation system and a declining uptime of the evaporator at higher evaporation rates. The material costs of the Al wire contribute with around 0.02 $/W to the figure, based on an Al price of 13.65 $/kg, which is a reasonable price for Al high-purity wires. The Al yield rate is quite low, as only a quarter of the evaporated material is deposited on the sample in the end. At 100% yield rate, the costs for the Al material would be less than 0.008 $/W, still based on the assumption that high-purity Al wires are used. For our cost estimation, we evaluate two scenarios: one with the evaporation costs included and one with only the material costs of the Al included to indicate the cost potential of the concept if an alternative metallization route is used. Alternatives to evaporation could base on a metal foil bonded to the substrate or on the evaporation of a thin Al layer and subsequent thickening via spray coating. Another option is the use of a two-material stressor layer of thin Al and a thicker and cheaper spin-on material.
On module level we assume a glass back pane without anti-reflection coating, which lowers the cost of the rear side glass pane by a factor of 1.6 compared to the front glass. Furthermore we use a thin silicone (60 µm) rear encapsulation layer to bond the MEMO cells to the glass. Both components are more robust to the front side processing steps that are carried out after bonding the bilayer to the rear substrate than a plastic backsheet and other encapsulation materials like ethylene-vinyl acetate (EVA). Reference Steckenreiter, Horbelt, Wright, Nese and Brendel50 We estimate the costs of the silicone encapsulant to be 20 $/kg, which results in layer costs per area of 27% compared to an EVA layer. The front side is encapsulated with a single EVA sheet and high-quality glass with anti-reflective coating. The module cost portion of the MEMO process flow is slightly increased compared to standard concepts where a plastic back sheet and complete EVA encapsulation are used.
All other process step costs as well as the efficiency potentials for the cell concepts are adopted from Goodrich et al. We add up the different cost portions to calculate the respective price in $/W. The different cell concepts result in different final module efficiencies. We include the different cell-to-module losses of the concepts that were partly unaccounted for in the original paper in our calculations and the case of a 20% PERC module which we believe is in the line of sight according to Ref. 1. In a last step, we normalize the prices to the standard c-Si module price to access the relative price advantages of the different cell and module concepts.
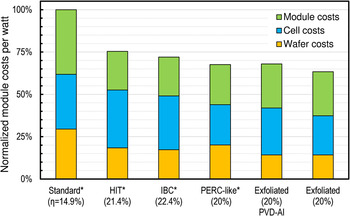
The overall result is shown in Fig. 9: we end up with lower costs on module level compared to all other cell concepts for a MEMO device with 20% estimated module conversion efficiency if we exclude the Al evaporation costs. The expected module costs are 36% lower than the costs of an Al-back-surface-field-module and 11–15% lower than the costs for the advanced cell concepts from Ref. Reference Goodrich, Hacke, Wang, Sopori, Margolis, James and Woodhouse48. Compared to a 20% PERC module, the possible cost advantage drops down to only 3%. With the evaporation costs included, the costs of a MEMO module are still competitive compared to SHJ and IBC cell concepts but not to the 20% PERC module, which exhibits slightly lower costs. An advantage over the 20% PERC module can only be obtained if the Al deposition costs can be brought below 2 ct/Wp. The relatively small price advantage is a sobering result for implementing the process into the industry. The savings only pay off, if the cell process can be kept simple and a repeated lift-off from the same substrate can be applied, as assumed here. But even if those challenges are solved, the cost savings compared to PERC modules, which are already evaluated at industrial scale, could be too low to justify the risk connected to the implementation of a new technology.
Efficiency-adjusted module prices normalized to standard p-type solar cells for exfoliated MEMO/HySi cells and three other advanced cell concepts. The parenthesized values for η refer to estimated module efficiencies. For details on the alternative technology concepts see the reference by Goodrich et al. Reference Goodrich, Hacke, Wang, Sopori, Margolis, James and Woodhouse48

From the diagram it is visible that all possible cost savings are solely caused by the lowered wafer costs due to the reduced Si consumption. Further price reductions in the conventional wafer production would lead to an even smaller cost advantage for the kerfless process. Advancements in the ingot production would be passed-through as in any ingot-based kerfless wafering scenario, however also reducing the MEMO cost advantage. On the other hand, the module and cell cost portions of the MEMO process are not higher than for the other projected future technologies (except for PERC), so that the exfoliation approach will stay at the same level of competitiveness if the assumed efficiencies can be reached.
The choice of an appropriate alternative metal could give an advantage over Al by reducing the minimum thickness of the stressor layer that is needed for lift-off. A candidate is nickel (Ni), which is used by some other groups Reference Bedell, Shahrjerdi, Hekmatshoar, Fogel, Lauro, Ott, Sosa Cortes and Sadana10–Reference Kwon, Yang, Yoon, Um, Lee and Yoo13 for exfoliation. If we conduct the calculations for the layer thickness ratio in Fig. 6 for instance with nickel Ni instead of Al, an 11 µm thick Ni layer would also lead to same Si layer thickness spalled from a 2500 µm thick substrate as a 40 µm thick Al layer. On the other hand, Ni is much more expensive than Al and it is difficult to deposit compact Ni layers thicker than a few micrometers. The material costs of a 11 µm Ni layer would already add 0.01 $/W to the module costs, if only the wholesale price of untreated Ni (∼20 $/kg) is considered. This position will be increased by additional costs for material refining, a proper metallization technique, and material losses during the process. Thus, we do not consider Ni as a convenient stressor layer material for a MEMO-like Si solar cell concept.
Another drawback of the proposed MEMO process could be the additional research and development resources that have to be spent to refine the processing steps and adapt them to the special challenges of the concept like the curved bilayer that has to be flatly encapsulated. From this point of view, one might think of using the exfoliation process only for wafering, removing the stressor layer afterward, and applying a more established cell process like PERC to the exfoliated, thin wafer. This approach actually only pays off if the price for poly-Si is high enough. The Si savings have to compensate for the Al evaporation and an additional wet-etching step for the Al stressor layer removal. In our cost model, this wafering approach yields a financial benefit of 0.01–0.02 $/W given a poly-Si price of 20 $/kg. The benefit shrinks with lower Si prices. For a poly-Si of 16.5 $/kg or less, classical wafering is actually cheaper than the kerfless process if the metal layer is not kept as a functional layer. As the poly-Si price is assumed to level off somewhere between 16 and 20 $/kg for the next years, 1,Reference Yisng2 we rate this approach as not competitive to both the standard process and the MEMO process with a re-integrated functional stressor layer.
Using a polymer layer instead of Al could give an additional cost advantage, if a suitable and cheap polymer can be found. Assuming a polymer thickness of 400 µm, which is a reasonable thickness for the exfoliation of a 50 µm thick Si foil, Reference Masolin51 the polymer price has to be less than 12.50 $/L to offer a price advantage over the proposed Al process. We think that for today this value is hard to underprice for the highly specialized polymers that are commonly applied for the lift-off. Of course, future developments in polymer production might help to pave the way to more economic and competitive stressor layers from non-metallic materials. From today, we think that Al is an excellent choice of material for exfoliation of thin Si wafers and their integration into solar cells. The attractiveness of exfoliation at all, however, is highly dependent on the achievable cost advantage over standard techniques. The ongoing improvements in the efficiency of PERC modules that rely on a comparatively lean and simple cell processing route will hamper the introduction of advanced c-Si solar cell concepts like MEMO, as the expected cost advantages might not be sufficient, at least at the currently assumed poly-Si prices within the next years.
V. SUMMARY
We discussed the production of thin crystalline Si solar cell absorber layers utilizing evaporated Al as stressor layer. The MEMO bilayers show excellent electronical properties. We investigate the mechanical properties of the Al stressor layer and find them applicable to the exfoliation process. A feasible module level processing concept is discussed in the paper. We determine the processing limits for the exfoliated Al–Si-bilayers and find that exfoliation with 40 µm thick Al layers is possible. We show that the layers are compatible with SHJ solar cell processing and withstand the typically applied processing temperatures around 200 °C. We analyze the expected costs of the proposed route and find a potential for cost savings of 3–36% comparing the kerfless exfoliation concept with other projected future cell concepts based on classically produced wafers. We also find that the advantage over high-efficiency PERC cells from standard Si wafers, which represent an already established technological route, might not be enough to justify the introduction of a new cell and module concept, even if cheap and widely available Al is used for the stressor layer.
ACKNOWLEDGMENTS
The authors thank Alwina Knorr, Rene Berger, Daniel Münster, Frank Heinemeyer, and David Sylla for valuable help with the sample preparation and Jan-Hendrik Petermann and Chistopher Kranz for fruitful discussions on cell concepts and the cost model. This work was supported by the Federal Ministry for Environment, Nature Conservation, and Nuclear Safety and the Federal Ministry for Economic Affairs and Energy under the contract FKZ 0325461 (MEMO), and by the state of Lower Saxony.