1 Introduction
As in other varieties of English, Australian English /t/ can be produced as a range of variants (Horvath Reference Horvath1985, Ingram Reference Ingram1989, Haslerud Reference Haslerud1995, Tollfree Reference Tollfree2001, Cox & Palethorpe Reference Cox and Palethorpe2007). The focus here is on the voiceless fricative or ‘fricated’ realisation which occurs in some phonological contexts (Tollfree Reference Tollfree2001: 45). Based on recorded interview data from the state of Victoria, Tollfree (Reference Tollfree2001) observes that Australian English fricated /t/ occurs mainly in intervocalic and prepausal contexts in formal speech for older speakers and those of higher socioeconomic status. The fricated realisation appears to have been unreported for Australian English until Haslerud (Reference Haslerud1995) and Tollfree (Reference Tollfree1996), though Horvath (Reference Horvath1985) does mention plosives with fricated releases. It is presumably this fricated realisation which has inspired the use of an exaggerated /ʃ/ realisation with a written representation of 〈sh〉 or 〈shsh〉, e.g. 〈beyoushiful〉 beautiful, 〈grayshsh〉 great, in the speech of the actors in the Australian television comedy series ‘Kath and Kim’ (http://www.kathandkim.com/grayshsh.htm). These orthographic transcriptions support Tollfree's observations that the fricated form of /t/ occurs word-finally and intervocalically, and suggest further that fricated /t/ is impressionistically similar to /ʃ/, possibly even perceptually confusable with it.
Frication of plosives is common in casual speech and a widely attested phonological process (Jones & Llamas Reference Jones and Llamas2008), and therefore it could have arisen independently in Australian English relatively recently. However, Tollfree (Reference Tollfree1996: 192, 199; Reference Tollfree2001: 50) considers the possibility that Australian English fricated /t/ is a contact feature derived from Irish Gaelic through the Irish English speech of immigrants to Australia in the early 1800s. Irish English is known to have a fricated realisation of /t/ in some contexts (Hickey Reference Hickey1986, Reference Hickey1999; Ó Baoill Reference Ó Baoill, Edmondson, Feagin and Mühlhäusler1990, Reference Ó Baoill1997; Pandeli, Eska, Ball & Rahilly Reference Pandeli, Eska, Ball and Rahilly1997), probably derived from an Irish substrate, though the precise source and mechanism of transfer remains unclear (see Hickey Reference Hickey1984, Reference Hickey1986; Jones & Llamas Reference Jones and Llamas2008). Acoustic analysis of Irish English fricated /t/ has found it to be very similar to /ʃ/ (Jones & Llamas Reference Jones and Llamas2003, Reference Jones and Llamas2008).
The aim of this paper is to provide a detailed acoustic characterisation of Australian English fricated /t/ for comparison with the acoustic characteristics of the Australian English fricatives /s/ and /ʃ/. This analysis will indicate the extent to which fricated /t/ and /ʃ/ are likely to be perceptually confusable, and what acoustic cues listeners might use to differentiate them. A comparison with the results of Jones & Llamas (Reference Jones and Llamas2003, Reference Jones and Llamas2008) is also carried out.
Section 2 considers the phonetic and phonological background to the frication of plosives, and section 3 considers the occurrence of frication of /t/ in Australian English. Section 4 sets out the experimental methodology and the results, which are discussed in detail in section 5.
2 Background: the frication of plosives
The production of a plosive (i.e. an oral stop) requires the formation and release of a closure at some point in the vocal tract. In voiceless pulmonic plosives air pressure in the oral cavity increases during the closure phase, then an explosive burst transient is produced when the closure is released.
The production of a fricative involves the formation of a constriction at some point in the vocal tract which is narrow enough to create audible turbulence (frication) when air flows through it (Shadle Reference Shadle, Hardcastle and Marchal1990, Reference Shadle, Hardcastle and Laver1997; Stevens Reference Stevens1998; Jones & Llamas Reference Jones and Llamas2008). In voiceless fricatives, the acoustic result is aperiodic noise with characteristics determined for the most part by the properties of the cavity anterior to the constriction itself. Some zeroes may be introduced into the spectrum as a result of acoustic coupling to the back cavity, but with the typically small constriction areas for fricatives like /s/ and /ʃ/ these effects are likely to be minor (Stevens Reference Stevens1998). Oral frication may also occur at the release of a plosive, particularly voiceless plosives, when the articulators create a narrow constriction as they come apart (Stevens Reference Stevens1998; Hanson & Stevens Reference Hanson and Stevens2003: 347–348). Frication may also occur at the closure of a plosive (‘preaffrication’) if the airflow is high enough, as in the case of preaspirated stops (Laver Reference Laver1994: 374, Helgason Reference Helgason2003).
If the closure for a plosive is incomplete, frication will occur as long as the right aerodynamic conditions are met. The importance of the right aerodynamic conditions for frication in terms of constriction area and intraoral pressure is emphasised by data from a simultaneous articulatory (electropalatographic, EPG) and acoustic analysis of casual Greek speech for two speakers (Nicolaidis Reference Nicolaidis2001: 70), which shows that although 23 tokens of /t/ were incompletely occluded in the EPG record, only 12 tokens exhibited frication in the acoustic signal. Incomplete occlusion of plosives is probably very common but by itself is no guarantee of a fricated realisation.
Occlusion may be incomplete as a result of articulatory undershoot in casual speech (Beckman, de Jong, Jun & Lee Reference Beckman, de Jong, Jun and Lee1992). Ease of articulation has been put forward as the cause of some cases of plosive frication (Kirchner Reference Kirchner2001), though there is evidence to suggest that contexts with a high jaw or tongue position – contexts appearing to favour complete occlusion – may promote frication for aerodynamic reasons (Ortega-Llebaría Reference Ortega-Llebaría and Face2004; see also Beckman et al. Reference Beckman, de Jong, Jun and Lee1992 on misanalysis of post-aspiration, Jones & McDougall Reference Jones and McDougall2006 on misanalysis of preaspiration). Casual speech frication of plosives has been observed in a wide range of languages in addition to Greek (Nicolaidis Reference Nicolaidis2001: 70–71), e.g. Standard British and American English (Brown Reference Brown1977, Shockey & Gibbon Reference Shockey and Gibbon1993; see also Simpson Reference Simpson2001: 33, Lavoie Reference Lavoie2002, Shockey Reference Shockey2003: 27–28), and Austrian German (Moosmüller & Ringen Reference Moosmüller and Ringen2004). An affricated release is particularly likely before high front vowels (Hall, Hamann & Zygis Reference Hall, Hamann and Zygis2006).
It is very likely that casual speech frication of plosives occurs very commonly, perhaps even universally, when the right aerodynamic conditions occur in the production of articulations involving long narrow constrictions like voiceless laminal dentialveolar and velar stops, but some languages show regular and systematic alternation between plosives in certain contexts and fricatives in others. A regular and systematic pattern of alternation suggests that a formerly casual speech process has been phonologised, resulting in an essential aspect of that speech variety which speakers must produce in order to be counted as native speakers of that variety, rather than a low-level phonetic effect. For example, Spanish shows alternation between voiced stops and voiced continuants (fricatives or approximants) in certain contexts (Harris Reference Harris1969: 37–38, González Reference González2002, Martínez-Celdrán, Fernández-Planas & Carrera-Sabaté Reference Martínez-Celdrán, Fernández-Planas and Carrera-Sabaté2003), e.g. [uŋ ˈɡora] ‘a cap’ with a voiced velar plosive but [la ɣora] ‘the cap’ with a voiced velar fricative (or approximant). Failure to produce these forms in the right contexts would be regarded as a speech error, or mark the speaker out as a non-native, and the systematic occurrence of this non-casual frication of plosives may be transferred to a second language as a foreign accent. Other languages showing more regular frication of plosives include Tuscan Italian (Kirchner Reference Kirchner2001, Reference Kirchner, Hayes, Kirchner and Steriade2004; Sorianello Reference Sorianello2003; Stevens & Hajek Reference Stevens and Hajek2005; Villafaña-Dalcher Reference Villafaña-Dalcher2006), Irish English (Wells Reference Wells1982; Pandeli et al. Reference Pandeli, Eska, Ball and Rahilly1997; Hickey Reference Hickey1999; Jones & Llamas Reference Jones and Llamas2003, Reference Jones and Llamas2008), and Liverpool English (Wells Reference Wells1982, Honeybone Reference Honeybone2001, Sangster Reference Sangster2001, Watson Reference Watson2007). A more comprehensive list can be found in Lavoie (Reference Lavoie2001).
These considerations on the production of frication highlight the problems of using casual speech data for investigating the frication of plosives: in casual speech, fricated plosives may occur either as a low-level phonetic effect or as a more regular and systematic phonological pattern, or as both. The status of frication as a language-specific characteristic of the variety or language in question cannot be unambiguously ascertained from casual speech data. Furthermore, because frication is dependent on there being the right interplay of articulatory and aerodynamic factors, its non-occurrence in casual speech may be due to hypospeech effects on constriction area or intra-oral pressure (amongst other things), rather than the absence of systematic alternation under more formal or hyperspeech conditions. These hypospeech effects may even affect true fricatives like /s/, and perhaps particularly, /θ/. For these reasons, as well as for the purposes of carrying out a detailed analysis of acoustic characteristics, controlled speech is used in this study.
3 Frication of plosives in Australian English
The early work on Australian English, e.g. Baker (Reference Baker1945), Mitchell & Delbridge (Reference Mitchell and Delbridge1965), largely focused on vowels and did not mention fricated plosives. An ‘affricated’ variant of /t/ is noted by Horvath (Reference Horvath1985: 97) in her auditory analysis of Sydney adolescent speech, and Trudgill (Reference Trudgill1986: 141) mentions strong release of word-final plosives, especially in female speech, but rules out the possibility of actual frication. Frication of plosives is not reported in Ingram's (Reference Ingram1989) outline of connected speech processes in Australian English, based on a corpus of Brisbane adolescent speech, and anecdotal evidence suggests that frication of /t/ is absent in some varieties of Australian English, including Brisbane. The earliest report of a fully fricated variant of /t/ in Australian English may be Haslerud (Reference Haslerud1995), who refers to fully ‘sibilant’ forms of /t/ in her auditory analysis of Sydney adolescent speech. Tollfree (Reference Tollfree1996) also observed fricated variants of /t/ in data from Sydney, Adelaide, Canberra and Melbourne, then brought the form to wider attention in her published observations on variation in /t/ production in Melbourne and surrounding rural areas (Tollfree Reference Tollfree2001). Auditorily, Australian English fricated /t/ is ‘a true fricative (rather than a plosive with fricated release)’ (Tollfree Reference Tollfree2001: 58), though acoustic analysis of her interview data showed that while some tokens were fully fricated, others appeared to be plosives with heavily fricated releases (Tollfree Reference Tollfree2001: 62), consistent with the observations of Horvath (Reference Horvath1985) and Trudgill (Reference Trudgill1986).
In Tollfree (Reference Tollfree2001), 15–16-year-olds from Melbourne and surrounding rural areas produced fricated /t/ more frequently in citation speech in prepausal word-final contexts in the middle socioeconomic group (22%) than in the lower socioeconomic group (13%). The middle socioeconomic group exhibited 20% occurrence of fricated /t/ in intervocalic tokens in conversational speech (Tollfree Reference Tollfree2001: 58). By contrast, a study of plosive frication in the speech of young adult males from Melbourne by Loakes & McDougall (Reference Loakes and McDougall2007, and forthcoming) found a very low occurrence of /t/ frication in spontaneous speech. The eight speakers in this study were university students aged 18–20 with a ‘General’ accent of Australian English (cf. Mitchell & Delbridge Reference Mitchell and Delbridge1965, Harrington, Cox & Evans Reference Harrington, Cox and Evans1997). In Labovian-style interviews, only 0.9% of /t/ tokens produced by these speakers were fricated (16 out of 1763), the most popular variant in intervocalic contexts being a voiced tap. Tokens of fricated /t/ in this sample occurred in intervocalic word-final and word-medial contexts. Whilst some sociolinguistic patterning is evident, frication of /t/ appears to be a characteristic of formal speech in intervocalic and word-final pre-pausal contexts. Weakening processes often target these contexts (e.g. Honeybone Reference Honeybone2001).
The present investigation compares the acoustic characteristics of Australian English fricated /t/ with those of Australian English /s/ and /ʃ/. Given the use of 〈sh〉 as an orthographical representation of fricated /t/, similarities with /ʃ/ are predicted.
4 Experimental study
4.1 Method
4.1.1 Subjects
Subjects were five female speakers of Australian English with a ‘General’ accent (cf. Mitchell & Delbridge Reference Mitchell and Delbridge1965, Harrington et al. Reference Harrington, Cox and Evans1997) from Melbourne (denoted AF1, AF2, . . .). The speakers were aged 28–31 and university-educated. They had mainly grown up in Melbourne, except AF3, who grew up in Geelong. All had attended private (fee-paying) schools except AF4, who had attended a state school mainly and a private school for two years. Subjects AF4 and AF5 were residing in Cambridge at the time of recording, after varying periods spent in a British-English-speaking environment (9 months and 15 months, respectively). The speakers had no history of speech or hearing problems. These speakers were selected as being very likely to produce the necessary realisations of fricated /t/ in formal contexts, as suggested by sociolinguistic profiling in Tollfree (Reference Tollfree2001). Selection of subjects on these grounds was necessary as the focus of this study is on fricated /t/ and its relationship with /s/ and /ʃ/, rather than general patterns of variation in the realisation of Australian English /t/.
4.1.2 Materials
Controlled data were required for the acoustic analysis. The experimental materials were a set of sentences of the form Whisper X again (X = test word), designed to elicit word-final and word-medial /t/, /s/ and /ʃ/ in intervocalic position with the preceding vowel quality /æ/. Based on previous investigations of Australian fricated /t/ and phonological and phonetic considerations concerning frication processes in general, intervocalic word-final and word-medial realisations of /t/ were assessed to be most likely to be fricated and therefore most likely to provide fricated /t/ data for the acoustic analysis. The test words were mat, mass, mash for the word-final context, and batting, gassing, dashing for the word-medial context.Footnote 1 Thus the vowel following the target consonant was schwa for the word-final context, and /ɪ/ for the word-medial context. Six tokens of each word were elicited per speaker. The sentences were arranged in random order and interspersed with a number of filler items.
4.1.3 Recording
Subjects were recorded either in the field (AF1–3) or in the sound-treated room in the phonetics laboratory at the University of Cambridge (AF4, AF5). Each subject was seated with an omni-directional Sony ECM-16T electret condenser microphone (frequency response: 50–15,000 Hz) positioned approximately 30 cm from her mouth. The recordings were made on Digital Audio Tape (DAT) using a Sony TCD-D8 portable DAT recorder (sample rate: 48 kHz). The recordings were re-digitised at a sampling rate of 22,050 Hz using a Toshiba Satellite laptop computer and band-pass filtered between 100 Hz and 9000 Hz (30 Hz smoothing) for analysis using the Praat speech analysis program (http://www.praat.org). Subjects were asked to read the sentences in a normal relaxed speaking style and practised reading the first few sentences aloud before the recording was made. They were encouraged to take their time between sentences and asked to re-record any sentences containing errors.
4.1.4 Analysis
A visual analysis of the utterances of mat and batting using wideband spectrograms was first carried out to identify tokens containing fricated /t/ for use in the detailed acoustic analysis. Fricated tokens of /t/ were identified as those which show sustained aperiodic noise. Tokens with canonical periods of closure and release, and voiced taps were excluded from the analysis. Details of the inventory of variants observed are given in section 4.2.1 below. For each surface fricative, /s/, /ʃ/ and fricated /t/, the relative duration of the frication was measured, then normalised as a percentage of utterance duration.
Frication was identified by hand from the spectrogram and waveform windows. Fricatives are often preceded by effects similar to those seen in pre-aspirated stops as the vocal folds abduct to provide the high airflow rate required for the generation of oral frication (Ní Chasaide & Gobl Reference Ní Chasaide, Gobl, Hardcastle and Hewlett1999, Jones & Llamas Reference Jones and Llamas2003). Breathy voicing and voiceless aspiration noise generated at the glottis are characteristic effects of vocal fold abduction with a relatively unconstricted supralaryngeal vocal tract, and these effects were observed here before canonically occluded realisations of /t/, indicating that the speech of these Australian English speakers may exhibit pre-aspirated post-vocalic plosives. Oral frication is higher in amplitude than glottal frication (or true aspiration) with a different spectral quality (Stevens Reference Stevens1998: 457–464), and so the onset of oral frication for the fricated realisations of /t/ was determined with reference to spectral changes in the quality of frication in the spectrogram and amplitude changes in the waveform and spectrogram. The onset of broad bandwidth oral frication is often very abrupt and there were no problems in determining the duration of oral as opposed to glottal frication. The acoustic nature of the vowel offset, with voicing and aspiration variably present and the formant bandwidth and structure affected by varying degrees of non-modal voicing, makes a reliable analysis of formant transitions into the fricatives impractical.
Various measurement techniques were applied to the central 50 ms of the frication itself. These measures were those applied in a range of recent and seminal works on the acoustics of fricatives (e.g. Strevens Reference Strevens1960, Gordon, Barthmaier & Sands Reference Gordon, Barthmaier and Sands2002) and are based on an assessment of the most important acoustic aspects of fricative production (for discussion, see Shadle Reference Shadle, Hardcastle and Marchal1990, Stevens Reference Stevens1998). The frequency location and amplitude of the two major spectral peaks were identified by hand from FFT spectra of 50 ms of frication. The frequency range of energy falling within 12 dB of the major spectral peak was also measured (van Dommelen Reference van Dommelen2003). The amplitude of 50 ms of frication was measured and normalised against the amplitude of modal voicing in the preceding vowel.
In addition, statistical measures of the frication spectrum were acquired (Jongman, Wayland & Wong Reference Jongman, Wayland and Wong2000). These measures allow the fricatives /s/ and /ʃ/ and the fricated /t/ to be compared quantitatively in a number of ways by treating the spectrum of the fricative as a statistical distribution curve. Centre of gravity (COG) is the most frequently reported statistical spectral measure. It provides an amplitude-weighted mean frequency for the spectrum in Hertz. Dispersion provides an indication of the spread of the fricative energy around the mean (in Hz), with a larger value indicating a broader bandwidth of fricative noise. Kurtosis provides an indication of the flatness of the spectrum, i.e. the extent to which it is dominated by a single spectral peak. Skewness indicates the extent to which the energy in the spectrum is normally distributed around the mean: an imbalance of energy between 0 Hz and the mean frequency gives a negative value (negatively skewed), whereas an imbalance of energy between the mean frequency and the upper cut-off frequency gives a positive value (positively skewed). The upper cut-off is determined by the Nyquist frequency (sampling rate / 2) or any low-pass filter applied to the sound file, i.e. 9000 Hz in this instance. The frequency bandwidth analysed can have a considerable effect on these spectral measures (see Tabain Reference Tabain2001 and references therein).
Statistical analysis was undertaken using SPSS. For each speaker, the acoustic measurements for a given target word were averaged across repetitions. The various measures were each subjected to a two-way repeated measures analysis of variance with the factors Consonant (fricated /t/, /s/, /ʃ/) and Position (word-final, word-medial). Where the effect of Consonant was significant, pairwise comparisons using the Sidak correction were carried out.
4.2 Results
4.2.1 General remarks
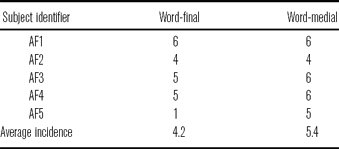
As stated above, the subjects and elicitation environments were selected to provide the greatest opportunity of eliciting fricated realisations of /t/. To reiterate, the aim of the research was to investigate the acoustic characteristics of fricated /t/ for comparison with those of /ʃ/ and /s/, not a survey of /t/ realisations by Australian English speakers. However, not all subjects produced fully fricated realisations of /t/ in all tokens, i.e. realisations showing constant aperiodic noise, though such realisations did make up the majority of tokens in both word-final (70%) and word-medial (90%) contexts. These figures indicate that word-medial context is more likely to show fricated /t/, but it must be borne in mind that whereas word-final contexts were followed by /ə/, word-medial contexts were followed by an /ɪ/ vowel. The high front vowel context may be more likely to result in frication of /t/ for aerodynamic reasons (cf. Ortega-Llebaría Reference Ortega-Llebaría and Face2004, Hall et al. Reference Hall, Hamann and Zygis2006). The number of tokens of the test words exhibiting fricated realisations of /t/ is given in table 1.
Incidence of fricated /t/ realisations in the word-final intervocalic context (‘mat again’) and the word-medial intervocalic context (‘batting’).

In some cases (8/36), canonical plosive realisations were seen. Plosive realisations involved a period of silence (indicative of articulatory closure) followed by an acoustic transient, an abrupt onset of energy across a wide frequency range, and frication (indicative of articulatory release or oral pressure, cf. Stevens Reference Stevens1998). Plosives occurred for 5/6 tokens of mat for subject AF5, and once each again for mat for AF4 and AF3. Plosive realisations of batting occurred twice for AF2. In many cases the plosives occurred with coarticulatory voice quality effects on the preceding vowel which can be attributed to vocal fold abduction (Ní Chasaide & Gobl Reference Ní Chasaide, Gobl, Hardcastle and Hewlett1999), i.e. preaspiration of the plosive. To the best of our knowledge, preaspiration has not been considered to be a feature of Australian English /t/ before. Jones & McDougall (Reference Jones and McDougall2006) speculate that preaffrication of a preaspirated stop could play a role in the development of a phonologised frication process. However, subject AF4 regularly produced a final fricated /t/ with pre-glottalisation of the preceding vowel. Two tokens of mat for AF2 had voiced tap (or possibly approximant) realisations. Taps are a possible realisation of /t/ in Australian English (Tollfree Reference Tollfree2001, Evans & Watson Reference Evans and Watson2003, Cox & Palethorpe Reference Cox and Palethorpe2007, Loakes & McDougall forthcoming). These non-fricated realisations are excluded from analysis here.
Some realisations (5/36) judged here as ‘fricated’ in fact involved a very brief low amplitude period (10–17 ms) followed by a period of extended frication. These realisations seemed to be speaker-specific, with data from AF3 providing almost all instances. Importantly for our classification, the frication in such cases showed a relatively gradual onset with no transient. As an onset transient was lacking, the low amplitude period is unlikely to be due to complete articulatory occlusion, but is perhaps a period of incomplete occlusion where the cross-sectional area of constriction is so small that the volume velocity of airflow falls below the level required to generate frication (cf. also Jones & Llamas Reference Jones and Llamas2003, Reference Jones and Llamas2008). These incompletely fricated realisations always show a period of strong frication which occupies almost all of the time course of the consonant and are clearly not fully occluded plosives.
It is debatable whether the observed brief reduction in amplitude contributes to the percept of a stop (cf. Tollfree's Reference Tollfree2001 impressionistic comments on ‘true fricatives’ versus her instrumental analysis with more stop-like realisations). Research, albeit not on word-final fricatives in Australian English, also suggests that very brief durations of silence (< 20 ms) are not heard (Dorman, Raphael & Liberman Reference Dorman, Raphael and Liberman1979) and that only relatively brief durations of frication (> 20 ms) are needed to cue the percept of fricative manner (Jongman Reference Jongman1989). The low amplitude period in these data had a duration of 5–20 ms. The tokens with a low amplitude period during frication were referred to as ‘intermediate’ in Jones & McDougall (Reference Jones and McDougall2006). However, they differ radically from the kind of gradient realisations referred to as ‘intermediate’ in Middlesbrough English (2008), as well as from the so-called ‘semi-fricated’ plosives which have been observed in Sienese Italian (Stevens & Hajek Reference Stevens and Hajek2005). The Middlesbrough ‘intermediate’ forms bear similarities to the ‘archway’ or ‘quotes’ patterns of frication observed in nearby Tyneside English (Docherty & Foulkes Reference Docherty and Foulkes1996, Reference Docherty and Foulkes1999). While the ‘archway’ pattern may be interpreted as indicating a gradual reduction and increase in constriction area, leading to a change in airflow rate and the reduction of frication amplitude, such patterns are not necessarily indicative of a residual closure gesture for the underlying or historical stop. Phonological fricatives such as /s, ʃ, f/ show similar changes in constriction area during production even though, being indisputably fricatives, a target involving complete closure is not attributed to them (Stevens Reference Stevens1998), with the result that double-peaked intensity curves and ‘archway’ patterns of frication can also be observed occasionally in sounds which are indisputably fricatives at the phonetic and phonological levels of analysis.
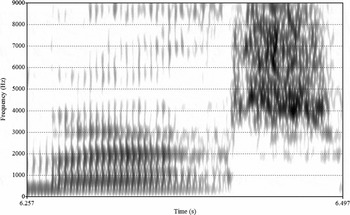
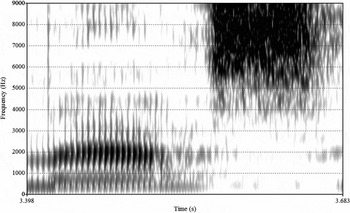
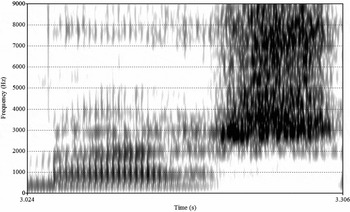
Figures 1–3 show wideband spectrographic images generated within Praat of individual tokens from a single speaker of mat (with fricated /t/), mass and mash. The images start part way through the /m/ and continue to the onset of periodicity for the /ə/ of again. The fully fricated nature of the /t/ realisation is evident in the continuous and relatively uniform aperiodicity, also exhibited in the tokens of /s/ and /ʃ/. All tokens also show the acoustic effects of a high rate of airflow at the vowel-consonant transition, probably due to vocal fold abduction, an effect generally known as ‘preaspiration’ for plosives, which is generally seen on vowels preceding voiceless fricatives (Ní Chasaide & Gobl Reference Ní Chasaide, Gobl, Hardcastle and Hewlett1999, but cf. Gordeeva Reference Gordeeva2007). Word-medial intervocalic realisations of fricated /t/ exhibit very similar characteristics to the word-final intervocalic realisations.
Spectrogram of a token of ‘mat’ with fricated /t/ (subject AF3).

Spectrogram of a token of ‘mass’ (subject AF3).

Spectrogram of a token of ‘mash’ (subject AF3).

4.2.2 Relative duration
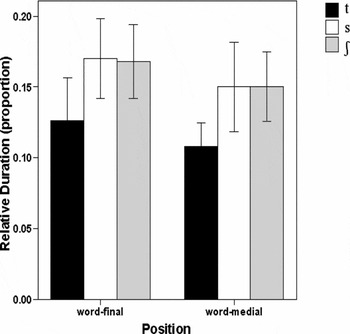
Fricated /t/ has the shortest mean relative duration of the three fricatives for all subjects in both word-final and word-medial contexts (overall means: fricated /t/ = 0.117, /s/ = 0.160, /ʃ/ = 0.159), but word-medial durations are shorter than word-final contexts for all fricatives for almost all subjects. Figure 4 shows the mean relative durations for each fricative in word-final and word-medial contexts.
Mean relative duration of fricated /t/, /s/ and /ʃ/ in word-final and word-medial contexts. Error bars show ±2 standard deviations.

The effect of Consonant on relative duration was significant (F(2, 8) = 52.377, p < .001), but there was no significant effect of Position (F(1, 4) = 5.091, p = .087), nor was the interaction of Consonant × Position significant (F(2, 8) = 0.032, p = .968). Pairwise comparisons showed significant differences between fricated /t/ and each of the phonological fricatives (/t/ versus /s/: p = .003, /t/ versus /ʃ/: p = .002), but there was no significant difference between /s/ and /ʃ/ (p = .997).
4.2.3 Relative amplitude
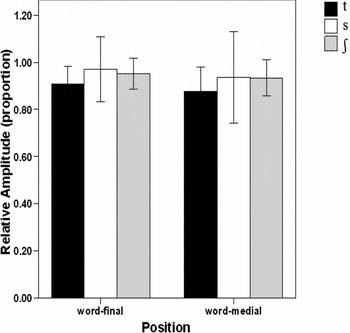
Fricated /t/ had the lowest average relative amplitude of all fricatives in both contexts (mean = 0.893), as can be seen in figure 5. The relative amplitudes of /s/ and /ʃ/ were very close on average (mean /s/ = 0.953, mean /ʃ/ = 0.943), but showed some individual variation in terms of which was highest. The effects of Consonant and Position and their interaction were not significant at the 5% level (Consonant: F(2, 8) = 3.528, p = .080, Position: F(1, 4) = 7.048, p = .057, Consonant × Position F(2, 8) = 1.137, p = .368).
Mean relative amplitudes of fricated /t/, /s/ and /ʃ/ in word-final and word-medial contexts. Error bars show ±2 standard deviations.

4.2.4 Centre of gravity
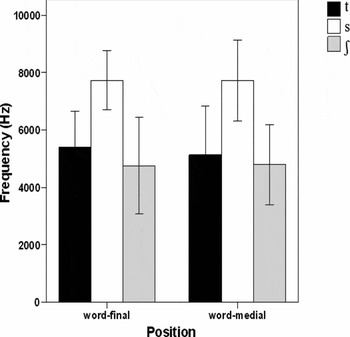
The mean COG values differed across subjects as might be expected, but the same relationships among consonants held for each individual. For all subjects in both contexts, mean COG values were much higher for /s/ than for /ʃ/. The COG values for fricated /t/ (mean = 5264 Hz) were much closer to the values for /ʃ/ (mean = 4774 Hz) than to the values for /s/ (mean = 7725 Hz) for each subject. The similarity between /t/ and /ʃ/ can be seen in figure 6 which shows the mean COG for each consonant in word-final and word-medial contexts.
Mean centre of gravity (Hz) of fricated /t/, /s/ and /ʃ/ in word-final and word-medial contexts. Error bars show ±2 standard deviations.

Statistically, there was a significant effect of Consonant (F(2, 8) = 146.640, p < .001), but not of Position (F(1, 4) = 0.432 p = .547), and no interaction between them (F(2, 8) = 1.319, p = .320). In pairwise comparisons, there was no significant difference between the COG of fricated /t/ and /ʃ/ (p = .141). Other comparisons were significant (fricated /t/ versus /s/: p < .001; /s/ versus /ʃ/: p = .001).
4.2.5 Range and major spectral peak frequency
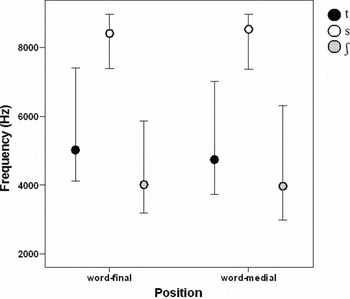
The mean range of frequencies within 12 dB of the major spectral peak (the ‘range’) for fricated /t/, /s/ and /ʃ/, together with the location of the mean peak frequency within the range are shown for word-final and word-medial contexts in figure 7. Comparison of the major spectral peak of each consonant also shows that in both positions, fricated /t/ (mean = 4885 Hz) is more similar to /ʃ/ (mean = 3994 Hz) than to /s/ (mean = 8476 Hz). The range also demonstrates similarity between fricated /t/ and /ʃ/, with /s/ exhibiting a mean range (1588 Hz) smaller than that of fricated /t/ (3254 Hz) and of /ʃ/ (2998 Hz). This pattern was shown by all subjects except AF3 who showed a similar range for fricated /t/ and /s/ in the word-final context.
Mean range and major spectral peak (Hz) of fricated /t/, /s/ and /ʃ/ in word-final and word-medial contexts. The circles show the peak frequencies. The bars indicate the range of frequencies within 12 dB of the amplitude of the peak frequency.

For the frequency of the major spectral peak, the effect of Consonant was statistically significant (F(2, 8) = 143.302, p < .001), but Position was not (F(1, 4) = 0.170, p = .701) and there was no significant interaction between the two factors (F(2, 8) = 1.214, p = .346). In pairwise comparisons, all three consonants were significantly different from each other (/t/ versus /ʃ/: p = .016; /t/ versus /s/: p < .001, /s/ versus /ʃ/: p < .001). The remaining pairwise comparisons were significant (p < .001 in both cases).
Statistically, the range does not confirm the pattern of similarity between fricated /t/ and /ʃ/. Neither Consonant nor Position nor their interaction had a significant effect on the frequency bandwidth of the range (Consonant: F(1.105, 5.523) = 3.518, p = .113 with Greenhouse Geisser correction; Position: F(1, 5) = 0.643, p = .459; Consonant × Position: F(2, 10) = 0.643, p = .459).
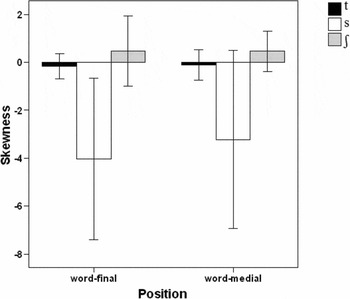
4.2.6 Skewness
The mean skewness for each fricative also showed greater similarity between fricated /t/ and /ʃ/ than between fricated /t/ and /s/ in Australian English. This can be seen in figure 8, which shows the mean skewness of each fricative in the two positions.
Mean skewness of fricated /t/, /s/ and /ʃ/ in word-final and word-medial contexts. Error bars show ±2 standard deviations.

The skewness of /s/ across contexts is negative and the largest of the three consonants (mean = –3.626) while fricated /t/ and /ʃ/ demonstrate values close to each other and closer to zero (fricated /t/: mean = –0.134; /ʃ/: mean = 0.465). The effect of Consonant is statistically significant (F(2, 8) = 19.473, p = .001), but the effect of Position is not (F(1, 4) = 6.073, p = .069). Pairwise comparisons showed no significant difference between fricated /t/ and /ʃ/ (p = .353), nor between fricated /t/ and /s/ (p = .055), while /s/ versus /ʃ/ was statistically significant (p = .017). There is a significant interaction between Consonant and Position (F(2, 8) = 19.473, p = .001) which indicates that the degree of skewness of each consonant depends on its position. Contrasts breaking down this interaction revealed significant differences when comparing word-final to word-medial position for both /t/ compared with /s/ (F(1, 4) = 13.221, p = .022) and /ʃ/ compared with /s/ (F(1, 4) = 16.367, p = .016), with word-medial position decreasing skewness significantly more for /s/ than for /t/ or /ʃ/ as can be seen in figure 8. There was no significant interaction when comparing word-final and word-medial positions for /t/ compared with /ʃ/ (F(1, 4) = 0.311, p = .607).
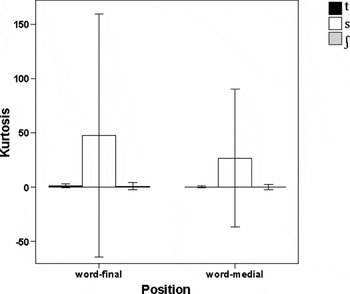
4.2.7 Kurtosis
Similarity between fricated /t/ and /ʃ/ is also evident for kurtosis. Figure 9 shows the mean kurtosis of each fricative in word-medial and word-final contexts. Across contexts, the mean kurtosis of fricated /t/ and /ʃ/ were close, 0.854 and 0.653, respectively, while the mean kurtosis of /s/ was 37.333.
Mean kurtosis of fricated /t/, /s/ and /ʃ/ in word-final and word-medial contexts.

However, this pattern was not confirmed statistically: the effect of Consonant was not significant (F(1.001, 4.003) = 3.435, p = .137 with Greenhouse Geisser correction), the effect of Position was not significant (F(1, 4) = 3.567, p = .132), and neither was the interaction between them (F(1.002, 4.009) = 2.824, p = .168 with Greenhouse Geisser correction). At a glance, it is surprising that Consonant did not reach significance, given the large differences between /s/ and the other consonants seen in figure 9. However examination of the values for individuals shows that the large kurtosis values for /s/ are in part due to outlier values for one speaker, AF5 (mean kurtosis of AF5 for word-final /s/: 145.22; mean kurtosis of AF5 for word-medial /s/: 78.10). The mean kurtoses for /s/ excluding speaker AF5 are 23.330 (word-final) and 14.173 (word-medial), which are still larger than those for /t/ and /ʃ/, however the standard deviations for the data without AF5 are also large: 23.962 (word-medial) and 14.891 (word-final).
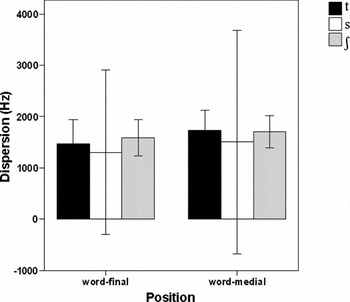
4.2.8 Dispersion
The results for dispersion again suggest similarity between fricated /t/ and /ʃ/, although, like the results for kurtosis, the pattern is not statistically significant due to large standard deviations. Figure 10 shows the mean dispersion of each fricative in the two positions.
Mean dispersion of fricated /t/, /s/ and /ʃ/ in word-final and word-medial contexts. Error bars show ±2 standard deviations.

The mean dispersion of fricated /t/ across contexts (1598 Hz) is close to that of /ʃ/ (1648 Hz), while the mean for /s/ is lower (1403 Hz). Consonant does not have a significant effect (F(1.064, 4.256) = 0.287, p = .633 with Greenhouse Geisser correction), nor does the interaction Consonant × Position (F(2, 8) = 0.489, p = .630). The effect of Position, however, is significant (F(1, 4) = 15.709, p = .017), with word-final contexts yielding a lower dispersion (mean = 1452 Hz) than word-medial contexts (mean = 1647 Hz).
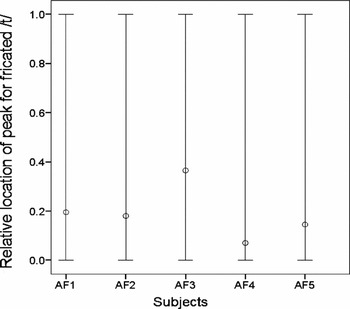
4.2.9 Normalised individual peak frequency data
Each individual subject's results for peak frequency of fricated /t/ can be normalised against her results for peak frequency for /s/ and /ʃ/. By assigning the average peak frequency of /s/ the value of 1 and the average peak frequency for /ʃ/ the value of 0, the average peak frequency of fricated /t/ can be placed on the resulting scale and the degree of ‘/ʃ/-ness’ of the /t/ can be determined. To do this, the average peak frequency of /ʃ/ is subtracted from the average peak frequency of /s/ to give the frequency difference between the lower and upper ends of the scale. Next, the average peak frequency of /ʃ/ is subtracted from the average peak frequency of /t/ to give the raw frequency difference between the lower end of the scale (i.e. /ʃ/) and /t/. Finally, the value for /t/–/ʃ/ is divided by the value for /s/–/ʃ/ to give a numerical value to the location of the average peak frequency of /t/ relative to /s/ and /ʃ/. The normalisation is given using the equation below:

The results for each individual subject are shown in figure 11.
Normalised relative location of peak for fricated /t/ (indicated by the open circle) relative to /s/ = 1 and /ʃ/ = 0, averaged over word-final and word-medial positions per subject.

The graph shows that the peak for fricated /t/ is located very close to /ʃ/ for all subjects, with most subjects having a value lower than 0.2. Only AF3 has a higher value, at 0.37. AF3 is the subject who has clear periods of amplitude reduction in her tokens of fricated /t/, and this may be relevant to the higher relative peak frequency. Some variation does occur for individuals between word-final and word-medial positions (not shown in figure 11), but even taking this variation into account, no cases of fricated /t/ are located further along the scale than 0.39.
4.2.10 Summary of experimental results
The formal laboratory-speech data for all but one of the female speakers of Melbourne English studied show that frication of /t/ is the majority realisation of intervocalic /t/, with frication more common in word-medial intervocalic position (preceding /ɪ/) than in word-final intervocalic position (preceding /ə/). Apparent speaker-specific patterns are observed. If /t/ is not fricated in this elicitation task, it is usually realised as a preaspirated plosive.
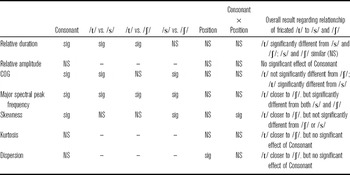
A summary of the experimental findings from the acoustic analysis is presented in tabular form in table 2. The columns headed ‘Consonant’, ‘Position’ and ‘Consonant × Position’ give the results of the ANOVA for each factor and their interaction at the 5% level. The columns headed ‘/t/ vs. /s/’ and similar give the results of the pairwise comparisons in cases where Consonant was a significant factor. The rightmost column summarises the relationship of fricated /t/ to /s/ and /ʃ/ for each acoustic feature examined.
Summary of statistical findings regarding the effects of Consonant and Position on the acoustic measures examined. ‘sig’ indicates the ANOVA or pairwise comparison yielded a significant result at the 5% level; ‘NS’ indicates the result was not significant.

5 Discussion
The frication of /t/ in the variety of Australian English examined here results potentially in an additional fricative contrast at the phonetic level between /s/, /ʃ/, and fricated /t/, in word-final and word-medial intervocalic positions. The three voiceless fricatives are all produced by the formation of a constriction between the tongue-tip or tongue-blade and locations in the upper anterior portion of the oral cavity. The acoustic comparison of the three surface fricatives reported here shows that frication of /t/ usually involves constant frication – unlike patterns seen in Tyneside and Middlesbrough English, but like patterns seen in Irish English – and that the characteristics of this frication are similar to that of /ʃ/ in many respects.
Frication of /t/ appears slightly more likely in word-medial than in word-final contexts. This difference could be an effect of segmental context, with the high vowel in matting more likely to promote frication (Hall et al. Reference Hall, Hamann and Zygis2006; see comments in section 2), but it is probably unwise to strike too phonemic a line as regards the central mid articulation of the following /ə/ in the word-final contexts, i.e. mat again. Schwa is a very malleable vowel and may well be articulatorily ‘fronted’ by the lingual posture required for the /t/ (cf. Bernard & Lloyd Reference Bernard, Lloyd, Collins and Blair1989 on Australian English schwa, Bates Reference Bates1995 on Standard Southern British English schwa, Choi Reference Choi1991 on Kabardian schwa). The discrepancy between word-medial and word-final realisations is in fact due to a single subject, AF5, with the other subjects being consistent in their use of fricated /t/ across contexts (see table 1 above). For subject AF5, the word-medial frication may be due to the greater predictability of the following context. In word-final positions, frication of /t/ may not always be seen if a consonant follows, and this probabilistic effect may be at the root of the less frequent frication of word-final intervocalic /t/. For this subject, the absence of frication of /t/ may therefore serve a function of demarcating word boundaries, but this possibility does not apply to the other subjects’ data.
Fricated /t/ and /ʃ/ were similar to each other but significantly different from /s/ in COG. Fricated /t/ also showed resemblance to /ʃ/ rather than /s/ in skewness, kurtosis and dispersion although this pattern was not significant at the 5% level. All three consonants differed significantly from each other in major spectral peak frequency, but the value for fricated /t/ was closer to that of /ʃ/ than /s/. Fricated /t/ was significantly different from both /s/ and /ʃ/ in duration, but amplitude did not demonstrate an effect of Consonant.
Like /ʃ/, Australian English fricated /t/ has a COG between 4000–5000 Hz, a major spectral peak also between 4000–5000 Hz, a skewness value close to zero, and a spectrum not dominated by a large concentration of energy about the mean. When average COG and major spectral peak values of fricated /t/ are normalised across subjects relative to their values of /s/ and /ʃ/, all subjects show that fricated /t/ occurs much closer to /ʃ/ than to /s/. The characteristics of /s/, on the other hand, demonstrate a much higher COG (well above 7000 Hz), a major spectral peak above 8000 Hz, and a negatively skewed spectral envelope showing the dominance of a narrow frequency area. The results for /ʃ/ and /s/ parallel studies of these sounds in other varieties of English (e.g. Hughes & Halle Reference Hughes and Halle1956, Jongman et al. Reference Jongman, Wayland and Wong2000) and in other languages (e.g. Gordon et al. Reference Gordon, Barthmaier and Sands2002), as far as comparisons across different word-positions, vowel qualities, and analysis techniques can be drawn. The realisation of /s/ involves higher frequency concentrations of energy than /ʃ/. One issue which is not addressed in the present study is the possibility that the emergence of an additional surface fricative in fricated /t/ might lead to some kind of ‘dispersion’ or ‘polarisation’ of the acoustic characteristics of /s/ and /ʃ/ relative to other varieties of English and other languages. Retroflex realisations of historical /ʃ/ may have developed in Slavic languages like Polish and Russian in response to the emergence of /ɕ/ (Hamann Reference Hamann2004). Further research on systemic adaptations of this sort is required.
No perceptual testing is included in the current research and so any consideration of the robustness of the /t/–/ʃ/ contrast must necessarily be speculative. Since fricated realisations of /t/ are not the majority realisations in all contexts for all speakers, future perceptual work should take into consideration the link between production and perception in individual subjects and the apparently varying incidence of lexical and post-lexical effects. The results show that the orthographic representation of /t/ as 〈sh〉 does reflect considerable acoustic similarity between fricated /t/ and /ʃ/. The fricated /t/–/ʃ/ contrast may be maintained by durational differences; the duration of fricated /t/ is significantly lower than that of /ʃ/. The role of this durational difference in maintaining fricative contrasts in Australian English requires investigation in future perceptual work. Further, one subject (AF4) preglottalises all instances of fricated /t/ in mat which could function as an additional cue in this context for some speakers.
Given these acoustic similarities, the articulation of fricated /t/ is expected to be similar to that of /ʃ/, i.e. (apico-)laminal postalveolar. Slight differences in peak values, COG, and distribution of the range energy (within 12 dB of the peak amplitude) suggest that there may be some subtle articulatory differences between fricated /t/ and /ʃ/. The low frequency characteristics of /ʃ/ relative to /s/ are often partly attributed to a sub- or antelingual cavity together with lip-rounding (Hamann Reference Hamann2004). Fricated /t/ may show a smaller sublingual cavity (or lack it altogether), and it may also lack lip-rounding. The acoustic similarities to /ʃ/ suggest that Australian English fricated /t/ could be an obstacle fricative with frication generated at the teeth (Shadle Reference Shadle, Hardcastle and Marchal1990), in which case it would qualify as being a ‘sibilant’ under many definitions of this term, and [+strident] (according to Stevens Reference Stevens1998: 249). Instrumental confirmation of these assessments would be of considerable interest, and should be pursued in future work. The phonological importance of sibilance in this case is discussed further below.
A further finding is that the group average spectral qualities of the fricatives /s/ and /ʃ/ and fricated /t/ are not generally affected by a change in position from word-final to word-medial context, consistent with expectations for fricatives, sounds which require precise articulatory control in their production. The data do show an interaction between Consonant and Position for skewness, and dispersion is also affected by Position, though this may be an artefact of a reduction in amplitude. There is some individual variation, however, and this requires further investigation.
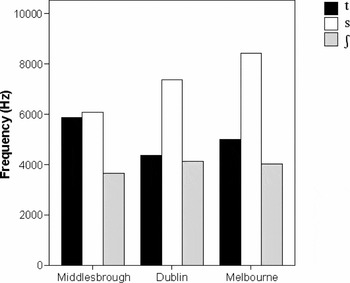
The pattern of similarity between Australian English fricated /t/ and /ʃ/ parallels the pattern of similarity seen for Dublin English slit-/t/ and /ʃ/, but contrasts with the similarity between fricated /t/ and /s/ seen in Middlesbrough English (Jones & Llamas Reference Jones and Llamas2003, Reference Jones and Llamas2008). The data from the Jones & Llamas studies are directly comparable with the Australian English data presented here in terms of elicitation context and experimental procedure so it can be stated that under identical production conditions, the speakers examined from all three varieties fricate their realisations of word-final intervocalic /t/, but the acoustic characteristics of these realisations differ systematically across varieties. Figure 12 shows the average peak frequencies of frication in mat, mass and mash for Middlesbrough female subjects (n = 4) and Dublin female subjects (n = 4) based on data from Jones and Llamas (Reference Jones and Llamas2003, Reference Jones and Llamas2008) together with the relevant data for Melbourne Australian female subjects (n = 5) from this study.
Relative average peak frequency for word-final /s/, /ʃ/, and fricated /t/ for female Middlesbrough (n = 4) and Dublin English (n = 4) subjects (based on Jones & Llamas Reference Jones and Llamas2008) and for the female Melbourne English subjects analysed here (n = 5). The relative position of fricated /t/ is close to /ʃ/ in Dublin and Melbourne English, but close to /s/ in Middlesbrough English.

There are differences between the groups shown in figure 12 in terms of absolute average frequencies. These patterns may be attributed to dialect-specific learnt effects or biological differences between the groups. As expected from previous acoustic studies of /s/ and /ʃ/, the peak for /s/ is higher in frequency than the peak for /ʃ/ in all three groups. In terms of the relative frequency of the peak for fricated /t/, the graph makes it clear that Middlesbrough fricated /t/ is more /s/-like, while Dublin and Australian fricated /t/ are more /ʃ/-like. The distance between the peak of Australian /ʃ/ and fricated /t/ is greater than that seen in the Dublin data, but this may be a consequence of the greater overall dispersion of the fricative peaks in the frequency range for Australian English.
In addition, while Middlesbrough English fricated /t/ shows a range of intermediate forms (cf. the ‘archway’ and ‘quotes’ forms seen in Tyneside English, Docherty & Foulkes Reference Docherty and Foulkes1996, Reference Docherty and Foulkes1999), this kind of pattern is generally absent in highly controlled data on fricated /t/ in word-final intervocalic contexts in the same lexical items in Australian English, and in Irish English data elicited under near-identical conditions (Jones & Llamas Reference Jones and Llamas2008). Jones & Llamas (Reference Jones and Llamas2008) have interpreted /t/ frication in Middlesbrough English as a low-level phonetic or speaker-specific phonological effect, as opposed to a more phonologically categorical and systematic frication of /t/ in Irish English. Australian English fricated /t/ seems to be similar to Irish English fricated /t/ in terms of its more robustly fricative-like realisation and the /ʃ/-like characteristics of that realisation.
It may be that there is some very straightforward reason for the similarities between Australian and Irish English fricated /t/ which does not require any reference to a single historical origin. One reason which suggests itself is that a particular kind of /t/ realisation, e.g. laminal dentialveolar, results in a particular pattern of frication. This seems plausible enough but remains to be determined empirically. However, given Tollfree's identification of a possible Irish English source for Australian English fricated /t/, and the background of substantial Irish immigration during the white colonisation of Australia, it is possible that these patterns provide support for Tollfree's contact hypothesis. A detailed historico-social study would be needed to further clarify the situation, but the similarities to the Irish English data do seem to lend support to the view that Australian English fricated /t/ could be a transfer effect, possibly a very indirect one, from the Irish or Irish English speech of immigrants to Australia in the 1800's (Tollfree Reference Tollfree2001; see also Taylor Reference Taylor2001: 320–321, Mitchell Reference Mitchell2003; but cf. Cox Reference Cox1996: 9).
The alternative would be to view the frication of Australian English /t/ as a parallel development with a socioindexical function rather than a phonetic transfer effect. This possibility cannot be ruled out because frication of plosives is a very common process in casual speech and (presumably therefore) also in sound change (see section 2 above). However, the comparison shown in figure 12 between Irish English and Middlesbrough English data from Jones & Llamas (Reference Jones and Llamas2003, Reference Jones and Llamas2008) and the Australian English data from this study provides support for a phonetic parallel between Australian English fricated /t/ and Irish English slit-/t/. Further data are required on frication of /t/ in other varieties of English and, in particular, in languages other than English to demonstrate the possibility that an /ʃ/-like fricated /t/ may occur independently. On a final note, if Australian English fricated /t/ does ultimately derive from a language contact effect based on the acquisition of English as a second language by native speakers of Irish, it cannot be viewed as the result of lenition in the sense of a language-internal process motivated by cross-linguistically observed tendencies in speech production and perception. The transfer of L1 Irish fricated palatalised /t/ to realise L2 English /t/ (Ó hÚrdail Reference Ó hÚrdail1997) would have been motivated by phonetic parallels across specific languages, not a process with a more universal origin.
Whether Australian English fricated /t/ is an independent development or a transfer effect, it appears that it has either remained largely unnoticed throughout most of the 20th century. Preliminary acoustic analysis of recordings in the Mitchell & Delbridge database (Mitchell & Delbridge Reference Mitchell and Delbridge1965; 1998 reissue, The University of Sydney: http://www.ee.usyd.edu.au/cgi-bin/w3-msql/speech/speechsearch.html) indicates the presence of fricated /t/ in Australian English in the 1950s and 1960s. Figure 13 shows one instance of a fricated /t/ from the Mitchell & Delbridge database in the word night in a phrase-final context. The speaker is a female from Melbourne, aged 16–17. There is no scope for a controlled comparison of /s/, /ʃ/ and fricated /t/ for this speaker, but the general characteristics of the /t/ fit well with the 21st century data analysed here. The frication is complete with no indication of closure, and despite the relatively poor quality of the recordings, the distribution of visible spectral energy is unmistakably similar to that observed in the data collected for the present study. The spectral characteristics of the fricated /t/ based on a 50 ms window at the fricative midpoint show a peak at around 4900 Hz, very close to the averages reported above.
Spectrogram and waveform of word-final fricated /t/ in the word ‘night’ produced by a female speaker of Melbourne English (aged 16–17 years), recorded in 1960 (subject 5374), from the Mitchell & Delbridge database (Reference Mitchell and Delbridge1965).

The presence of fricated realisations of /t/ in the Mitchell & Delbridge database which compare so well with the results of the present controlled acoustic study demonstrate that Australian English fricated /t/ goes back at least 40 years, well before the first reports of ‘sibilant’ or fricated realisations of /t/ (Haslerud Reference Haslerud1995, Tollfree Reference Tollfree1996). Tollfree (Reference Tollfree1996: 201) mentions the insensitivity of Australian phoneticians to this feature in their own speech, and also reports that fricated /t/ does not show any signs of spreading, as a recent innovation might. On the basis of these observations, it seems likely that Australian English fricated /t/ has simply gone unnoticed by other researchers of Australian English. On the evidence in the recordings, it appears that these forms existed in Melbourne English female speech almost 40 years before they were first recognised in modern phonetic studies. Ohala (Reference Ohala, Joseph and Janda2003) comments that native speakers often seem less aware of allophonic variation than non-native speakers, and practical phonetics teaching highlights the effort required to hear phonetic patterns accurately and consistently. Collins & Mees (Reference Collins and Mees1996) suggest on the basis of an analysis of late 19th century and early 20th century recordings that glottalisation patterns in British English may have a longer pedigree than is usually accepted, and the same may be true of pre-aspirated plosives in northern British English speech given some descriptions such as apparent [mɪ k] for milk in Ellis (Reference Ellis1889: 542).
Further work is also required to establish the sociolinguistic significance of fricated /t/ in Australian English. As mentioned in the introduction, the feature is exploited in the television series ‘Kath and Kim’ to comic effect. Here an exaggerated form of fricated /t/ is used by two female characters, Prue and Trude, who have higher socioeconomic status than other characters. A detailed study of fricated /t/ based on a sample stratified by age, sex and socioeconomic background and controlled for style is needed. However, based on the partial data available, a possible sociolinguistic profile for the feature can be posited (cf. Loakes & McDougall Reference Loakes and McDougall2007, and forthcoming). In Loakes & McDougall's study university-educated young adult male speakers from Melbourne fricated /t/ very rarely in spontaneous speech, whereas the data in the present study produced by private (fee-paying) school- and university-educated female speakers from Melbourne reveal a very high usage of the variant in read speech. Further, Tollfree (Reference Tollfree2001) observed /t/ frication to be more frequent for teenaged speakers of middle than of lower socioeconomic background, and in citation as opposed to conversational speech. So it may be that fricated /t/ is predominantly used by female speakers of higher socioeconomic backgrounds, and less preferred by male speakers and speakers from lower socioeconomic backgrounds. The feature may also be more frequently used in formal styles of speech. Further research is also needed to assess the regional distribution of fricated /t/ in Australian English; while Tollfree, Loakes & McDougall and the present study report occurrence of the feature for speakers from Melbourne and surrounding rural areas, recall that Ingram (Reference Ingram1989) does not report /t/ frication in the speech of teenagers from Brisbane.
Docherty, Hay & Walker (Reference Docherty, Hay and Walker2006) report the presence of a fricated realisation of /t/ in New Zealand English. Further research is required to determine to what extent the New Zealand fricated /t/ resembles fricated /t/ in Irish and Australian English, and whether it might be an offshoot of the Australian English phenomenon or a parallel development.
The results of the present study also highlight the problems of prejudging the nature of a process. Kirchner (Reference Kirchner2001, Reference Kirchner, Hayes, Kirchner and Steriade2004) excludes from consideration as lenition any processes which have sibilant fricatives as an output. According to Kirchner (Reference Kirchner, Hayes, Kirchner and Steriade2004: 316), sibilant fricative outputs always derive from affricated plosives. There are a number of problems with this proposal, not least the many and varied phonetic definitions of sibilance, its relationship to the feature [strident], and its application to different fricatives. For example, for Ladefoged & Maddieson (Reference Ladefoged and Maddieson1996: 180) /f/ cannot be sibilant, for Kirchner (Reference Kirchner, Hayes, Kirchner and Steriade2004: 316) /f/ is non-sibilant but [+strident], and for Utman & Blumstein (Reference Utman and Blumstein1994) /f/ is [+strident] in Ewe, but not in American English. There is also the problem that stops at some places of articulation, e.g. laminal dentialveolar, or in some contexts, e.g. before high front vowels, always show some degree of affrication, leading to the possibility of Kirchner's lenition applying to fricated /t/ in a low vowel context, but not to fricated /t/ in a high vowel context in the same language.
This study contains no direct data on plosive affrication in Australian English, but the results suggest caution is required in characterising phonological processes on the basis of imperfectly understood concepts such as sibilance. In terms of duration, the fricated /t/ is clearly non-sibilant as defined by Kirchner (Reference Kirchner2001, Reference Kirchner, Hayes, Kirchner and Steriade2004). In terms of spectral characteristics and amplitude, the similarity of fricated /t/ and /ʃ/ suggests that fricated /t/ could be as sibilant/strident as /ʃ/. Perceptually, similarity of fricated /t/ to sibilant /ʃ/ is suggested by the orthographic representation 〈sh〉, but remains to be demonstrated empirically.
6 Conclusion
The present research indicates that Australian English fricated /t/ is spectrally similar to /ʃ/, a relationship which suggests that any robust contrast between the two sounds may be maintained using non-spectral cues. Future work will address the role of various phonetic variables in perceptually distinguishing fricated /t/ and /ʃ/ in Australian English and possible systemic adaptations to the emergence of fricated /t/. Further work is required to establish the sociolinguistic significance of fricated /t/ in Australian English, and its presence in recordings from the 1960s must be explored in more detail. The similarity to slit-/t/ in Irish English must be further assessed in the light of data on frication of /t/ from more languages (e.g. Newfoundland English, Florentine Italian) but the existing data leave open the possibility that fricated /t/ in Australian English could perhaps result from Irish English influence. The precise details of articulation, frication rates in casual speech, and effects due to vowel quality and prosodic domain also remain to be investigated.
Acknowledgements
The authors are grateful to the participants, who gave freely of their time for this study, and to Deborah Loakes for helpful discussion, for alerting us to the ‘Kath and Kim’ examples, and for directing us towards the Mitchell & Delbridge database. Insightful comments were also gratefully received from John Esling and John Ingram, and two anonymous reviewers. Any mistakes remain our own. Thanks are due to the British Academy for funding a Postdoctoral Fellowship to the first author.