I. INTRODUCTION
Cellular solids can be defined as materials with a volume fraction of porosity higher than 70%. They have been known in their natural form for a very long time (trabecular bone, wood, cork, sponges, wools…). The structure of these highly porous solids is characterized by the presence of porous cells, hence their name, surrounded by a network of solid-phase. These cells can be open or closed and their dimensions can span over several orders of magnitude, from nanometers to centimeters. The specific properties of natural cellular solids are such that they are used for a very long time in special applications where these properties are required (lightweight beams and structural parts, insulators, filters, absorbers…). Their microstructure has widely inspired engineers to produce highly porous engineering solids such as wool (glass or rock wool e.g.,) and foam (metal, polymer and ceramic foams). Over the last 20 years, interest in these materials has grown. They have numerous interesting properties qualifying them as multifunctional materials.Reference Gibson and Ashby1,Reference Maire2 Thanks to their low relative density and good mechanical properties, they can be used as lightweight sandwich cores. Their high fracture strain, together with their damaging behavior when compressed, induces a large energy absorption capacity for packaging applications and shock absorbers. Their low thermal and acoustic conductivity is interesting for heat and sound insulation. The tailored high volume fraction of open porosity favors their use as filters and bone substitutes.
However, the highly porous nature of cellular solids induces experimental difficulties in terms of 2D characterization. Different morphological parameters, such as density distribution and cell and pore size, are difficult to measure because of sample preparation problems. Nondestructive 3D images can help us to overcome this difficulty, explaining why x-ray computed tomography (XRCT) has recently become a widely used technique to study cellular materials. X-ray tomography aims at obtaining 3D images of the samples. The technique being nondestructive, it is also possible to follow the microstructure of cellular materials during in situ mechanical tests, which in turn gives us information on deformation, damage and fracture behavior. Different in situ mechanical tests have been developed so farReference Buffière, Maire, Adrien, Masse and Boller3: compression, tension, fatigue, hydrostatic pressure, double torsion… The availability of 3D images of cellular materials also allows the numerical calculation of their mechanical properties through finite element (FE) modeling. Specific approaches have been developed in the last 20 years to calculate the average elastic modulus and stress concentrations during loading of cellular materials. Combined with in situ testing, a comparison of experimental and modeled behavior is now possible.
This review will present the most recent articles dealing with cellular solids studied by x-ray tomography and FE modeling.
II. X-RAY TOMOGRAPHY APPLIED TO CELLULAR SOLIDS
A. Principle of XRCT
The principle of XRCT has been described in many reviews.Reference Baruchel, Buffière, Maire, Merle and Peix4,Reference Stock5 It is derived from x-ray radiography where an x-ray beam is sent through a sample and the attenuation through the sample is measured by an appropriate detector. In XRCT, this sample rotates along an axis and a radiograph is taken for different angular positions of the sample. Reconstruction software uses all of these radiographs to recalculate a 3D image from all the 2D projections. As postprocessing, it is possible by using image analysis software to visualize slices of the sample or a 3D image.
A standard laboratory tomograph allows the acquisition of good quality images with a minimum resolution of 1 µm. Such setups are available commercially. Tomographs based on a synchrotron source are also available. These are more powerful and allow a better resolution.
Tomography is able to provide 3D images of all types of cellular solids. The following sections present different examples of cellular solids observed by XRCT, reproduced from recent publications. These examples are classified regarding the nature of their solid phase.
B. Examples of cellular polymers
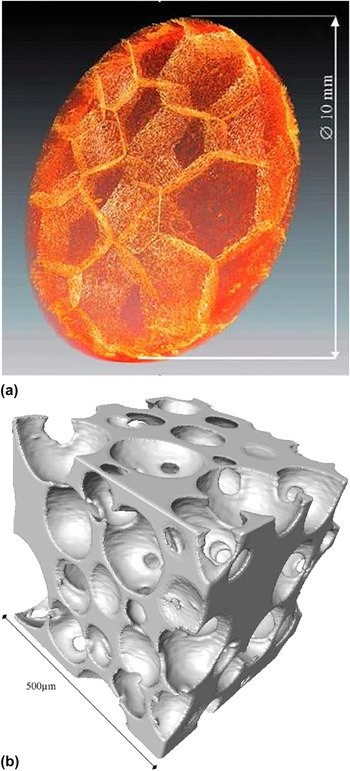
Polymeric foams were the first developed cellular solids. Their large energy absorption capacity enables us to use them for packaging or for protection against shock (such as helmets). This explains the large number of recent studies on the compressive behavior of this type of foam: PVC,Reference Fischer, Lim, Handge and Altstdt6 polyurethane,Reference Youssef, Maire and Gaertner7 and polypropyleneReference Viot, Bernard and Plougonven8 (see Fig. 1 for 3D renderings of these materials). McDonald et al.Reference McDonald, Dedreuil-Monet, Yao, Alderson and Withers9 also studied the tensile behavior of polyurethane foam during an in situ tensile test. Polymer foams are also widely used as templates to process ceramic or metal foamsReference Burteau, N'Guyen, Bartout, Forest, Bienvenu, Saberi and Nauman10 as illustrated in the next section.
X-ray tomography image of (a) polypropylene foamReference Viot, Bernard and Plougonven8 and (b) polyurethane foam.Reference Youssef, Maire and Gaertner7

C. Examples of cellular ceramics
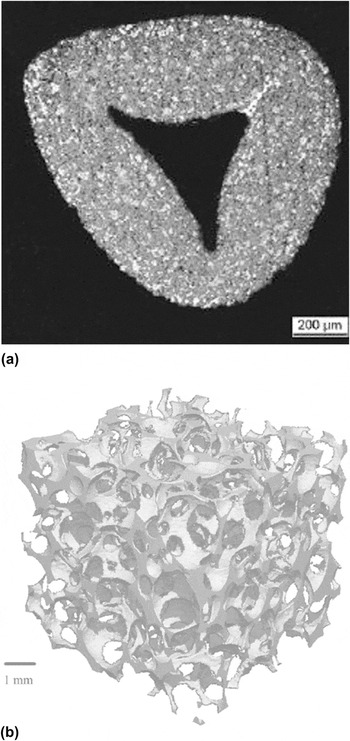
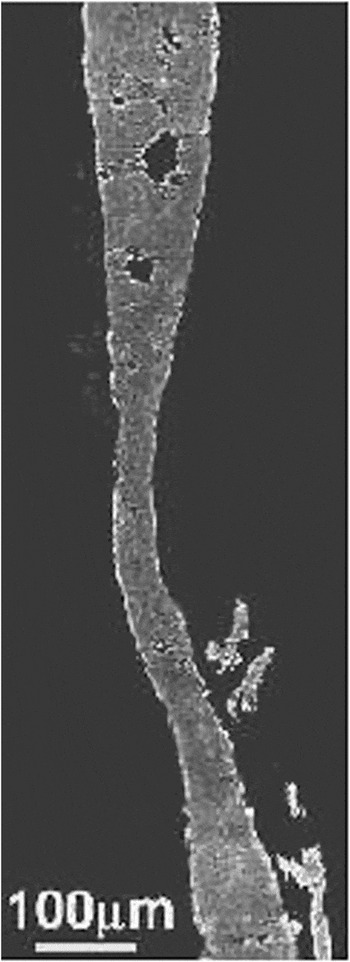
Cellular ceramics are used in a wide range of applications: filters, solid oxide fuel cells, construction materials (cellular concrete plasterboards), biomaterials. Some authors used XRCT to characterize the morphology of the samplesReference Maire, Colombo, Adrien, Babout and Biasetto11,Reference Zeschky, Goetz-Neuhoeffer, Neubauer, Jason Lo, Kummer, Scheffler and Greil12 or their fracture processes under loadReference Meille, Lombardi, Chevalier and Montanaro13–Reference Zhang, Ferreira, Olhero, Courtois, Maire, Zhang and Rauhe15 (Fig. 2). Many publications deal with bone substitutes: XRCT is used to compare their mechanical properties with bones,Reference Lacroix, Chateau, Ginebra and Planell16 or to follow the interaction between bone substitutes and natural bones.Reference Renghini, Giuliani, Mazzoni, Brun, Larsson, Baino and Vitale-Brovarone17,Reference Okanoue, Ikeuchi, Takemasa, Tani, Matsumoto, Sakamoto and Nakasu18 Figure 2(a) shows an example of a solid strut in SiC foamReference D'Angelo, Ortona and Colombo14 produced by coating a polymer cellular template with the ceramic slurry. During the sintering step at high temperature, the polymer precursor subsequently burns and then disappears, leading to the observed hollow strut structure.
XRCT images of: (a) a cross-section of a SiC foam strutReference D'Angelo, Ortona and Colombo14 and (b) a cellular ceramic containing amorphous silica and quartz created from a polymer.Reference Zeschky, Goetz-Neuhoeffer, Neubauer, Jason Lo, Kummer, Scheffler and Greil12

D. Examples of cellular metals
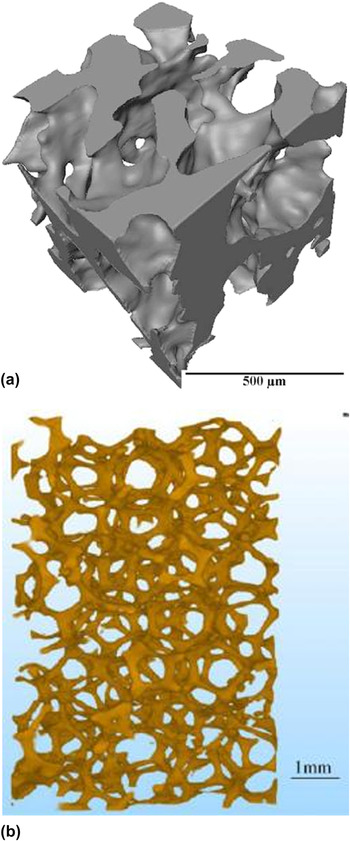
Metal foams are a relatively recent class of cellular solids. As polymeric foams, their lightness and energy absorption capacity is extremely interesting but they can be used at higher temperatures. Moreover, cellular metals are stronger compared to cellular polymers and tougher compared to cellular ceramics. This combination of properties is very interesting in load-bearing applications (sandwich cores), or in applications that require shock absorption (automobile, helmet, packaging, and cushion). Several authors have thus investigated the mechanical behavior of aluminum alloy foams because of their set of interesting properties: low weight, high strength, ductility, corrosion resistance, and recyclability.Reference Gioux, McCormack and Gibson19–Reference Veyhl, Belova, Murch, Oschner and Fiedler22 More recently, metallic materials based on other metals (copper alloy,Reference Guillén, Zhang, Tozzi, Orhndorf, Christ and Tong23 nickel,Reference Burteau, N'Guyen, Bartout, Forest, Bienvenu, Saberi and Nauman10 steel,Reference Caty, Maire, Youssef and Bouchet24,Reference Lhuissier, Salvo and Bréchet25 and titaniumReference Singh, Lee, Lindley, Kohlhauser, Hellmich, Bram, Imwinkelried and Dashwood26) have also been investigated (Fig. 3).
X-ray tomography image of (a) Ti foamReference Singh, Lee, Lindley, Kohlhauser, Hellmich, Bram, Imwinkelried and Dashwood26 and (b) CuSn12Ni2 foam.Reference Guillén, Zhang, Tozzi, Orhndorf, Christ and Tong23

E. Image processing
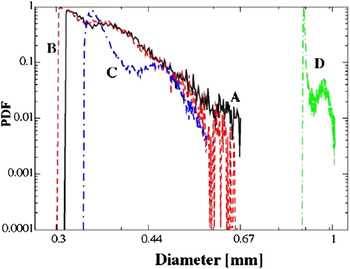
X-ray tomography is an appropriate method to observe the mesostructure of a sample, i.e., the architecture of the cell walls and the distribution between the materials and the pores. The images can also be quantitatively used to calculate important descriptors of the cellular structure: tortuosity of the different phases, density distribution, pores, and cell size distribution.Reference Maire, Colombo, Adrien, Babout and Biasetto11,Reference Saadatfar, Garcia-Moreno, Hutzler, Sheppard, Knackestedt, Banhart and Weaire27,Reference Van Bael, Kerckhofs, Moesen, Pyka, Schrooten and Kruth28 Figure 4 shows an example of pore size distribution measured on porous metals. Tariq et al.Reference Tariq, Haswell, Lee and McComb29 determined the pore distribution in cellular ceramic catalysts thanks to tomographic images and compared it with mercury porosimetry measurements. Numerous softwares (ImageJ, IMorph30) have been developed to improve 3D image analysis. For example, Morpho+Reference Brabant, Vlassenbroeck, De Witte, Cnudde, Boone, Dewanckele and Van Hoorebeke31 has recently been improved to enable rapid analysis of larger datasets.
Cell size distribution of four metal foams in log–normal scale (samples A and B: AlSi7 samples, C sample: AlSi11 sample and D sample: Zn sample).Reference Saadatfar, Garcia-Moreno, Hutzler, Sheppard, Knackestedt, Banhart and Weaire27

One advantage of XRCT is its ability to characterize large samples, but this implies a limitation in the size resolution. To overcome this limitation, local tomography allows the imaging of the solid phase of cellular materials at a higher magnification. In this mode, the sample is placed near the x-ray source. Only a small part in the middle of the sample is irradiated by the x-rays. As a consequence, finer details of the microstructure in the material can be observed, as illustrated in Fig. 5 showing the 2 mm diameter central cylinder inside a 6 mm diameter cylindrical sampleReference Youssef, Maire and Gaertner7 of aluminum foamReference Toda, Kobayashi, Niimoni, Ohgaki, Kobayashi, Kuroda, Akahori, Uesugi, Makii and Aruga32 with microstructural details.
Tomographic slice of a cell wall of aluminum foam imaged using the local tomography mode (the sample is larger than the detector field of view). Fine details of the microstructure as microporesReference Toda, Kobayashi, Niimoni, Ohgaki, Kobayashi, Kuroda, Akahori, Uesugi, Makii and Aruga32 are shown.

F. In situ experiments
Some rigs can be mounted on the rotation stage of tomographs to perform mechanical tests during scanning. The aim is to scan the sample when it undergoes a deformation. The test can be done in situ (the rig is placed in the tomograph) or ex situ (the sample is deformed outside the tomograph and observed after loading).
The images obtained during the deformation of the samples enable us to better understand the damage mechanisms occurring inside the material.
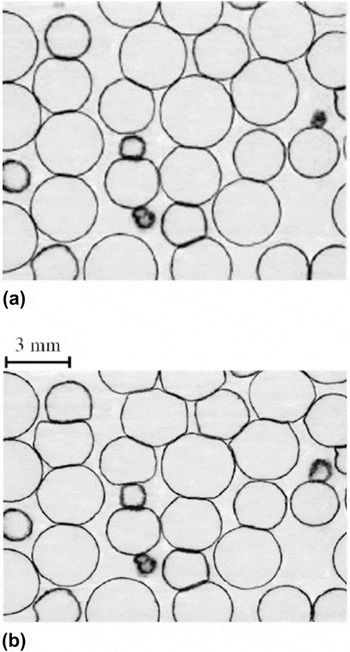
Figure 6 shows the results obtained in an ex situ compression test on a hollow sphere stainless steel structure.Reference Caty, Maire, Youssef and Bouchet24 The image of the deformed sample allows observing the bending of the sphere walls during compression. In Fig. 7,Reference McDonald, Dedreuil-Monet, Yao, Alderson and Withers9 the alignment of the struts of polyurethane foam along the loading direction during a tensile test can be observed.
Slices from tomographic images of a hollow sphere stainless steel structure: (a) Initial state and (b) after the application of a 9% strain during a compression test.Reference Caty, Maire, Youssef and Bouchet24

Tomographic images of PU foam during an in situ tensile test.Reference McDonald, Dedreuil-Monet, Yao, Alderson and Withers9

III. FE MODELING
Different analytical models have been developed to analyze the mechanical behavior of cellular solids, the most famous being by Gibson and Ashby.Reference Gibson and Ashby1 These analytical approaches link the mechanical properties of the cellular solids to its relative density. For instance in the case of the Young's modulus, the following relation is proposed:
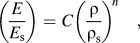 $$\left( {{E \over {E_{\rm{s}} }}} \right) = C\left( {{{\rm{\rho }} \over {{\rm{\rho }}_{\rm{s}} }}} \right)^{n} \quad,$$
where ρ and ρs are the density of the cellular solid and the dense constituting material, respectively, E and E s are the Young’s moduli of the cellular solid and the dense constituting material, respectively. C and n are constants and depend on the architecture of the material, i.e., open or closed cells. Similar relationships exist for the evolution of fracture stress or fracture toughness of cellular solids versus relative density.
This relationship is based on the hypothesis that deformation in cellular materials is governed by bending. It is mostly used for periodic structures. However, the microstructure of cellular materials is usually not perfectly periodic. This can lead to the limitation of the predictive capacity of the above models. Several approaches have been developed so far to take into account the presence of imperfections on the mechanical behavior of cellular solidsReference Grenestedt and Tanaka33,Reference Fleck, Olurin, Chen and Ashby34 using periodic structures and adding randomly dispersed imperfections. Nevertheless, such methods are not specific to a given structure and the representation simplifies the actual microstructure of cellular materials.
Numerical models and particularly FE models adapted to XRCT volumes allow the mechanical simulation of a material taking into account a realistic microstructure.
Before modeling, the tomographic image has to be binarized. The binarized image is then used to create the FE mesh. The type of element selected is important to obtain an accurate model. In studies, three types of elements have been used to date:
– cubic elements,
– beams or wall elements,
– tetrahedral elements.
A. Meshing with cubic elements
This method consists of translating one voxel into an element of the mesh. The algorithm is very simple to implement and no further complex meshing steps are needed.
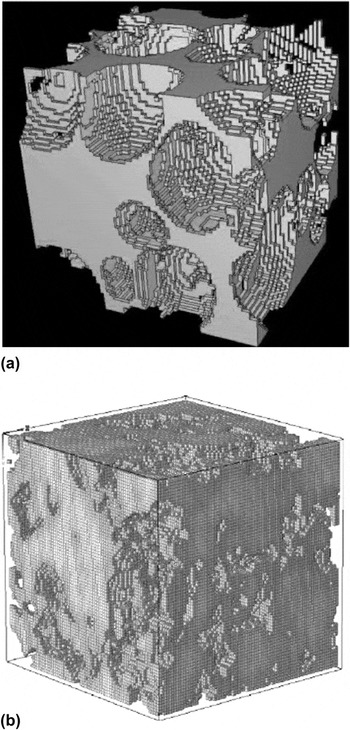
This meshing technique has been used on polymer, metal or ceramic cellular materials, mainly for the determination of Young’s modulus and Poisson’s ratio,Reference Saadatfar, Arns, Knackstedt and Senden37–Reference Arns, Knackstedt, Val Pinczewski and Garboczi39 but also for the determination of the thermal conductivity of metal hollow sphere structuresReference Fiedler, Hosseini, Belova, Murch and Ochsner40 or the influence of the oxidation of the nuclear graphite on mechanical properties (Fig. 8).Reference Berre, Fok, Mummery, Ali, Marsden, Marrow and Neighbour36
The main drawback of this meshing technique is the difficulty in representing the details of the sample microstructure. The cubic elements do not correctly follow the curved surface. Different solutions exist to: increase mesh resolution (but the calculation becomes very long) as was done by Maire et al.Reference Maire, Fazekas, Salvo, Dendievel, Youssef, Cloetens and Létang35 or Berre et al.Reference Berre, Fok, Mummery, Ali, Marsden, Marrow and Neighbour36 (Fig. 8), adapt a FE program to mesh large samplesReference Roberts and Garboczi41 or use the fast Fourier transform technique.Reference Escoda, Willot, Jeulin, Sanahuja and Toulemonde42 This technique is now being increasingly replaced by meshing with noncubic elements, allowing reduced computation time.
(a) Voxel mesh of PU foamReference Maire, Fazekas, Salvo, Dendievel, Youssef, Cloetens and Létang35 and (b) voxel mesh of an oxidized nuclear graphite.Reference Berre, Fok, Mummery, Ali, Marsden, Marrow and Neighbour36

B. Meshing with beams and shells
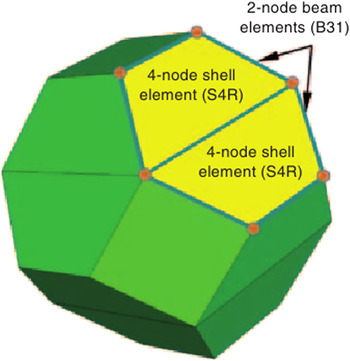
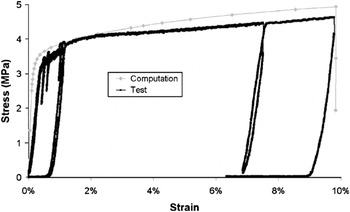
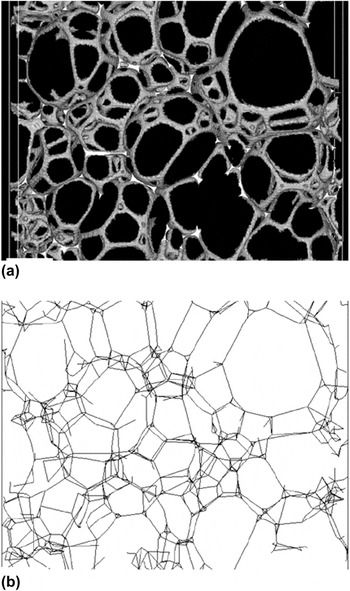
Meshing with beam or shell elements can be used for actual structures from tomographic images provided that the microstructure is composed of such a structural element. This is, for instance, very often the case in polymer foams. Different examples exist in studies: PVC foamsReference Fischer, Lim, Handge and Altstdt6 (see Fig. 9) and stainless steel hollow sphere structures.Reference Caty, Maire, Youssef and Bouchet24 For the latter, the structure was scanned in its initial state and this scan was used to create a FE mesh. A compression test until a strain of 9% was performed. Experimental stresses and strains were recorded during the test. The FE mesh was made with shell elements. An elastoplastic law was used to model the behavior of the solid material constituting the shells. The parameters were adjusted to take into account the pores in the steel walls: Young’s modulus of 150 GPa and Poisson ratio of 0.3. The Young’s modulus was determined using a rule of mixture with the porosity in the walls. The plastic behavior of the solid walls was modeled by couples of values for strains and stresses: [(0, 140 MPa), (0.035, 153.4 MPa), (0.1, 187 MPa), and (0.2, 210 MPa)]. These values were chosen because they enable a good fit between simulation and experiments. However standard 304 steel is probably a bit harder than this. Figure 10 presents two stress strain curves: the experimental one corresponding to the compression test and the simulated one corresponding to the result of the FE modeling. One can observe a good correlation between experiments and modeling especially for yield stress and plastic behavior. But, the Young’s modulus of the structure was overestimated. The thickness of the shell elements used was attributed based on the actual thickness of the solid-phase measured in the initial tomographic image. However, in some cases, the beam elements cannot correctly represent the structure of the materialReference Elliott, Windle, Hobdell, Eeckhaut, Oldman, Ludwig, Boller, Cloetens and Baruchel43 because the beams are not well adapted to the strut geometry (Fig. 11).
Schematic representation of the meshing of a PVC foam cell with beam and shell.Reference Fischer, Lim, Handge and Altstdt6

Comparison between experiments and modeling in the compression stress strain curve for a stainless steel hollow sphere structure.Reference Caty, Maire, Youssef and Bouchet24

(a) Tomographic image of a section of polyurethane foam and (b) corresponding model made with struts and nodes.Reference Elliott, Windle, Hobdell, Eeckhaut, Oldman, Ludwig, Boller, Cloetens and Baruchel43

C. Meshing with tetrahedral elements
The third meshing technique category describes more precisely the actual structure of cellular materials. This is the most currently favored method in studies.
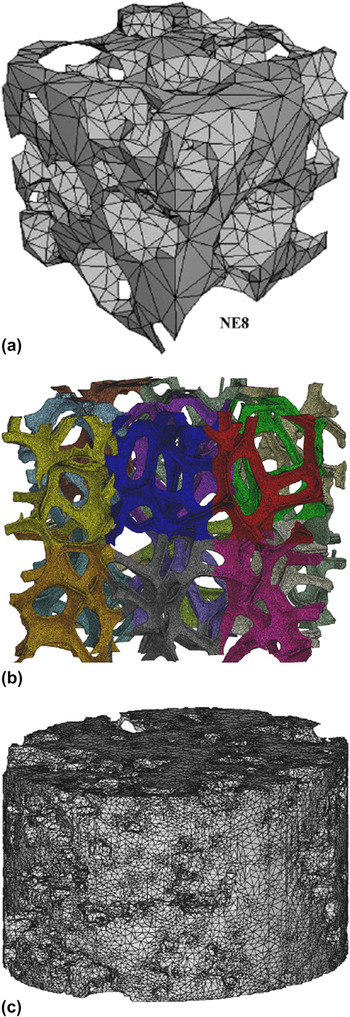
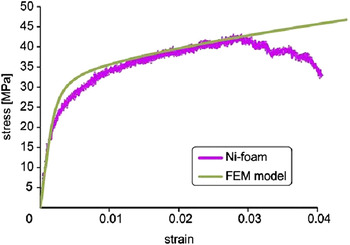
Meshing with tetrahedral elements is carried out in two steps. First, a 2D mesh with triangular surface elements is created from the binarized tomographic image. The triangular external faces of the elements can approximate the actual surface of the cellular solids as determined by XRCT. Then, a 3D mesh is built with a tetrahedral filling the interior of the previously defined surface. One of the first studies of tetrahedral meshing was carried out on trabecular bonesReference Ulrich, Van Rietbergen, Weinans and Rüegsegger44: a comparison was drawn between meshing with voxel and tetrahedra. For some samples, the authors obtained more accurate results with tetrahedral meshing. Examples of tetrahedral meshes created for the three types of cellular solids are presented in Fig. 12: the precise reproduction of the microstructure is particularly highlighted in Fig. 12(b). As is already presented in Fig. 10, the results obtained with tetrahedral meshes are generally close to the experimental ones (Fig. 13). A nickel foam sample was first scanned. A tensile test was performed with a displacement rate of 0.1 mm/min. The FE mesh was built from the tomographic image. An elastoplastic law was chosen to model the behavior of nickel. The parameters used in the model were: Young’s modulus of 170 GPa, Poisson ratio of 0.3 and yield strength of 25 MPa. The curves presented in Fig. 13 are the experimental data from the tensile test and the simulated data created from the FE modeling.Reference Michailidis, Stergioudi, Omar, Papadopoulos and Tsipas21 In this example, the Young’s modulus is the same in the experiment and in the FE calculation.
Tetrahedral mesh of (a) polyurethane foam,Reference Youssef, Maire and Gaertner7 (b) nickel foam,Reference Burteau, N'Guyen, Bartout, Forest, Bienvenu, Saberi and Nauman10 and (c) a porous β tricalcium phosphate.Reference Lacroix, Chateau, Ginebra and Planell16

Experimental and simulated stress strain curves for a tensile test of nickel foam.Reference Michailidis, Stergioudi, Omar, Papadopoulos and Tsipas21

In terms of macroscopic properties, Vesenjak et al.Reference Vesenjak, Veyhl and Fiedler45 used the method to demonstrate the influence of the anisotropy and the strain rate sensitivity on the compressive behavior of aluminum foam. It should be noticed that the use of this technique seems to overestimate the elastic stiffness (see again Fig. 10) and the authors sometimes have to use an unrealistic elastic behavior of the solid phase to fit their experimental elastic regime. For example, Marcadon et al.Reference Marcadon, Davoine, Passilly, Boivin, Popoff, Rafray and Kruch46 obtained overestimated Young’s modulus as compared to experimental ones for the compressive behavior of Inconel hollow tube stacking. No clear explanation has yet been suggested as to why the models are stiffer than the experimental materials.
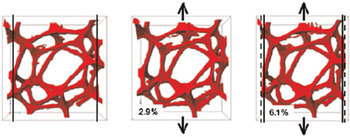
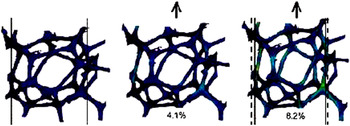
In terms of local behavior, the prediction is, on the contrary, always very useful to analyze the weak points in the microstructure. Figure 14 presents the simulated stress contours of a representative cell of polyurethane foam before and after a tensile test.Reference McDonald, Dedreuil-Monet, Yao, Alderson and Withers9 The polyurethane foam was scanned in its initial state and underwent an in situ tensile test. The FE mesh was built from the tomographic image. The polyurethane behavior was considered to be elastic with Young’s modulus of 45 MPa and Poisson ratio of 0.3. The FE modeling simulates correctly the elongation of the cell in the tensile direction and the contraction in the transverse direction. The zones of stress concentrations can also be predicted (visible in brighter blue and green colors on the figure).
FE modeling based on tomographic images. The images represent the stress contours for: (left) initial state, (middle) after a strain of 4.1%, and (right) after a strain of 8.2%.Reference McDonald, Dedreuil-Monet, Yao, Alderson and Withers9

In cellular ceramics, as with other cellular materials, FE models of XRCT images are used to estimate the average Young’s modulus and the stress concentrations within the solid phase.Reference D'Angelo, Ortona and Colombo14,Reference Zhang, Ferreira, Olhero, Courtois, Maire, Zhang and Rauhe15,Reference Arns, Knackstedt, Val Pinczewski and Garboczi39 FE simulation shows stress concentration logically in the thinnest sections of the solid walls or struts.Reference D'Angelo, Ortona and Colombo14 Some limitations are noted in these results, especially in some cases, where the estimated Young’s modulus is no more accurate than the analytical solutions, such as the Gibson and Ashby model. In the study carried out by Zhang et al.,Reference Zhang, Ferreira, Olhero, Courtois, Maire, Zhang and Rauhe15 this finding was related to the volume size, too small in some cases to be representative of the whole microstructure of a material. As a rule of thumb, a representative volume element of a cellular material should at least encompass 10 cells across the three main directions of the solid.
Bone substitutes are an important application for cellular materials and have been the subject of recent work on property evaluation using XRCT and FE analyses. Such materials are often more dense than the cellular ceramics mentioned above, with a relative density varying from 50 to 75%. The FE calculation shows in this case the important influence of the pore distribution on the stress distribution,Reference Lacroix, Chateau, Ginebra and Planell16 local agglomeration of pores leading to higher stress concentration in the solid phase.
Another issue that confirms the potential of FE simulation based on XRCT volumes is the coupling between mechanical stimuli and the biological response of cellular materials in vivo. It has been largely shown that compressive stresses enhance cell differentiation and extracellular matrix synthesis, essential factors for new bone growth. Computation of fluid flow in the porous space of a cellular matrix is also of importance.Reference Sandino, Planell and Lacroix47
D. Other types of meshing
Other techniques are possible to mesh a cellular solid, such as mixed meshes made of different elements.Reference Veyhl, Belova, Murch, Oschner and Fiedler22 First, the solid surface is meshed with triangles. Then, a volume mesh is created with hexahedra. Tetrahedra and pentahedra are added where hexahedra cannot fill the overall volume. The comparison of different meshes for metallic foam shows that mixed meshes give the most accurate results.
The discrete element method was also used to simulate the mechanical behavior of entangled materials (made of fibers).Reference Barbier, Dendievel and Rodney48 This technique consists of discretizing the fibers in segments. It then oversimplifies the description of the material but is useful when friction problems are prevalent in the material to be analyzed, and the computation time can sometimes be reduced compared to the FE analysis.
IV. CONCLUSION
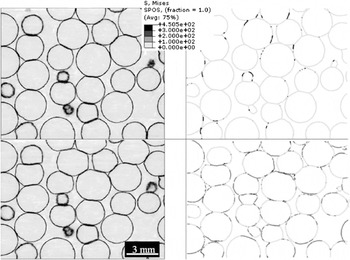
X-ray tomography has become one of the preferred methods of characterization for studying cellular solids. The 3D images enable us to obtain a good description of the architecture of the foams. Applied at different scales, using either a standard mode of acquisition or local tomography, the technique permits a more precise description of the material microstructure. XRCT images are often used to create meshes for FE modeling. Every class of cellular solids (polymer, ceramic, and metal) has been investigated using this combination of techniques. The subsequent FE calculations lead to results in terms of macroscopic properties that can be compared with standard mechanical tests. Many studies have reported that the prediction of this type of calculation is in good agreement with the macroscopic response of the material, although they seem to lead to a systematic overestimation of the elastic properties (Fig. 10). XRCT also allows us to follow the deformation processes of cellular solids when coupled with an in situ mechanical test. In this case, the FE prediction of the local stress concentration can also highlight the regions where stresses localize. This has been shown many times to be in good agreement with the local damage mechanism observed during in situ mechanical tests. This is illustrated by Fig. 15. This combination of techniques is then ready to be applied as a predictive tool. Either based on a tomographic image, or on a numerically generated microstructure, FE models can help engineers to select the best microstructure for a given property (then for a given application) without the need for a complex experimental investigation based on mechanical tests. This could be particularly useful in the case of multiaxial loading, which is not easy to carry out experimentally.
Comparison between (a) two tomographic slices of the stainless steel hollow sphere structure during a compression test and (b) the corresponding slices numerically simulated by FE calculation. The upper figures correspond to a strain of 0.02% and the bottom figures correspond to a strain of 9%.Reference Caty, Maire, Youssef and Bouchet24 The explanations about the modeling conditions are given in Sec. III. B.