1. Introduction
Open clusters (OCs) are stellar systems consisting of dozens to thousands of stars, formed from the same molecular cloud and remaining gravitationally bound (Lada and Lada Reference Lada and Lada2003). While many OCs appear as isolated systems, a subset exists in multiple clusters sharing common spatial and dynamical properties. These so-called primordial OC groups are particularly valuable because they can probe hierarchical star formation, where stars and clusters form across nested scales rather than in a single monolithic collapse.
Previous studies have hinted at such OC groups in both the Milky Way and external galaxies (Efremov and Elmegreen Reference Efremov and Elmegreen1998; Kounkel Reference Kounkel2020; Groß schedl et al. 2021; Swiggum et al. Reference Swiggum, Alves, Benjamin, Ratzenböck, Miret-Roig, Großschedl, Meingast, Goodman, Konietzka, Zucker, Hunt and Reffert2024). In the Magellanic Clouds, for instance, correlated cluster pairs and groups have been linked to large-scale star-forming complexes. In particular, the advent of Gaia has enabled the systematic identification of OCs with homogeneous and precise astrometry, revealing new cluster groups and offering the chance to study their dynamics in detail. However, the physical drivers behind their formation and dispersal remain uncertain.
One key open question concerns the role of stellar feedback. Supernovae (SNe) and stellar winds can compress the interstellar medium, triggering subsequent cluster formation. Identifying feedback signatures in OC groups provides direct evidence for this process. In particular, age gradients relative to SN sites and the presence of associated pulsars offer a way to test this scenario.
In this work, we report the discovery of four new primordial OC groups based on Gaia DR3. We analyze their dynamical evolution with N-body simulations and investigate evidence for feedback-driven sequential star formation.
2. Data and Methods
We selected 36 OCs from Gaia-based catalogs, (Cantat-Gaudin et al. 2020; Qin et al. 2023) within 700 pc of the Sun. Member stars were taken from Gaia DR3 to derive cluster parameters. Isochrone fitting with PARSEC models was used to estimate ages and masses.
Groups were defined using three criteria: spatial separation
 $\lt$
100 pc, velocity difference
 $\lt$
10 km s
 $^{-1}$
, and age spread
 $\lt$
30 Myr. These thresholds ensure that the clusters are both spatially and temporally correlated.
The dynamical evolution of each group was modeled with the N-body simulation code PeTar (Wang et al. Reference Wang, Iwasawa, Nitadori and Makino2020) under the Galactic potential using MWPotential2014 (Bovy Reference Bovy2015). We reconstructed their past compact configurations and projected future dispersal.
To search for feedback signatures, we examined a correlation between cluster ages and distances from predicted SN explosion sites. In addition, pulsar trajectories from the ATNF catalog were traced backward to test associations with the groups.
3. Star Formation Triggered by Supernovae
We identify four primordial OC groups: G1 (six clusters), G2 (eight), G3 (three), and G4 (three), as illustrated in Fig. 1. Their coherent spatial and kinematic properties indicate that they likely originated from the same GMC, N-body simulations show that all groups were more compact in the past and have been gradually dispersing, with G1 beginning expansion about 27 Myr ago and the other groups within the last 10 Myr. This suggests that they are dynamically evolving into independent clusters.
Spatial distribution of OC groups in l-b. The blue, green, red, and orange dots represent OC groups G1, G2, G3, and G4, respectively. The black arrows denote the tangential velocity of the member OC, with arrow lengths scaled proportionally according to the red reference arrow located in the upper right corner of the figure.

Figure 1 Long description
Panel: A scatter plot representing the spatial distribution of open cluster (OC) groups in galactic coordinates. The horizontal axis represents the galactic longitude (l) in degrees, ranging from 50 to 90 degrees. The vertical axis represents the galactic latitude (b) in degrees, ranging from -5 to 20 degrees. The plot includes several hundred data points, with blue, green, red, and orange dots representing different OC groups. Black arrows denote the tangential velocity of the member OC, with arrow lengths scaled proportionally according to a red reference arrow in the upper right corner indicating 6.00 km/s. Notable clusters are labeled with specific identifiers such as ASCC 105, OCSN 152, UPK 101, and others. The plot shows distinct clusters of data points with varying densities and directions of tangential velocities.
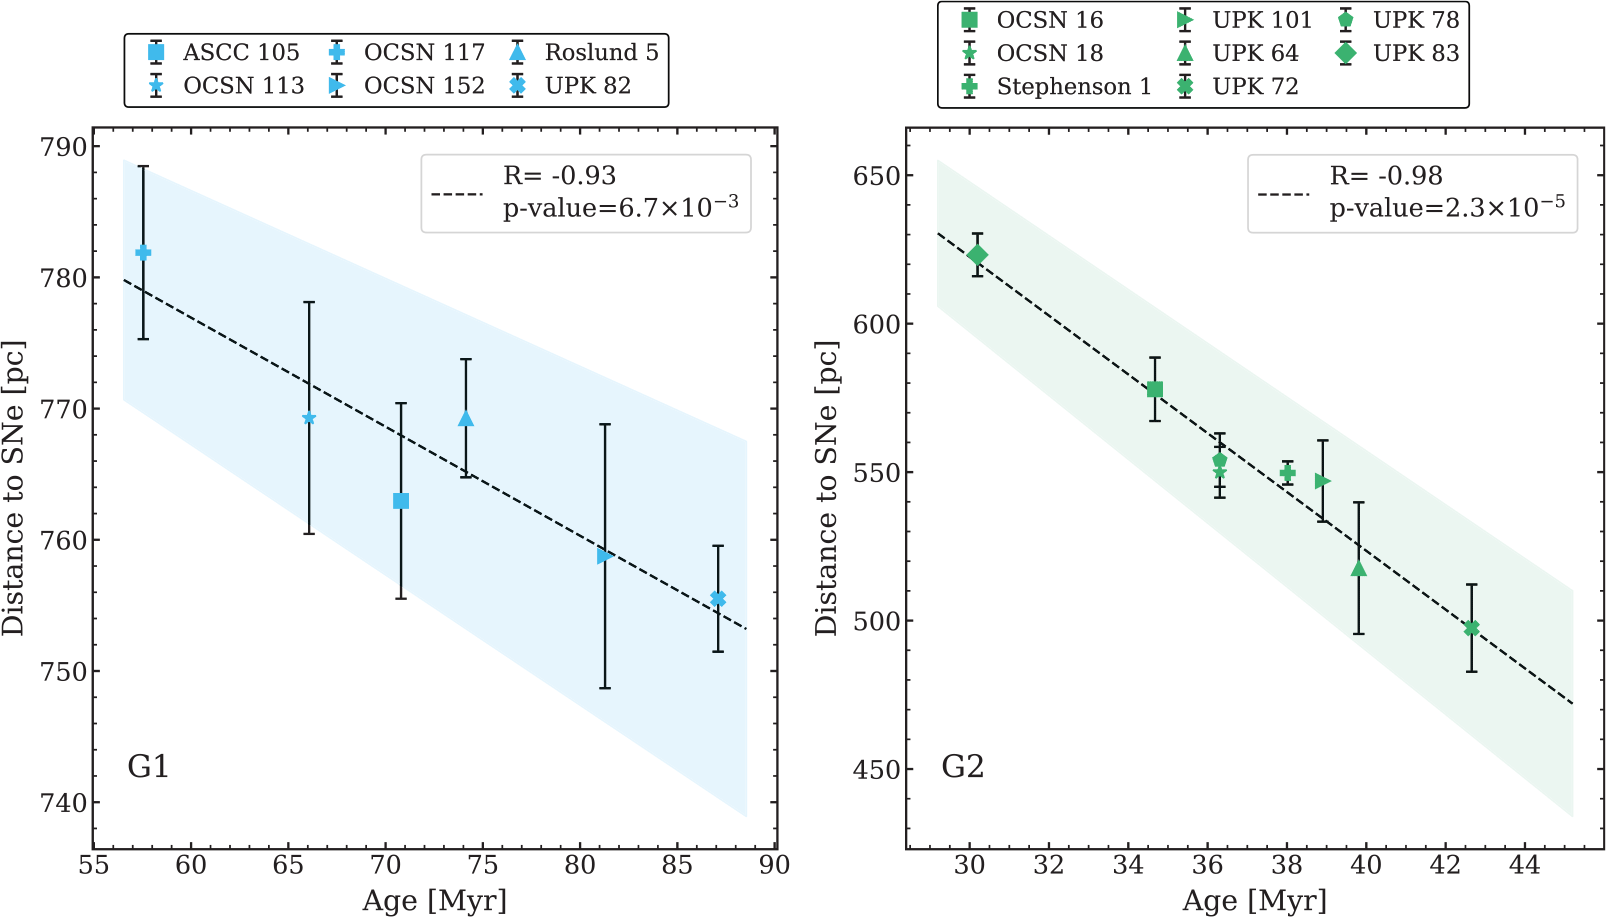
In addition to their dynamical evolution, G1 and G2 exhibit arc-like and ring-shaped morphologies together with clear age-distance gradients relative to the predicted supernova explosion sites, as shown in Figs. 2 and 3.
Relative 3D spatial distribution of potential SN explosion regions. The cyan dots represent the relative distribution of member OCs at the birth time of the oldest clusters within each OC group. The contour colors represent levels of the correlation coefficient, as shown in the color bar.

OC ages as a function of the separation to the most probable SN explosion sites. The black dash lines represent the best-fitted linear relation. The left panel shows the result for G1, while the right panel displays the result for G2. The shaded area represents the range of the standard error for the estimated slope. Error bars are computed using error propagation, based on the standard error of the spatial distribution of the member stars.

Figure 3 Long description
Panel G1: A scatter plot shows the relationship between age and distance to supernova explosions. The x-axis represents age in million years (Myr) ranging from 55 to 90, and the y-axis represents distance to supernova explosions in parsecs (pc) ranging from 740 to 790. Data points are marked with blue symbols representing different clusters. A dashed line indicates the best-fitted linear relation, with a correlation coefficient of -0.93 and a p-value of 6.7x10^-3. The shaded area represents the range of the standard error for the estimated slope. Error bars are present for each data point. Panel G2: Another scatter plot shows the relationship between age and distance to supernova explosions. The x-axis represents age in million years (Myr) ranging from 30 to 44, and the y-axis represents distance to supernova explosions in parsecs (pc) ranging from 450 to 650. Data points are marked with green symbols representing different clusters. A dashed line indicates the best-fitted linear relation, with a correlation coefficient of -0.98 and a p-value of 2.3x10^-5. The shaded area represents the range of the standard error for the estimated slope. Error bars are present for each data point.
In addition to their dynamical evolution, G1 and G2 display arc-like and ring morphologies and clear age-distance gradients relative to predicted supernova explosion sites. These features are consistent with feedback-triggered sequential star formation. Pulsar trajectory analysis further supports this scenario, as 3 pulsars near G1 and 26 near G2 are consistent with birthplaces at the explosion sites. Taken together, these results demonstrate that feedback from massive stars and supernovae has likely played a crucial role in shaping the formation and evolution of these OC groups, providing direct evidence for hierarchical star formation in the Galactic disk.
4. Summary
We report the discovery of four new primordial OC groups in the Milky Way. Their kinematics and age coherence confirm a common GMC origin. N-body simulations reveal ongoing dispersal, and evidence from SN-driven age gradients and pulsar associations supports feedback-triggered sequential star formation for G1 and G2. This work demonstrates the central role of stellar feedback in shaping the hierarchical formation and evolution of OC groups in the Galactic disk.