Introduction
For the past 40 years, Gordon (Reference Gordon1954) and Hardin (Reference Hardin1968) have provided the philosophical foundation for government natural-resource management. Under conditions of open access, people have an incentive to overexploit and to underinvest in their resources. Hardin's (1968) tragedy of the commons suggested that people, without resource privatization or government regulation, will invariably engage in the unsustainable and inefficient use of forests, fish, wildlife, water resources, grazing lands, clean air, clean water and other common pool resources (CPRs).
However, another method of managing CPRs that allows for the sole or co-management of resources by local users is gaining currency among natural-resource managers. Communities can effectively manage CPRs over the long-term with the right organizational structure, rules, resource context and participation (Ostrom Reference Ostrom1990). Participatory or community-based resource management regimes are one of the most conspicuous and accepted paradigms to come out of conservation science in the past 20 years (Kapoor Reference Kapoor2001). Between 455 000 and 520 000 local environmental collective action groups have formed since the early 1990s to manage watersheds, agriculture, wildlife, fisheries and forests (Pretty Reference Pretty2003). Local voluntary institutions may be effective vehicles for promoting social action and, specifically in the context of this paper, environmental stewardship. Social capital may help explain successful local resource management.
Theorists describe social capital as networks, norms and trust (Putnam Reference Putnam1995). There is no consensus on the appropriate measurement of social capital, and while some apply the concept in terms of networks among individuals or groups (Dasgupta Reference Dasgupta2002; Fafchamps Reference Fafchamps2004), others use measurements of trust, norms, values and attitudes to understand associational membership, which is treated both as a source and an indicator of social capital (Brehm & Rahn Reference Brehm and Rahn1997; Knack & Keefer Reference Knack and Keefer1997; Narayan & Pritchett Reference Narayan and Pritchett1999). Fukuyama (Reference Fukuyama2000) has suggested two methods to measure social capital in terms of associational membership; the number of civic groups in society (Putnam Reference Putnam1993, Reference Putnam2000) or levels of participation in voluntary organizations (Esman & Uphoff Reference Esman and Uphoff1984). I used the latter method in this study.
Social capital improves the likelihood of cooperation among people by lowering the transaction costs of cooperation, easing the flow of information, improving trust and increasing the enforceability of cooperative agreements (Ostrom Reference Ostrom1990). A series of World Bank studies examined the contribution of social capital to environmental management. In Bangladesh, measures of trust and norms of reciprocity were associated with successful voluntary solid waste management systems (Pargal et al. Reference Pargal, Mainul and Gilligan1999). Several indicators of social capital in Indonesian villages were correlated with the effectiveness of community-based water projects (Isham & Kähkönen Reference Isham and Kähkönen1999). In Indian villages, social capital was associated with superior watershed conservation (Krishna & Uphoff Reference Krishna and Uphoff1999). Aside from the World Bank initiative, Landcare membership and conservation training as proxies for social capital in 313 households were positively associated with the adoption of contour barriers to prevent soil erosion in Philippine households (Cramb Reference Cramb2006). Most of these studies, however, were based on relatively small sample sizes or related social capital to social action rather than environmental outcomes (Cramb Reference Cramb2006). These studies did not address the question of how social capital was generated.
There are several possibilities for the determinants of social capital. Interpersonal trust is often used as a predictor of or proxy for social capital (Muller & Seligson Reference Muller and Seligson1994). Confidence in government can improve interpersonal trust and therefore associational participation (Rosenstone & Hansen Reference Rosenstone and Hansen1993; Brady et al. Reference Brady, Verba and Scholzman1995; Brehm & Rahn Reference Brehm and Rahn1997). Similarly, conflicts between formal and informal institutions can impede collective action (Dhesi Reference Dhesi2000; Lyon Reference Lyon2000). Education (Rosenstone & Hansen Reference Rosenstone and Hansen1993; Brehm & Rahn Reference Brehm and Rahn1997) and income (Luzar & Diagne Reference Luzar and Diagne1999; Putnam Reference Putnam2000; Bekkers Reference Bekkers2005) are commonly used to explain civic engagement. Newspapers and other means of information sharing allow the formation and strengthening of voluntary associations (de Tocqueville Reference de Tocqueville, Mansfield and Winthrop2000). Group size is thought to be important in explaining the likelihood of collective action (Ostrom Reference Ostrom1990). Ethnic heterogeneity might lower participation (Alesina & La Ferrara Reference Alesina and La Ferrara2000). Increasing urbanization may partly explain the decline of social capital (Putnam Reference Putnam2000). Finally, a more transient population is less likely to make an investment in associational membership.
This paper meets the call for a shift in how social capital and local environment management are studied. Agrawal (Reference Agrawal2001) suggested the methodological approach be changed from reliance on case studies (Berkes Reference Berkes1989; Ostrom Reference Ostrom1990; Bowles & Gintis Reference Bowles and Gintis2002; Plummer & FitzGibbon Reference Plummer and FitzGibbon2006), where causality is difficult to establish, to larger samples and statistical analyses. While large-sample cross-country analyses exist (La Peyre et al. Reference La Peyre, Mendelssohn, Reams, Templet and Grace2001; Meyer et al. Reference Meyer, van Kooten and Wang2003; Grafton & Knowles Reference Grafton and Knowles2004), they have more difficulty controlling for confounding factors than local-level analyses. Social capital is more often treated as an independent rather than dependent variable (Foley & Edwards Reference Foley and Edwards1999). Few studies examine both the production and consequences of social capital. Without a holistic approach, it is difficult to specify the mechanisms by which social capital is thought to work. This paper addresses these shortcomings.
Using a relatively large sample of lake associations with similar goals in a common legal and political environment, this paper examines: (1) the determinants of participation in lake associations, a proxy for social capital, using mail survey, water clarity and biophysical data; and (2) the effects of social capital on the variation in water clarity among lakes. The sample size facilitates the use of multivariate regression, while a homogeneous population of organizations makes it easier to differentiate effects of social capital from other group and contextual effects. Lake associations are similar to home owners’ associations with the exception that a lake delineates not only membership, but also associational purpose and function. Lake associations are voluntary collective-action organizations that face myriad coordination and cooperation problems. Each lake resident has a choice of contributing to various environmental public goods including clean water. Each lake resident, however, also faces the temptation to reap the benefits of these public goods without incurring the costs of provision (‘free-riding’).
Water clarity is a good variable for examining the effects of social capital as it is easily quantifiable, its measurement is standardized, and there is a long history of using modelling to predict water clarity (Vollenweider Reference Vollenweider1968; Dillion & Rigler Reference Dillion and Rigler1975). Predictions are typically based on land-use and physical characteristics of the watershed, shoreline development, lake morphometry, lake biophysical characteristics and precipitation. By controlling for these factors, I evaluated whether participation rates among lake associations were correlated with lake water clarity. Participation was defined as the percentage of lake-front property owners belonging to the lake association, however participation was not necessarily a measure of the quality or level of activity of association members. The hypothesis was that greater participation (i.e. social capital) lowers the transaction costs associated with various strategies and reinforces behavioural norms, making cooperative efforts more likely to improve water clarity.
Methods
I administered a mail survey to lake associations in Minnesota during the summer of 2002. Prior to the initial mailing, the questionnaire was pre-tested by the leadership of two lake associations and minor modifications were made to improve its clarity. The survey was mailed to the presidents and/or boards of 533 lake associations. Two weeks after the initial mailing, a reminder post card was sent. Finally, telephone calls to non-respondents were made in conjunction with a second mailing. I received responses from 245 lake associations, a response rate of 46%. The actual response rate was likely much greater since not all of the 533 lake associations could be verified as still operational.
The questionnaire was divided into three main sections: (1) information about the lake association including participation rates, budget, rules, organizational structure, primary functions, activities, concerns and major accomplishments; (2) information about the lake including shoreline characteristics, public boat accesses, zoning classification and development densities; and (3) information about the lake association's members including recreational preferences and reasons for non-participation by non-members. This was not a household-level survey and thus demographic, behavioural or attitudinal data on individual members were not collected.
Complementing the mail survey data were lake morphological data, including area (LAKEAREA) and mean depth (AVGDEP) obtained from the Minnesota Department of Natural Resources (MN DNR). The MN DNR also provided geographical information systems (GIS) data on watershed area (WSAREA) and watershed land-use. The land-use categories of agriculture (LUCULT), forest (LUFOREST), urban (LUURBAN), brush (LUBRUSH) and bog (LUBOG) represented the percentage of land in the lake's watershed in each category. Land-use data were derived from raster-based LandSat land cover data derived from 30-m resolution thematic mapper satellite imagery. GIS soil quality data were used to derive four categories for septic system suitability from highly to poorly suitable (SEPSUIT, SEPLIMIT, SEPSEVERE and SEPWET). I calculated average monthly precipitation data for July (RAIN0701) and August (RAIN0801) of 2001 by averaging precipitation data obtained from the Minnesota Climatology Working Group (URL http://climate.umn.edu/) for the county in which the lake is located.
The number of permanent and seasonal homes close to each lake was derived using Census 2000 block level GIS data obtained from the US Census Bureau. These data were used to construct variables for all homes (ALLHOMES), the number of seasonal homes (SEASONAL) and the percentage of seasonal homes (SEASPERC). Census block data were included if the block was within 91.5m of the lake boundary. While this method of assessing development density is not perfect because the census blocks are of irregular shape (for example some blocks were scarcely contained in the 91.5-m perimeter, but data from the entire block were included), it was seen as more reliable than survey data since many respondents stated that their estimates for housing were only approximate. Furthermore, housing development, even beyond the shoreline, can contribute significantly to lake eutrophication.
Census data were also used to assess the educational and income levels of the population surrounding each lake. The variable EDUBA was the percentage of the population in census block groups near the lake who had attained a four-year degree or greater. INCMORE75 was the percentage of the population with household incomes > US $75 000. The block group data were insufficiently refined to determine the educational and income levels of only those residents with lakeshore property.
Two water quality variables were used. Secchi disc data were obtained from the Environmental Protection Agency's (US EPA) STORET database which is comprised of data from the Minnesota Pollution Control Agency (MPCA) and Minnesota's Citizen Lake-Monitoring Program (CLMP). Secchi depth is a measure of water clarity and is related to the nutrient content of the lake. It is measured by lowering a white and black disc into the water and determining at what depth the disc is no longer visible. Readings for July (JUL01SEC) and August (AUG01SEC) of 2001 were averaged on a monthly basis. Many lake characteristics, including water clarity, are best measured in the summer when lakes are thermally stratified. This period usually runs from July to early September (Stemberger & Lazorchak Reference Stemberger and Lazorchak1994). Also, government agencies and citizen groups often do more water quality testing during this time. The SWIMRANK variable was a swimmable use ranking of one to four used by the MPCA in their 305(b) report to Congress in fulfilment of provisions in the Clean Water Act. The classification is based on water transparency, frequency of algal blooms and phosphorus concentration. Full support (category 1) signifies that few algal blooms and high water transparency exist to support swimming throughout the summer. Marginal-support (category 2) means that swimming is still fully supported, but that the lake is near its phosphorus limit and may see algal blooms and decreased transparency. Lakes supporting partial support (category 3) are subject to algal blooms and low transparency, which may limit swimming for a significant portion of the summer, and no support (category 4) means that lake conditions limit swimming for most of the summer. COMQUIET and COMBOAT were derived variables based on the frequency of use of the lake for non-motorized recreational activities (i.e. kayaking, canoeing, hiking and sailing) and motorized activities (i.e. boating and jet skiing), respectively.
The first set of regressions identified the determinants of lake association participation rates (PARTICIP). The second set of regressions determined the effect of lake association participation rates, as a proxy for social capital, on lake water clarity (JUL01SEC).
Variance inflation factors for each independent variable in every regression were less than 3.3, indicating little problem with multicollinearity. I checked for heteroskedasticity in the data by applying the Park test to 5 independent variables with wide disparities between the smallest and largest observed values, LAKEAREA, ALLHOMES, SEASONAL, WSAREA, and BUDMEMB, the per caput budget for each lake association. The t-statistics for each Park test provided no evidence of heteroskedasticity. Finally, each of the regression models was run using mean Secchi readings and precipitation for July and August. Because there were no major quantitative or qualitative differences between regressions, only the regression results based on the July means are reported.
The problem of simultaneity is commonly encountered when modelling the effects of social capital (Durlauf Reference Durlauf2007). In the two structural equations developed in this paper, it is likely that increased participation in a lake association might improve water clarity. Better water clarity in turn, might increase participation rates since the payoff for participation is higher and less effort is required. Thus, the variable PARTICIP is possibly endogenous and correlated with the error term in violation of ordinary least squares (OLS) assumptions. Similarly, variables associated with water clarity like SWIMRANK and JUL01SEC are possibly endogenous in the structural equation with PARTICIP as the dependent variable. Endogeneity can cause biased and inconsistent estimates.
The Hausman-Wu test provides an indication of endogeneity. I used the test to determine the endogeneity of PARTICIP and JUL01SEC. For example, for PARTICIP, the water clarity variable, SECJUL01, was regressed on possible predictor variables including PARTICIP where α0 is the regression constant, α 1 is the coefficient on PARTICP and e 1 is the error term.

I then regressed PARTICIP on the predicted values for SECJUL01, e 1, and all other explanatory variables. Below, β 0 is the regression constant, β 1 is the coefficient on SECJUL01, β 2 is the coefficient on error term from Eq. 1 and e 2 is the error term.

The null hypothesis is that β2 is not statistically different from zero and therefore we can assume that PARTICIP is exogenous in the first equation. If, however, β2 is significant, then the null can be rejected, providing evidence that PARTICIP is endogenous because it is correlated with e 1.
When I suspected endogeneity, I ran a two-stage least squares (2SLS) regression. In order to determine the effects of the endogenous variables, I solved the simultaneous equations for the endogenous variables. This resulted in two ‘reduced form’ equations which were then used as instrument variables in 2SLS regressions. The instruments were then independent of the error terms and did not violate OLS assumptions.
Beginning with the two structural equations below, where X and Y represent independent variables in addition to JUL01SEC and PARTICIP,


I substituted Eq. 3 into Eq. 4 and vice versa to obtain the reduced forms Eqs 5 and 6.


The ‘reduced form’ equations were then simplified, where πI and λI are the reduced form equation coefficients and v 1 and v 2 the new error terms.


Each dependent endogenous variable was regressed on all exogenous variables in the system. The predicted values for PARTICIP and JUL01SEC from Eqs 7 and 8 were then used as instruments for the original endogenous variables. A 2SLS regression as described above was run for both sets of regressions.
Results
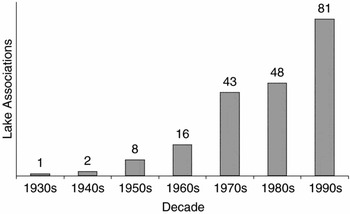
On average, the lake associations were formed 24 years ago (Appendix 1, see Supplementary material at URL http://www.ncl.ac.uk/icef/EC_Supplement.htm). The number of lake associations increased in Minnesota (Fig. 1), although these data do not include defunct lake associations and non-respondents and therefore caution is advised in inferring any explanations for this trend. The mean participation rate (PARTICIP) was 62% with a minimum of 3%, maximum of 100% and standard deviation of 23% (Appendix 1, see Supplementary material at URL http://www.ncl.ac.uk/icef/EC_Supplement.htm). The distribution of participation rates was normal, with a median of 61% and measures of skewness and kurtosis of −0.14 and −0.97, respectively. Only five lake associations had participation rates of 100%.
Number of lake associations in Minnesota founded by decade.

Water quality was seen as a very important issue for 98% of lake associations (Appendix 2, see Supplementary material at URL http://www.ncl.ac.uk/icef/EC_Supplement.htm). The questionnaire included a series of questions to determine the most important functions of lake associations (Appendix 3, see Supplementary material at URL http://www.ncl.ac.uk/icef/EC_Supplement.htm). Forty-seven per cent of lake associations said that environmental stewardship (FCNENV) was their primary concern, followed by 32% choosing education (FCNEDU). Social networking (FCNSOL), which presumably lends itself to building social capital or is indicative of social capital, was seen as a primary concern by only 7% of respondents. However, the boards and presidents of lake associations might have held views on the importance of each of these functions that differed from their members.
Several questions examined the organizational structure and characteristics of lake associations (Appendix 4, see Supplementary material at URL http://www.ncl.ac.uk/icef/EC_Supplement.htm). Only 2% of lake associations had the ability to enforce organizational rules (ENFORCE); of the few lake associations who did, a majority derived enforcement powers by the ability to tax residents due to the creation of special tax districts. Eighty-three per cent of lake associations monitored some water quality parameter (MONWQ), most commonly Secchi depth.
Lake associations were asked to comment on their major accomplishments. A short discussion of these responses provides some insights into the behavioural links between social capital and environmental outcomes in lake associations. The use of newsletters and social activities to educate, inform, establish common purposes and improve cooperation was common. A number of lake associations described their success in preventing residential and commercial development projects by lobbying local zoning boards. Others, using grants or member donations, purchased lakeshore and agricultural lands and provided incentives or negotiated contracts with upstream farmers to establish riparian buffers, install drain tiles or modify agricultural practices. Many lake associations, through membership voting, adopted non-binding resolutions to establish no-wake zones, ban personal water crafts, restrict the cutting of vegetation or encourage the repair of septic systems. As most lake associations had no real enforcement powers, voluntary compliance was encouraged through letter writing, newsletters and dialogue. Therefore, many stewardship activities required cooperation and receptivity to soft social sanctions.
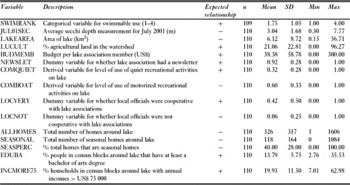
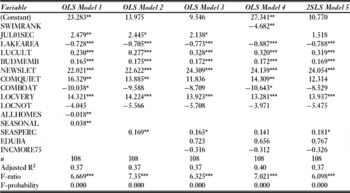
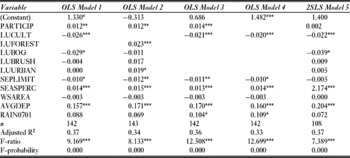
Several independent variables were used in each set of regressions (Tables 1 and 2). The overall fit of each estimated regression equation was significantly better (F-probabilities < 0.01) than an equation with coefficients equal to zero (Tables 3 and 4). The first set of OLS regressions adjusted R2 values ranged from 0.37 to 0.40 (Table 3, models 1–4). The effect of LAKEAREA on participation rates was consistently negative; an increase in the lake area of 1 km2 was associated with a decrease in participation of c. 0.77%. The relationship between SWIMRANK and PARTICIP was also negative. As swimmable use deteriorated by one category, participation in lake associations decreased by approximately 5% (model 4). Similarly, Secchi depth (JUL01SEC) was negatively associated with participation rates; a 1 m increase in Secchi depth was associated with a 2.4% increase in participation. Thus, both the water quality variables SWIMRANK and JUL01SEC (r = −0.62, p < 0.01) provided some positive correlation with participation and were included in this set of regressions, since the direction of causality was unknown. Because of the high correlation between these two variables, only one was used in each regression. Rural areas (LUCULT) were associated with higher participation rates. An increase in the proportion of agricultural land-use in the watershed by 10% was associated with a 2.9% increase in participation rates.
Participation as dependent variable: independent variables, descriptions, expected relationship and summary statistics.

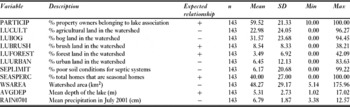
Water clarity as dependent variable: independent variables, expected relationship and summary statistics.

Regression coefficients for participation regressions (***p < 0.01, **p < 0.05, *p < 0.10).

Regression coefficients for water clarity regressions (***p < 0.01, **p < 0.05, *p < 0.10).

The first set of regressions also included several variables related to the characteristics of the lake association and lake residents. NEWSLET, a dummy variable indicating presence or absence of a newsletter, was always positively associated with participation rates; the presence of a newsletter was related to an increase in participation of 23% (Table 3). The amount of money budgeted per lake association member (BUDMEMB) was also positively related to participation rates; US $10 increase per member in the budget being associated with an increase in participation of about 1.7% (Table 3). An increased frequency of non-motorized activities (COMQUIET) was associated with increased participation rates, while the opposite was true with motorized recreation (COMBOATS) although the coefficients were not consistently significant (Table 3).
In all models, good relations with local officials (LOCVERY) were associated with increased levels of participation (Table 3). Housing types also affected participation rates. A larger number of all types of homes (ALLHOMES) was negatively associated with participation, while an increase in number (SEASONAL) or proportion (SEASPERC) of seasonal homes was associated with higher participation rates; a 10% increase in the proportion of seasonal homes was associated with an increase in participation of 1.6% (Table 3). Education (EDUBA) and income (INCMORE75) levels were not significant predictors.
The second set of regressions examined the effect of participation rates on lake water clarity (Table 4). Because the dominant land-uses in Minnesota are agriculture and forest, these two variables were highly correlated and therefore only one was included in each regression; otherwise the first two models are identical. Model 3 was more parsimonious and excluded bog, brush and urban land-use variables since these were not previously significant. Model 4 was identical to model 3 with the exception that PARTICIP was excluded. Model 5 was the 2SLS model. Adjusted R2 values ranged from 0.33 to 0.37. In each of the OLS models, PARTICIP was positively associated with water clarity; an increase in lake association participation of 10% being associated with an increase in Secchi depths of 0.13 m, a relatively small effect. Results for the other variables were as expected. Average lake depth (AVGDEP), the proportion of seasonal homes (SEASPERC), forested land-use (LUFOREST) were all positively associated with better water clarity, while agricultural land-use (LUCULT) and poor soil conditions (SEPLIMIT) were negatively associated (Table 4). In model 4, when PARTICIP was dropped from model 3, the overall fit of the model was reduced.
The Hausman-Wu test provided evidence that the independent variable PARTICIP in the water clarity equation was not endogenous (p = 0.157). However, the Hausman-Wu test for JUL01SEC as an independent variable in the participation equation provided evidence that JUL01SEC was endogenous (p < 0.01). This suggests that a causal relationship of participation on water quality was more likely than one of water quality on participation.
Even so, assuming a system of simultaneous equations and using the reduced forms as instrument variables in a 2SLS regression, PARTICIP was no longer a significant predictor of water clarity (Table 4, model 5). As in model 1 (Table 4), the coefficients for LUCULT, LUBOG, SEASPERC and AVGDEP were significant. Similarly, the coefficient on JUL01SEC was no longer significant in the 2SLS equation, explaining participation rates, although the coefficients for LAKEAREA, LUCULT, BUDMEMB, NEWSLET, LOCVERY and SEASPERC remained significant and of roughly the same magnitude (Table 3, model 5).
Discussion
The results of this study provided evidence of a small positive effect of social capital on successful environmental management. Lake associations with higher participation rates were associated with greater lake water clarity. As expected, land-use in the watershed, lake depth, development density and soil types were also correlated with water clarity. Participation in lake associations was in part determined by group size, recreational preferences, water quality, seasonality of lake residents, rural location, information sharing, budget levels and local government relations. However, assuming a system of simultaneous equations with some degree of endogeneity resulted in participation having no significant effect. The results of the 2SLS regressions are not surprising. The structural equation predicting participation rates demonstrated a relatively low goodness of fit and therefore provided a weak instrumental variable for social capital. A few factors known to be associated with social capital were either inadequately included or omitted from this study owing to the nature of the mail survey. Variables for education and income were based on coarse block-level census data, although BUDMEMB, which was positively associated with participation may be serving as a proxy for income if it is assumed that greater operating budgets are more likely in associations comprised of higher income members. Thus, better measures for income and education, in addition to data on residents’ age, race, gender, behaviour and attitudes might better explain the variation in participation rates and in turn provide a stronger instrumental variable in the 2SLS models.
Previous explanations for the production of social capital provide some context and understanding of the predictors of lake association participation. Formal and informal networks of working relations help build trust and social capital (Lyon Reference Lyon2000). For example, farmers who were more open to professional and non-professional contacts tended to participate in agricultural stewardship programmes (Mathijs Reference Mathijs2003). External recognition and relations seem to be important (Ostrom Reference Ostrom1990; Evans Reference Evans1996; Pretty Reference Pretty2003) and, in this study, good relations with local government officials were associated with higher levels of participation in lake associations. Good information about the resource and good communication among group members are positively correlated with increased participation (Ostrom Reference Ostrom1990; White & Runge Reference White and Runge1995; Luzar & Diagne Reference Luzar and Diagne1999). The positive role of an associational newsletter in lake associations corroborated these findings.
Analytical and empirical work suggests that smaller groups are more likely to engage in collective action than larger groups (Olson Reference Olson1982; Ostrom Reference Ostrom1990; Baland & Platteau Reference Baland and Platteau1996). This study further corroborates this, since lakes with smaller areas had greater participation rates and lakes with more homes nearby tended to have lower participation rates.
Putnam (Reference Putnam2000) cites increasing suburbanization as an explanation for declining social capital, and this study revealed higher participation rates were associated with more rural areas (i.e. areas with high proportions of agricultural land-use in the watershed).
Contrary to existing research, which suggests that institutional stability is associated with greater participation (Ostrom Reference Ostrom1990; Bardhan Reference Bardhan1993), lakes with higher seasonal residence saw greater participation. This might be explained by the fact that a majority of lake association meetings were conducted in the summer months when seasonal residents were present. It is also possible that seasonal residents returned year after year. Seasonal home use might also be serving as a proxy for income, which is often positively associated with social capital (Luzar & Diagne Reference Luzar and Diagne1999; Putnam Reference Putnam2000).
The variables COMQUIET and COMBOAT suggest that there is some relationship between recreational preferences and predilections for membership in voluntary organizations. This raises the question of whether a suite of individual attributes and preferences might reliably characterize people as the defectors and cooperators of game theorists or whether social and institutional context explain these differences (Corporation for National and Community Service 2007).
Conclusions
What then is the role of public policy in regards to social capital and environmental stewardship? Some theorists argue that social capital is an artefact of culture and state intervention only diminishes the role of culture in society and weakens social ties leading to less desirable outcomes (Fukuyama Reference Fukuyama2000). Others argue that the state, by correcting for externalities and providing for public goods, creates a stable and nurturing platform on which civil society can bloom. In this study, the ‘bonding’ social capital among relatively homogeneous members of lake associations seems complementary to the ‘bridging’ social capital between lake associations and local government. Fostering greater cooperation between lake associations and local government would seem to further each group's goals. However, even if an enabling state role is assumed, it is still not clear whether such investments are more cost effective than other strategies to mitigate declining water clarity, such as the adoption of alternative agricultural practices, tougher zoning laws or other government regulations.
Given the growing evidence of the role of social capital in local resource management including that presented here, the state would seem to have an interest in exploring these links in terms of research, experimental programmes and the monitoring of local resource user groups. This is especially true considering the increased devolution of resource management responsibilities to local user groups owing to budget pressures and changing management paradigms. Although rare, empirical work which uses large sample sizes, employs rigorous statistical analyses and provides explanations for both the determinants and effects of social capital can contribute to creating a unified theoretical framework of social capital and local resource management. Finally, to improve the external validity of research with rich local context, qualitative research will maintain an important role in relaxing various measurement constraints, explaining differences in social capital formation and defining the mechanisms by which social structures and group effects influence individual behaviour and therefore environmental outcomes.
ACKNOWLEDGEMENTS
The Minnesota Lakes Association (now Minnesota Waters) provided administrative and data collection support for this study. I thank the editors and two anonymous reviewers for their thoughtful and helpful comments.