


Introduction
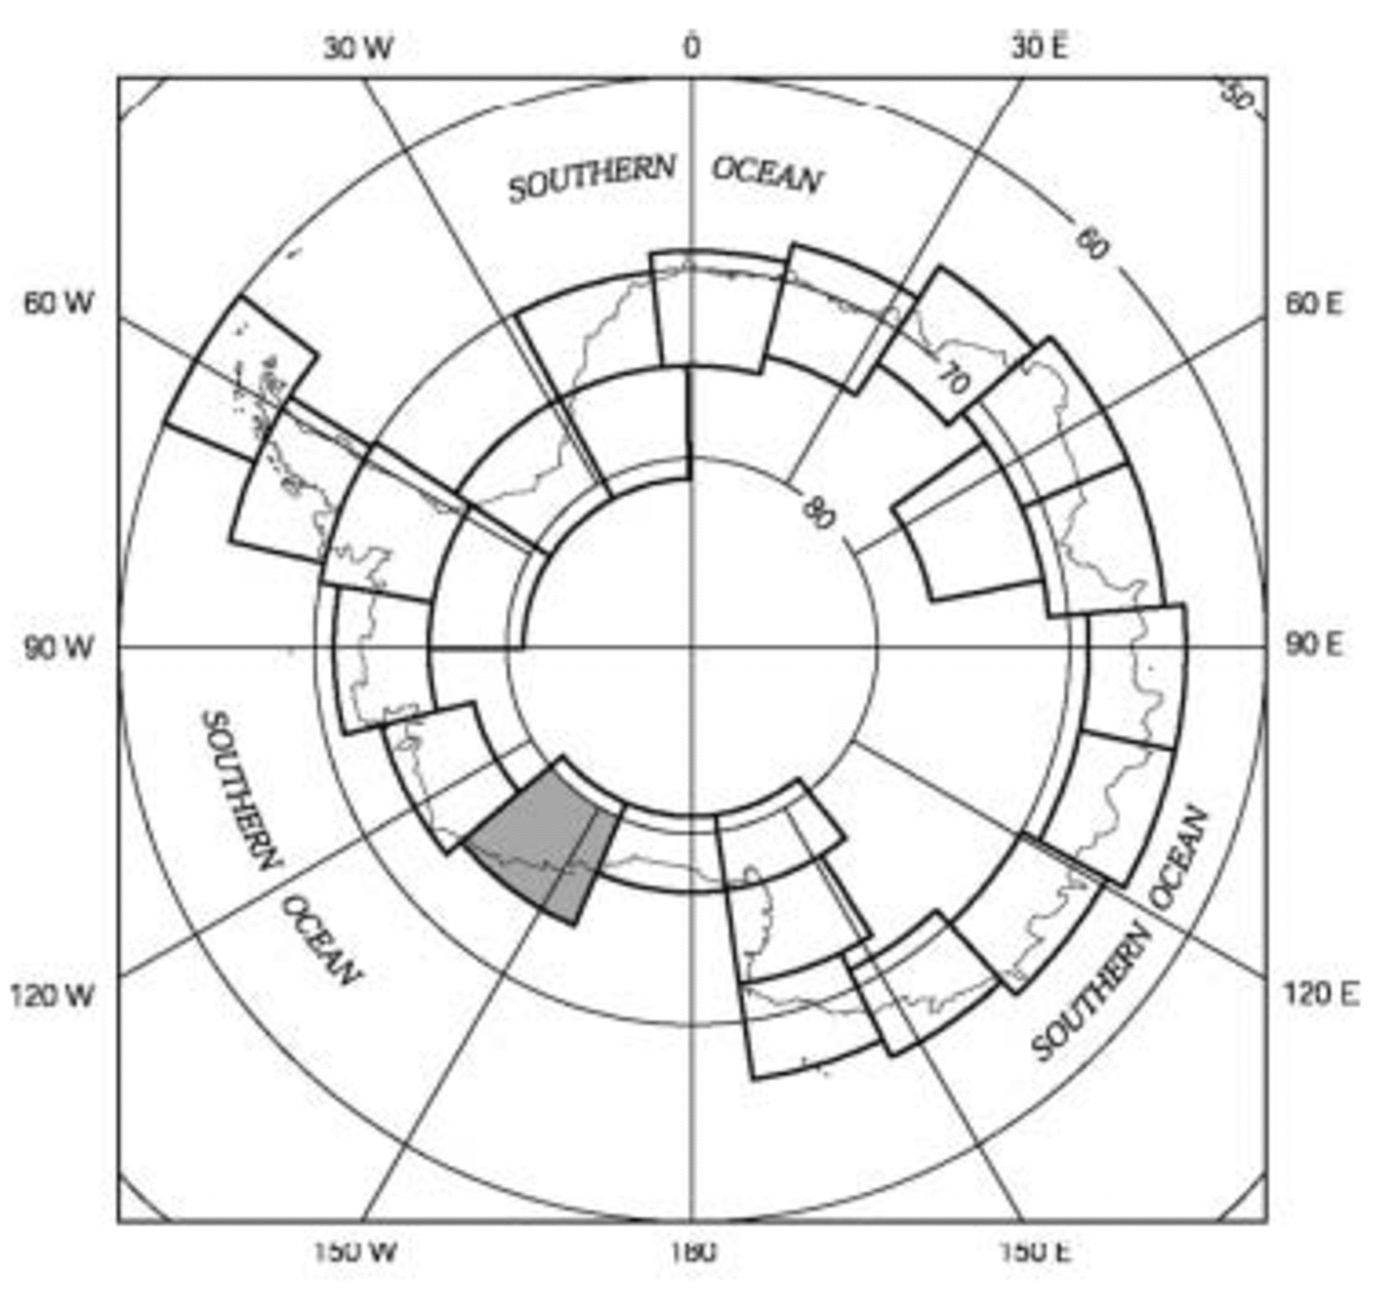
An archive of early 1970s Landsat 1, 2 and 3 Multispectral Scanner (MSS) images, Landsat 4 and 5 MSS and Thematic Mapper (TM) images, and RADARSAT images of Antarctica provided the impetus for carrying out a coastal-change and glaciological mapping project for a comprehensive analysis of the glaciological features of the coastal regions and changes in ice fronts of Antarctica during a 20–25 year time interval (Reference SwithinbankSwithinbank, 1988; Reference Williams and FerrignoWilliams and Ferrigno, 1988) and to prepare a series of 24 1 : 1 000 000 scale and 1 1 : 5 000 000 scale US Geological Survey (USGS) Geologic Investigations Series Maps (‘I-Maps’) (Reference Williams, Ferrigno, Swithinbank, Lucchitta and SeekinsWilliams and others, 1995; Reference Williams and FerrignoWilliams and Ferrigno, 1998; Reference Ferrigno, Williams and ThomsonFerrigno and others, 2002) in both paper and digital format. The Saunders Coast area map is one of this series (Reference swithinbank, Williams, Ferrigno, Foley, Hallam and RosanovaSwithinbank and others, 2003) (Fig. 1).
Index map of the planned 24 1 : 1 000 000 scale coastal-change and glaciological maps of Antarctica, with the Saunders Coast area map highlighted.
Objectives
The coastal-change and glaciological mapping project has five objectives, listed as follows:
1. to determine coastline changes that have occurred during the past three decades
2. to define, from the analysis of Landsat and RADARSAT images, the glaciological characteristics of the coastline of Antarctica
3. to determine velocities of outlet glaciers, ice streams and ice shelves, and the position of the grounding line from analyses of Landsat images and other sources
4. to compile a comprehensive inventory of named and unnamed outlet glaciers and ice streams in Antarctica that are mappable from Landsat images or from ancillary sources
5. to compile a 1 : 5 000 000 scale map of Antarctica derived from the 24 1 : 1 000 000 scale maps. Each 1 : 1 000 000 scale map extends to the southernmost nunatak within each map area or to the southernmost extent of Landsat images (about 81.5˚ S lat.).
Sources
The early Landsat scenes of this map cover the years 1972– 76, and the later images range from 1986 to 1990. One Landsat 7 Enhanced Thematic Mapper Plus (ETM+) image, dated 12 December 1999, was used to fill in coverage of the coast on the western edge of the map. A mosaic of Landsat TM scenes dating from December 1984 to February 1990 produced by the Flagstaff Science Center, AZ, USA, to map the Siple Coast area and to study grounding lines (Reference FerrignoFerrigno and others, 1994) is used for Bindschadler and MacAyeal Ice Streams (former Ice Streams D and E respectively). The 125 m picture element (pixel) resolution RADARSAT image mosaic of Antarctica was used both as a base for correct geographic position and geometric rectification of digitized Landsat imagery and as an additional source of coastal-change data. The RADARSAT image mosaic is composed of data recorded from 9 September to 20 October 1997 (Reference JezekJezek, 1998). The 1997 RADARSAT image mosaic was obtained from the Ohio State University’s Byrd Polar Research Center (BPRC).
Methodology
The compilation of the Saunders Coast area map required identification of optimum Landsat MSS or TM images for two time intervals (early 1970s and middle 1980s to early 1990s), manual annotation of glaciological features, and positional control of mapped features. To produce the most accurate, high-resolution printed maps and digital databases of the coastal regions of Antarctica, it was decided to georegister the imagery and annotations to the 1997 RADARSAT mosaic of Antarctica produced by the BPRC for the most geometrically accurate base. A benefit was that the RADARSAT mosaic was compiled in a Polar Stereographic Projection, with a standard parallel at lat. 71˚S, the map projection selected for the 25 maps, with due consideration given to scale distortion on map coverage north and south of lat. 71˚S (Reference Sievers and BennatSievers and Bennat, 1989). The primary benefit of the Polar Stereographic Projection is cartographic continuity between adjacent maps in the coverage provided of the coastal regions of Antarctica.
Topographic contours at selected intervals were generated from the BPRC digital elevation model (DEM) data (Reference LiuLiu, 1999) and modified where necessary to be congruent with surface features.
Geodetic accuracy of the RADARSAT image mosaic of Antarctica
The RADARSAT image mosaic of Antarctica was selected as the most accurate base available for geolocating the Landsat imagery; therefore, it was considered essential to confirm the published geodetic accuracy of the mosaic (±150 m; Reference Noltimier and SteinNoltimier and others, 1999).
With the cooperation of BPRC personnel, the procedure for constructing the mosaic was analyzed by the USGS. From what is presently known, the published value of 150 m geolocation accuracy seems reasonable, at least in coastal areas where adequate control was utilized. For more detail see Reference swithinbank, Williams, Ferrigno, Foley, Hallam and RosanovaSwithinbank and others (2003). This assumes several considerations: that Vexcel’s software was correctly written, that the US National Imagery and Mapping Agency and the Environmental Research Institute of Michigan technical personnel correctly identified the geodetic ground-control points (GCPs) in the radar data and that BPRC scientists and engineers made correct decisions in the selection of the 231 optimum GCPs and deletion of suspect GCPs.
Analysis
Glaciological features
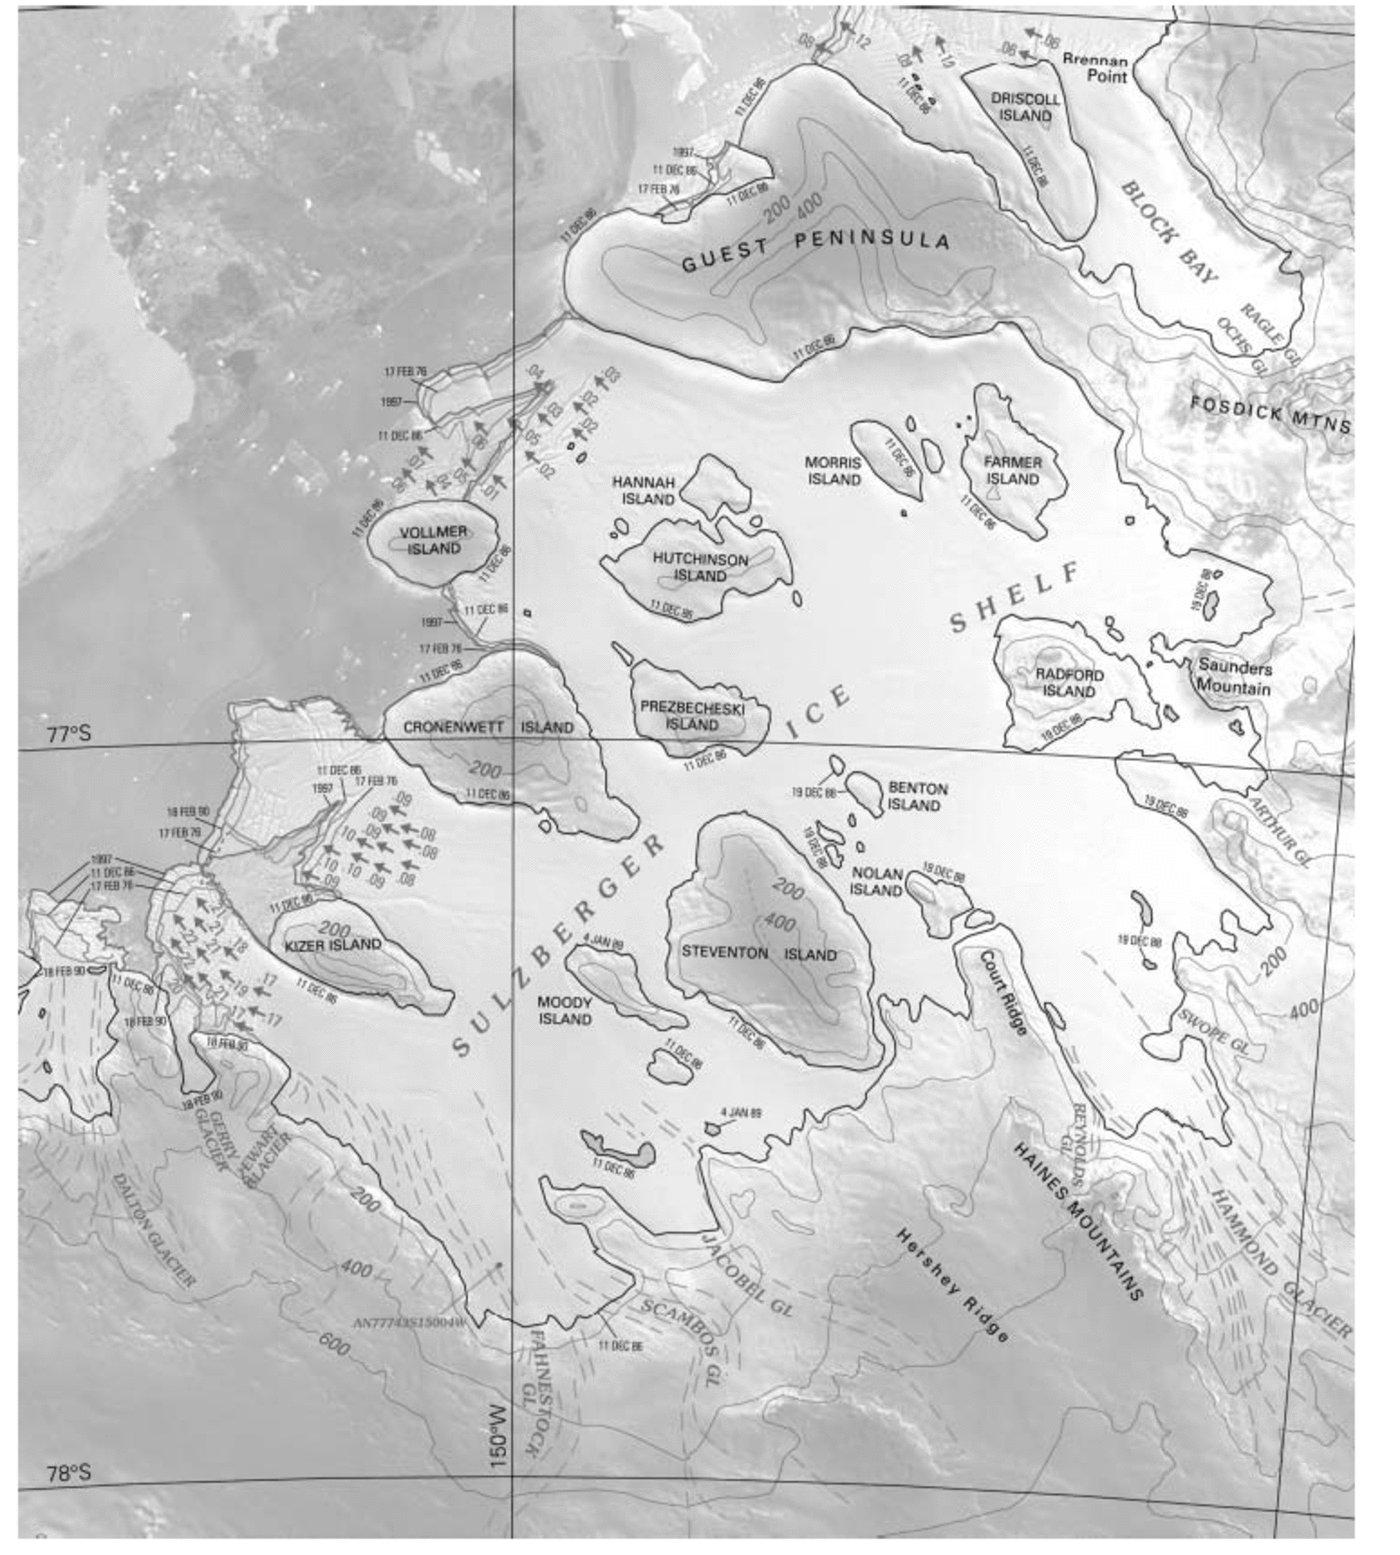
The Saunders Coast area map covers the part of Marie Byrd Land that extends from the eastern end of the Ross Ice Shelf (lat. 158.5˚W) to the western part of the Getz Ice Shelf (lat. 130˚W) and includes the Ruppert Coast and parts of the Shirase and Hobbs Coasts. The Saunders Coast area is composed of two glaciologically different areas. In the southwest corner of the map, Bindschadler, MacAyeal and Echelmeyer Ice Streams (former Ice Streams D, E and F respectively) and Kiel Glacier drain from the Shirase Coast into the massive, buttressing Ross Ice Shelf. The length of the grounding line along this part of the coastline is 800 km. The northern coastline is composed mainly of a constantly moving, floating ice front interspersed with a few small areas of fairly stable, grounded ice walls. The total coastline was digitally measured to be 1197 km long, of which only 458 km or 32% is ice wall. The dominant glaciological features on the map are Bindschadler Ice Stream (partially shown) and MacAyeal and Echelmeyer Ice Streams on the southwestern part of the map, and the Sulzberger, Nickerson and Getz Ice Shelves, and Land, Hull and DeVicq Glaciers on the northern coast. The Sulzberger Ice Shelf is the largest ice shelf on the map sheet, about 160 km long (east–west) and more than 100 km wide (north–south) (Fig. 2). It is easily recognizable by more than two dozen large and small ice rises distributed over its areal expanse between the Edward VII and Guest Peninsulas. Its area, including ice rises, is 15 721 km2. The next ice shelf to the east is the Nickerson Ice Shelf. It is separated from the Sulzberger Ice Shelf by the Guest Peninsula. According to the latest Antarctic gazetteer (Reference AlbertsAlberts, 1995), the Nickerson Ice Shelf is located north of Siemiatkowski Glacier and the western part of the Ruppert Coast and is about 60 km wide. There is no published measurement of the length. On the satellite images, it is clear that the ice shelf extends about 170 km from the eastern edge of the Guest Peninsula to Groves Island, making it the longest ice-shelf front on the map sheet. The area of the Nickerson Ice Shelf is 7207 km2, measured using the 1997 ice front. The Getz Ice Shelf extends 140 km on the eastern edge of the map and continues for another 450 km to the east within the adjacent Bakutis Coast area map. It is about 40 km wide on average. The area of the Getz Ice Shelf on this map is 5840 km2 as of 1997. Of the three major glaciers, Land and Hull Glaciers flow directly into the South Pacific quadrant of the Southern Ocean, and DeVicq Glacier flows through the Getz Ice Shelf. A total of 49 named and 3 unnamed glaciers and ice streams flow into the ice shelves or directly into the Southern Ocean; 4 other named glaciers are located in the interior mountain ranges.
Section of the USGS Geologic Investigations Map I-2600-G, Coastal Change and Glaciological Map of the Saunders Coast area, Antarctica, showing the Sulzberger Ice Shelf area. The multicolor map, reproduced here in black and white, shows the change in position of the ice front from the 1970s to 1997 and the location and amount of measured ice-surface velocities in km a–1. The grounding line has been interpreted from Landsat imagery. In this area the ice front has shown slow, continuous advance with little to no calving. The original scale of the map is 1 : 1 000 000. The map section is approximately 190km×225 km. The background image is the RADARSAT mosaic.
Outlet-glacier, ice-stream and ice-shelf velocities
Larger glacier tongues and ice shelves have well-developed crevasse patterns on their floating sections. These patterns can be tracked over time and used for velocity calculations. Surface velocities of selected glaciers were determined by two methods: an interactive one in which crevasse patterns were tracked visually on images (Reference Lucchitta, Mullins, Allison and FerrignoLucchitta and others, 1993) and an autocorrelation program developed by Reference Bindschadler and ScambosBindschadler and Scambos (1991) and Reference Scambos, Dutkiewicz, Wilson and BindschadlerScambos and others (1992). Under optimum conditions, errors can be as small as ±0.02 km a–1, but for most Landsat image pairs, where registration of features is accurate to one or two pixels, the accuracy of velocity vectors is ±0.1 km a–1. The measurement errors improve when there are longer time intervals between the images and faster velocities, both increasing ice displacement. For each glacier tongue or ice shelf, 10–100 measurement points were made. Velocity measurements have been made on Land Glacier and on the Sulzberger Ice Shelf (Reference Ferrigno, Williams, Rosanova, Lucchitta and SwithinbankFerrigno and others, 1998; Reference Rosanova, Lucchitta and FerrignoRosanova and others, 1998). Three average ice-surface velocities were calculated on the Sulzberger Ice Shelf, one of the slowest-moving ice-surface areas in Marie Byrd Land (Fig. 2). Landsat images from 1972 and 1986 produced velocities of about 200 ma–1 west of Kizer Island, and about 100 ma–1 just east of Kizer Island. Measurements on Land Glacier, using Landsat images from 1975 and 1988, resulted in an average velocity of 1.8 km a–1, comparable to the velocity of some other tidewater glaciers in the Marie Byrd Land area. Ice-surface velocity increases nearer the glacier terminus, and the ice-surface velocity of Land Glacier at the ice front is at least 2 kma–1. DeVicq Glacier flows into the Getz Ice Shelf with velocities ranging from 0.7 to >1.1 km a–1, calculated using Landsat images from 1973 to 1988. Other researchers have calculated average velocities near the mouths of Bindschadler and MacAyeal Ice Streams to be approximately 400 and 340 ma–1, respectively (Reference Bindschadler, Vornberger, Blankenship, Scambos and JacobelBindschadler and others, 1996). According to the US National Snow and Ice Data Center (NSIDC) Internet website, the velocities of Echelmeyer Ice Stream range from 20 to 170 m a–1, and those of Kiel Glacier (Prestrud Inlet) range from 20 to 180 m a–1.
Coastal change
The Landsat images and RADARSAT mosaic used for the map provide the opportunity to analyze coastal changes from the eastern edge of the Ross Ice Shelf to the Getz Ice Shelf from 1972 to 1997. Although coastal or ice-front change is not necessarily representative of the mass balance of a glacier, it is important as a general indication of possible changing conditions and may be indicative of significant change. From the western edge of the area (157˚W) to Land Glacier (75˚40' S, 141˚45' W), there is a pattern of a slow continuous advance of the ice front between 1972 and 1997 of up to 4.9 km, corresponding to the expected advance with measured velocities. Just west of Land Glacier, the pattern changes, and the ice fronts have fluctuated, showing both advance and recession. At Land Glacier, the dominant tidewater glacier in the center of the map sheet, the ice front advanced 16.1 km from January 1973 to December 1988 and then receded 4.5 km before October 1997 (Fig. 3). The 1973–88 advance created a 425 km2 increase in the area of the glacier tongue that extended beyond the coastline. The 1988–97 recession signified a 237 km2 loss of the glacier tongue area. However, because the velocity of Land Glacier averages 2 km a–1 at the ice front, the ice front would have advanced about 32km during the almost 16 year interval between the January 1973 and December 1988 Landsat images if no calving had occurred. The 16.1 km advance represents about 50% of the advance of the Land Glacier front before calving, and an actual net loss in area of about 400 km2. Assuming a conservative average thickness of the glacier tongue of 200 m, this represents a net volume loss of at least 80 km3. In the almost 9 years between December 1988 and October 1997, Land Glacier would have advanced almost 18 km if no calving had occurred. The 4.5 km recession of the ice front represents an actual loss of about 22.5 km in length, or almost 600 km2, a net volume loss of almost 120 km3. The total loss in area and volume of Land Glacier by calving between 1973 and 1997 was roughly 1000 km2 and 200 km3.
Section of the USGS Geologic Investigations Map I-2600-G, Coastal Change and Glaciological Map of the Saunders Coast area, Antarctica, showing Land Glacier and smaller glaciers to the east. The multicolor map, reproduced here in black and white, shows the change in position of the ice front from the 1970s to 1997, and the location and amount of measured ice-surface velocities in km a–1. The grounding line has been interpreted from Landsat imagery. In this area there has been considerable calving of the glacier tongues, and much of the fast ice in the area disappeared, a possible indication of changing environmental conditions. The total loss in area and volume of Land Glacier by calving between 1973 and 1997 was roughly 1000 km2 and 200 km3. The original scale of the map is 1 : 1 000 000. The map section is approximately 195 km×225 km. The background image is the RADARSAT mosaic.
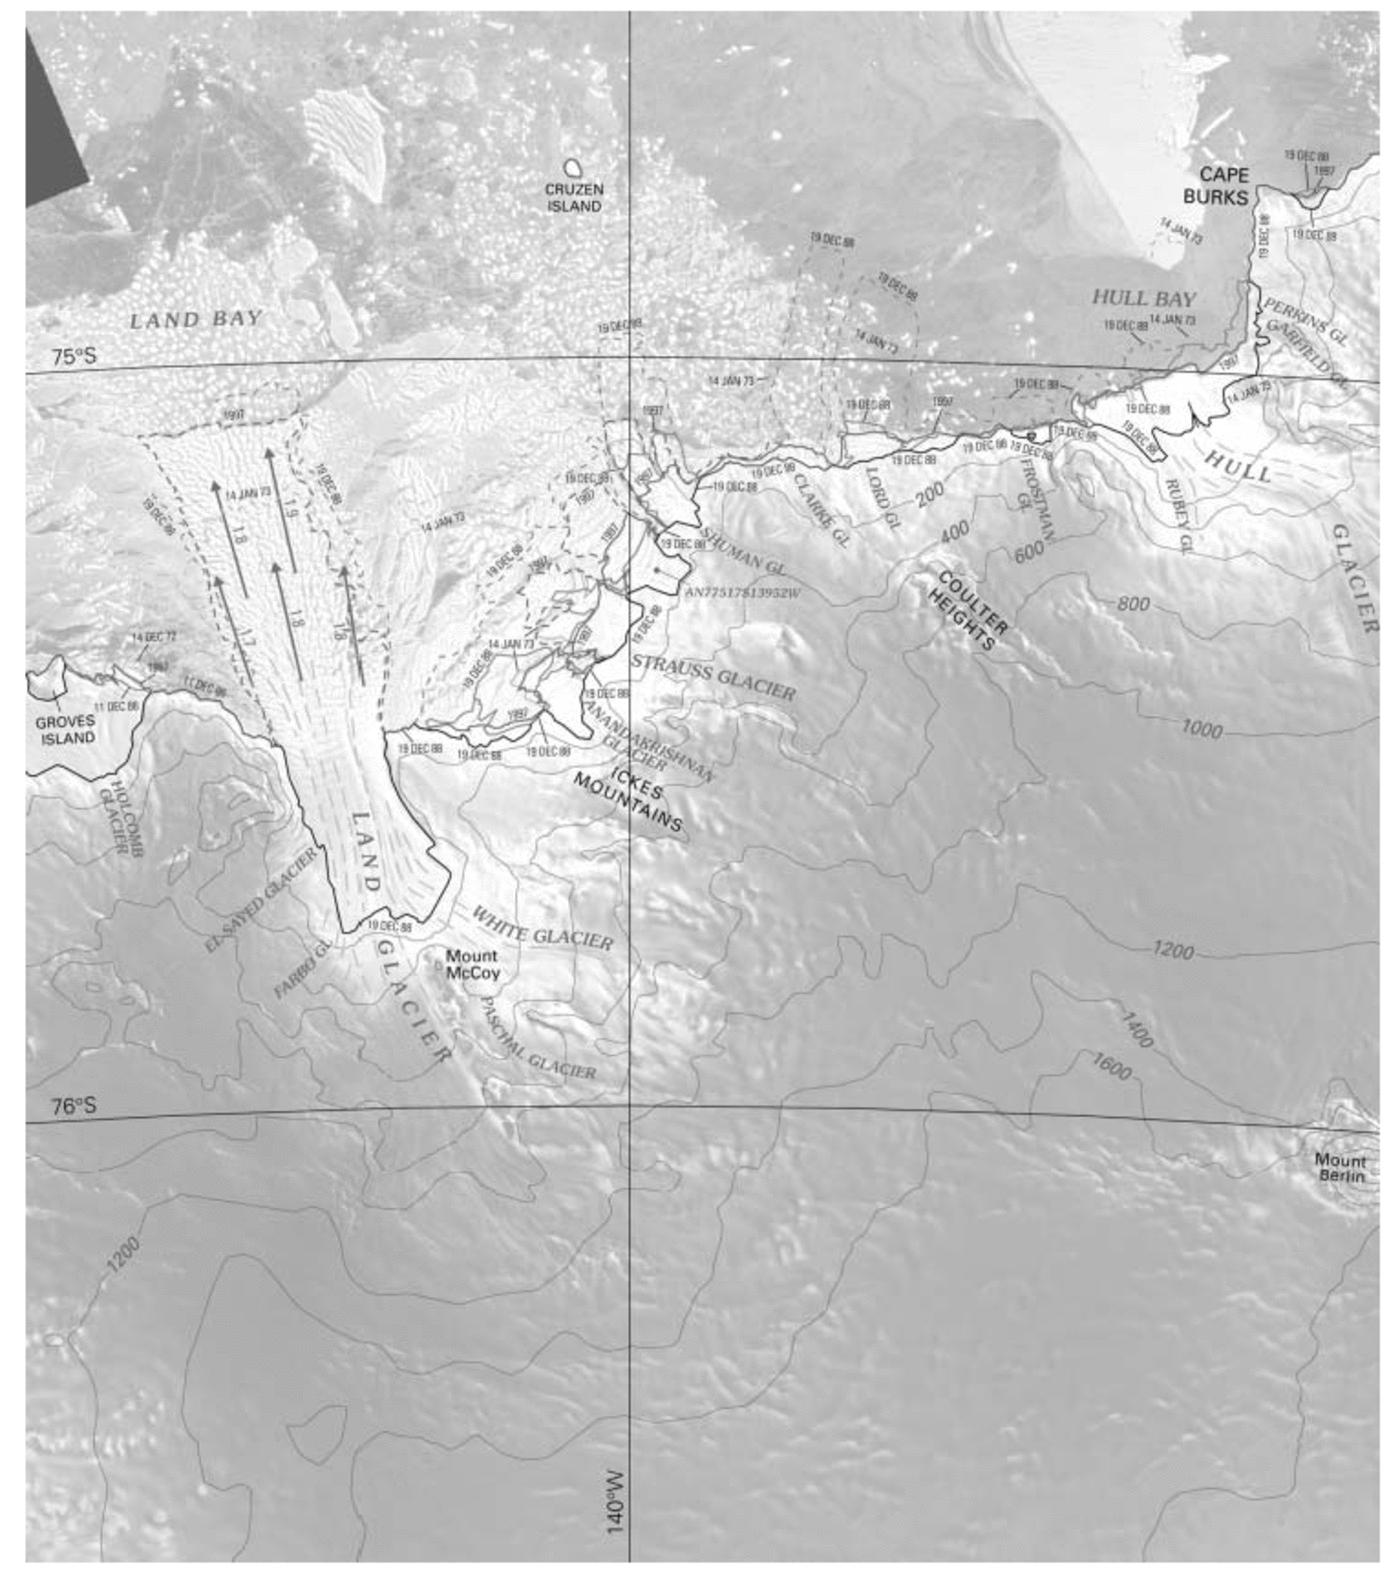
East of Land Glacier, the ice-front changes are much more complex. Both advance and recession are seen, with recession more common (Fig. 3). Some glacier tongues have almost completely disappeared, and much of the fast ice in the area broke up and moved seaward or disappeared during the time period, a possible indication of changing environmental conditions.
Hull Glacier shows a pattern of continuous retreat. There was a net retreat of 12.4 km between January 1973 and December 1988 and 5.3 km before October 1997, for a total of >17 km. Unfortunately, we have no velocity measurements of Hull Glacier to further analyze this substantial retreat. East of Hull Glacier, the Getz Ice Shelf has advanced and receded, but has not changed very much on average during the period January 1973–December 1988. DeVicq Glacier’s terminus receded 18.6 km between January 1973 and October 1997. Using ice-surface velocity measurements for the Getz Ice Shelf north of DeVicq Glacier of >1 kma–1, the ice front would have advanced >25 km during the almost 25 year time period between the Landsat images if there had been no calving. The 18.6 km retreat actually represents a calving retreat of the ice front of >43 km during the 1973–97 time period. The overall trend of ice-front recession from Land Glacier to the eastern edge of this map is noteworthy, especially in light of the recent thinning of the Getz Ice Shelf shown by radar data (personal communication from H. J. Zwally, 2001) and the noted amount of warm bottom water along the Marie Byrd Land coast (Reference Jacobs, Hellmer and JenkinsJacobs and others, 1996).
Summary
The analysis of Landsat 1 and 2 MSS images (1972–76), Landsat 4 and 5 MSS and TM images (1986–90), and the RADARSAT image mosaic (1997) used in the preparation of this map of the Saunders Coast area, made it possible to identify and describe glaciological features, document coastal change and notice trends in the changing coastline.
There are a total of 49 named glaciers, including three major outlet glaciers – Land, Hull and DeVicq Glaciers – and three unnamed glaciers that flow into the ice shelves or directly into the South Pacific quadrant of the Southern Ocean; four other named glaciers are in the interior mountain ranges.
The following general trends were evident while observing changes in the ice-front location along the Saunders Coast area in three time-frames represented by the satellite imagery. From the western edge of the map to Land Glacier, two-thirds of the distance along the northern coastline, the ice front shows a slow continuous advance from 1972 to 1997. There has apparently been very little to no calving. The front of the Land Glacier terminus advanced 16.1 km from 1973 to 1988 and receded 4.5 km before 1997. Factoring in the velocity of Land Glacier, this represents calving of about 38.6 km of the length of the glacier tongue, an estimated net loss in area of approximately 1000 km2 and in volume of 200 km3. East of Land Glacier, the ice front has advanced and retreated, but with an overall trend toward retreat. Much of the fast ice and many of the iceberg tongues fractured, moved seaward or disappeared during the 1972– 97 time period. This overall trend is noteworthy because it is a possible indication of changing environmental conditions.
Acknowledgements
We would like to acknowledge the support provided for the preparation of the Saunders Coast area map. K. C. Jezek and K. F. Noltimier of the Byrd Polar Research Center were extremely helpful by providing the RADARSAT mosaic in several formats and by supplying data on digital construction and geometric accuracy of the mosaic. J.W. Schoonmaker, USGS (retired), was an invaluable help in evaluating the geodetic accuracy of the RADARSAT mosaic. We appreciate the contributions of C. E. Rosanova and T. M. Hare, USGS (Flagstaff, AZ), who carried out the ice-velocity measurements. Funding for the project was provided by the USGS’s commitment to the multi-Federal agency US Global Change Research Program, the US part of the International Geosphere–Biosphere Programme. We also appreciate the beneficial comments of E. Rignot and T. Hughes who reviewed the manuscript.



