Introduction
The initial processing of the visual signal involves the transfer of information across multiple synapses as the signal is transmitted through the retina. It is well established that retinal neurons express a variety of traditional neurotransmitters that are loaded into synaptic vesicles and are released when a presynaptic Ca2+ signal initiates fusion of synaptic vesicles with the presynaptic membrane. Nontraditional intercellular signaling molecules are also found in the retina such as endocannabinoids (reviewed in Yazulla, Reference Yazulla2008), sphingolipids (Crousillac et al., Reference Crousillac, Colonna, McMains and Gleason2009), and nitric oxide (NO) (reviewed in Vielma et al., Reference Vielma, Retamal and Schmachtenberg2012). These compounds can be synthesized on demand and are not dependent upon exocytosis for their release.
NO is produced by an enzymatic reaction converting arginine into citrulline and NO by the activity of nitric oxide synthase (NOS). NO initiates the “classical” pathway by stimulating soluble guanylate cyclase (sGC) activity to produce cGMP (Arnold et al., Reference Arnold, Mittal, Katsuki and Murad1977). NO can also nitrosate proteins at cysteine residues (Stamler et al., Reference Stamler, Toone, Lipton and Sucher1997; Davis et al., Reference Davis, Martin, Turko and Murad2001). Nitrosation is analogous to phosphorylation in that it is a reversible chemical modification that alters protein function (Lane et al., Reference Lane, Hao and Gross2001; Seth & Stamler, Reference Seth and Stamler2011). Potential target proteins include receptors, ion channels, transporters, enzymes, G-proteins, and transcription factors (Stamler et al., Reference Stamler, Toone, Lipton and Sucher1997; Seth & Stamler, Reference Seth and Stamler2011).
NO-dependent effects have been found for most cell types in the vertebrate retina. NO can modulate both Ca2+ and cyclic-nucleotide-gated channels at photoreceptor synaptic terminals, and this has been shown to alter the synaptic activity (Rieke & Schwartz, Reference Rieke and Schwartz1994; Savchenko et al., Reference Savchenko, Barnes and Kramer1997). In the rat retina, there is also evidence that NO production in cone cells increases their light responses during light adaptation (Sato et al., Reference Sato, Ohtsuka and Stell2011). NO also reduces horizontal cell gap junction coupling in the catfish, bass, and rabbit (DeVries & Schwartz, Reference DeVries and Schwartz1989; Lu & McMahon, Reference Lu and McMahon1997; Xin & Bloomfield, Reference Xin and Bloomfield2000). Also in the rabbit retina, the NO donor, S-nitrozo-N-acetyl-DL-penicillamine (SNAP), has been shown to reduce the conductance of the gap junctions between the bipolar cells and AII amacrine cells (Mills & Massey, Reference Mills and Massey1995). Previous work from our lab has shown that NO can switch amacrine cell inhibitory synapses into excitatory synapses by moving the equilibrium potential of chloride to more positive values due to the elevation in cytosolic chloride (Hoffpauir et al., Reference Hoffpauir, McMains and Gleason2006). Knockouts of neuronal nitric oxide synthase (nNOS) and inhibition of nNOS both reduce the light sensitivity measured in ganglion cells (Wang et al., Reference Wang, van der List, Nemargut, Coombs and Chalupa2007; Nemargut & Wang, Reference Nemargut and Wang2009). These effects of NO, occurring at multiple retinal levels demonstrate the importance of identifying the potential sources of NO in the retina with the long term goal of understanding when and where NO signals are produced.
Regulation of nNOS and eNOS
There are three forms of NOS: nNOS, endothelial nitric oxide synthase (eNOS) and inducible nitric oxide synthase (iNOS). nNOS and eNOS are activated by cytosolic Ca2+ elevations and are expressed in the central nervous system. eNOS and nNOS are Ca2+/calmodulin (Ca2+/CaM) activated but that is not the only part of the story. Both enzymes can also be phosphorylated by multiple kinases with the effects of the phosphorylation (inhibition or stimulation) dependent upon the phosphorylation site [reviewed in (Zhou & Zhu, Reference Zhou and Zhu2009; Michel & Vanhoutte, Reference Michel and Vanhoutte2010)]. NOS function is also regulated by differential trafficking via interactions with proteins such as CAPON and NOSTRIN (Zimmermann et al., Reference Zimmermann, Opitz, Dedio, Renne, Müller-Esterl and Oess2002; Icking et al., Reference Icking, Matt, Opitz, Wiesenthal, Müller-Esterl and Schilling2005) and NOSIP (Schleicher et al., Reference Schleicher, Brundin, Gross, Müller-Esterl and Oess2005).
NOS expression
NOS activity has been detected in photoreceptors, subsets of amacrine cells and cells in the GCL by NADPH-diaphorase method (Sandell, Reference Sandell1985; Sagar, Reference Sagar1986; Vaney & Young, Reference Vaney and Young1988; Cobcroft et al., Reference Cobcroft, Vaccaro and Mitrofanis1989; Vaccaro et al., Reference Vaccaro, Cobcroft, Provis and Mitrofanis1991; Koistinaho et al., Reference Koistinaho, Swanson, de Vente and Sagar1993) and nNOS immunolabeling (Perez et al., Reference Perez, Larsson, Alm, Andersson and Ehinger1995; Kim et al., Reference Kim, Lee, Kim, Ju, Oh, Joo and Chun1999; Oh et al., Reference Oh, Kim, Kim, Kim, Huh, Chung and Chun1999; Rios et al., Reference Rios, Lopez-Costa, Fosser, Brusco and Saavedra2000) in the vertebrate retina. After fixation, persistent NOS activity (and possibly other enzymes) can produce the visible NADPH-diaphorase reaction product (Hope et al., Reference Hope, Michael, Knigge and Vincent1991; Tracey et al., Reference Tracey, Nakane, Pollock and Forstermann1993). In the chicken retina four subsets of amacrine cells as well as cells (target amacrine cells) that receive synapses from efferent projections from the isthmo-optic nucleus (ION) have been determined to be NADPH-diaphorase-and nNOS-positive (Fischer & Stell, Reference Fischer and Stell1999). Photoreceptor ellipsoids and Müller cells were also NADPH-diaphorase-positive. Rios et al. (Reference Rios, Lopez-Costa, Fosser, Brusco and Saavedra2000) have also shown subsets of NADPH-diaphorase-positive amacrine cells in chicken central retina that appear to be similar to the amacrine cell subtypes described in Fischer and Stell (Reference Fischer and Stell1999). In a careful analysis of the whole mount chicken retina, NADPH-diaphorase method and nNOS immunolabeling were used to identify 15 types of retinal neurons comprising of amacrine cells and ganglion cells (Wilson et al., Reference Wilson, Nacsa, Hart, Weller and Vaney2011). Using a monoclonal antibody, eNOS-immunolabeling was shown in Müller glia end feet of fish, frog, salamander, turtle, chicken, rat, ground squirrel, monkey retina, and in horizontal cells in turtle, fish and possibly chicken retina (Goureau et al., Reference Goureau, Regnier-Ricard, Jonet, Jeanny, Courtois and Chany-Fournier1997; Haverkamp et al., Reference Haverkamp, Kolb and Cuenca1999). The ultrastructural localization of nNOS immunolabeling has been shown in the processes of bipolar and horizontal cells (Haverkamp & Eldred, Reference Haverkamp and Eldred1998) and in the presynaptic amacrine cell processes (Cao & Eldred, Reference Cao and Eldred2001) in the turtle retina. NO imaging has been done in slices of turtle (Blute et al., Reference Blute, Lee and Eldred2000) and salamander (Eldred & Blute, Reference Eldred and Blute2005; Blom, et al., Reference Blom, Blute and Eldred2009) retina where it was reported that members of each major class of retinal neurons are capable of producing NO.
Although the expression of nNOS has been well described, the match between the capability to produce NO and actual NO production has been difficult to achieve. Fischer and Stell (Reference Fischer and Stell1999) were able to combine NADPH-diaphorase histochemistry and nNOS immunolabling on fixed chicken retina by first processing and imaging the tissue for histochemistry and then reprocessing and imaging the tissue for immunohistochemistry. This dual approach found overlap for some elements (amacrine cells, ganglion cells and efferent fibers) but not for the others (Müller cells, photoreceptor ellipsoids). Here, we look at the NO signal generated in the living retina using 4-amino-5-methylamino-2′,7′-difluorofluorescein diacetate (DAF-FM). It has been previously established that retinal DAF signals are unchanged by fixation (Eldred & Blute, Reference Eldred and Blute2005) which enables the subsequent fixation and immunolocalization of nNOS and eNOS in the same tissue. We find that in the chicken retina, the DAF signal extends more broadly than the nNOS expression pattern that we observed and that has been observed by others. Our discovery of fairly widespread eNOS-like immunoreactivity may provide a resolution to this discrepancy. We find that cells in both the inner and outer retina are capable of generating NO and thus have the potential to modulate visual signaling at all levels of the chicken retina.
Materials and methods
All methods concerning the use of animals are approved by the Institutional Animal Care and Use Committee, Louisiana State University. Adult White Leghorn chickens (4–8 weeks old) were sacrificed by intraperitoneal injection of sodium pentobarbital (500 mg/kg, Sigma-Aldrich) followed by decapitation. The eyes were enuclated and hemisected. After removing the vitreous, the retinae were dissected from the eye cup and protocols were carried out as described in the following sections. Each immunohistochemistry experiment reported was repeated on at least three different animals.
DAF-FM-loading
Chickens that were 4–8 weeks old were sacrificed and retinae were dissected as described above. After dissection, the retinas were rested in a light-tight box in the dark for 20–30 min then loaded with the NO indicator fluorescence dye, 4-amino-5-methylamino-2′,7′-difluorofluorescein diacetate (20 µM DAF-FM diacetate, Invitrogen, Carlsbad, CA) at room temperature (RT) for 30 min, also in the dark. The DAF-FM loading solution contained (in mM): KCl 5.4, NaCl 137.0, CaCl2 3.0, HEPES 10.0, glucose 5.6, bicarbonate-buffered external solution: KCl 2.5, NaCl 125.0, CaCl2 2.5, NHCO3 26.0, NaH2PO4 20.0, and glucose 1.3. Both solutions also contained: L-arginine (1 mM), glycine (10 µM) and N-methyl-D-aspartate (NMDA) (250 µM). With the exception of that depicted in Fig. 1E, all DAF experiments were done with NMDA included in the external solution. For some experiments, the competitive NOS inhibitor L-NG-nitroarginine methyl ester (L-NAME, 200 µM, Plymouth Meeting, PA) or the NMDA receptor antagonist (2R)-amino-5-phosphonovaleric acid (APV, 250 µM) were included. After washing (3 times, 5 min each) retinae were fixed in 4% paraformaldehyde for 30 min at RT. Washing and transfer to a fixative was done under dim light (<1.0 lux, measured with an ILT 1400 light meter, International Light Technologies, Peabody, MA) followed by the fixation period in the dark. The ability to preserve a pattern of DAF signal with aldehyde fixation has previously been established for other tissues (Sugimoto et al., Reference Sugimoto, Fujii, Takemasa and Yamashita2000) as well as the retina (Eldred & Blute, Reference Eldred and Blute2005). The specificity of the DAF signal for NO rather than other metabolites has also been previously demonstrated (Kojima et al., Reference Kojima, Nakatsubo, Kikuchi, Kawahara, Kirino, Nagoshi, Hirata and Nagano1998). DAF-FM-loaded and fixed retinae were cryoprotected and prepared for frozen sectioning as described below.
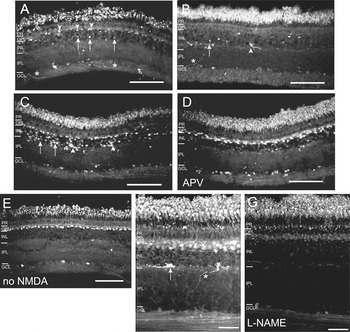
NO production in the chicken retina. (A–G) Images of DAF-FM-loaded and fixed retinal sections from the ventral retina. All samples (except in E) were prepared in solutions containing 250 µM NMDA. (A) Arrowheads indicate DAF-FM-positive horizontal cells and arrows denote likely amacrine cells. One cell has a strong signal in the GCL. Asterisks indicate prominent labeled processes in the nerve fiber layer that may be efferent fibers originating from the ION of the brain. The section in (B) has few horizontal cells labeled as compared to that in (A). This section (B) contains a labeled efferent synapse (arrowhead) and labeled nontarget amacrine cells (arrow). The asterisk indicates a thick process crossing the IPL and is likely to be originating from the ION. A few cells are labeled in the GCL. (C) Another retinal section has strong horizontal cell signal as well as numerous cell bodies with DAF signal in the INL. Arrows indicate nontarget amacrine cells and the arrowheads denote efferent synapses. (D) A section is shown from the same retina as (C) but processed with the NMDA receptor blocker APV (250 µM) in the incubation solution. Under these conditions, the horizontal cell signal persists but the DAF signal in the INL has been suppressed. (E) A section from a retina that was DAF-loaded and incubated in the absence of NMDA. (F) This section from another retina shows a strong horizontal cell DAF signal and a strong signal in two efferent synapses (arrow). This section is at a slight angle such that horizontal cell bodies and processes are especially prominent. The asterisk indicates the process that runs across the IPL leading to the synapse on the right. The section in (G) is from the same retina as (F) but processed in the presence of the NOS inhibitor L-NG-nitroarginine methyl ester (L-NAME) (200 µM) and shows that with inhibition of NOS activity, the DAF signal is strongly suppressed. Scale bar is 50 µm (A–E), 30 µm (F and G).

Western blots
Chicken brain (CB) and mouse brain (MB) (a gift from Dr. Jackie Stephens) were homogenized in lysis buffer (300 mM NaCl, 2% Triton X-100, 20 nM Tris, 2 mM EDTA, 2 mM EGTA, 1% NP40) containing a cocktail of protease inhibitors: PMSF (1 mM), leupeptin (5 µg/ml), aprotinin (2.5 µg/ml), 1,10 ortho-phenantrolin (0.2 µg/ml), and pepstatin (0.7 µg/ml). Samples were spun at 4000 rpm for 20 min at 4°C. Protein content of the supernatant was determined using the BCA protein assay kit from Pierce (Rockford, IL). Proteins (300 µg/lane) were separated on a 7.5% SDS gel along with 10 µl/lane Pageruler molecular weight markers (Fermata, Glenburnie, MD). The proteins were transferred to nitrocellulose membranes. The membranes were blocked overnight at 4°C in Tris-buffered saline containing 4% milk, and 0.1% TWEEN-20. The polyclonal antibody raised against bovine eNOS (Sigma-Aldrich, St. Louis, MO) was diluted 1:20,000 in PBS with 1% BSA. Goat anti-rabbit secondary antibody conjugated to horseradish peroxidase (Pierce-Thermo Scientific, Rockford, IL) was diluted to 1:10,000 in PBS with 1% milk. The membranes were incubated in primary and secondary antibodies for 1.5 h each, at RT. The proteins were visualized using the Supersignal Western Pico Reagent (Pierce).
Immunohistochemistry
Four to eight week old chickens were sacrificed as described above. Following fixation, retinae were washed in PBS + 1% glycine. The retinae were then incubated in a series of sucrose solutions: 15% sucrose for 30 min, 20% sucrose for 1 h, and 30% sucrose solution overnight at 4°C. The retinae were then embedded in an optimum cutting temperature (OCT) compound (Sakura Finetek, Torrence, CA) by freezing on a slurry of dry ice and isopentane. Sections (12–16 µm) were cut on a Leica CM1850 cryostat (Wetzlar, Germany) and mounted on presubbed slides (Southern Biotech, Birmingham, AL). Unless otherwise indicated, images are of ventral retina.
Retinal sections were preincubated for 1 h at RT in a blocking solution consisting of dilution solution (PBS, 1% bovine serum albumin, 0.5% saponin) with 10% normal goat serum. Information on antibodies, sources and dilutions is reported in Table 1. Polyclonal nNOS, monoclonal HPC-1 (syntaxin 1) and glutamine synthetase (GS) antibodies were applied to retinal sections for 1 h at RT, then washed in PBS. Antibodies raised against eNOS, calretinin, and protein kinase C (PKC) were applied to retinal sections for 72 h at 4°C followed by washing in PBS. Sections were then incubated in secondary antibodies (goat anti-rabbit Cy3, 1:3000 and/or goat antimouse Dylight 488, 1:100) for 1 h at RT. After the incubation with the secondary antibodies, sections were washed in PBS, and mounted in a medium containing 70% glycerol, 28% PBS and 2% n-propyl gallate.
Antibodies used in this study

For the double-labeling experiments using polyclonal eNOS with monoclonal calretinin, and PKC antibodies, retinal sections were co-incubated for 72 h at 4°C with the primary antibodies and for 1 h at RT with the secondary antibodies. For double-labeling experiments using polyclonal eNOS with monoclonal HPC-1 and GS antibodies, retinal sections were sequentially incubated for 72 h at 4°C with anti-eNOS and 1 h at RT with the anti-HPC-1 and anti-GS, and 1 h at RT with the secondary antibodies. No nonspecific labeling was observed for any of the secondary antibodies used in these experiments.
For the antigen peptide (AP) and eNOS antibody double-labeling experiments, retinal sections were treated with eNOS antibody (1:2000) and a mixture of anti-eNOS and the AP (designed by Protein Facility, LSU Ag Center, Baton Rouge, LA; anti-eNOS:AP, 1:10) overnight at RT. Tissue sections were then washed in PBS and incubated in Cy3-conjugated goat anti-rabbit secondary antibody (1:3000) for 1 h at RT followed by washing in PBS.
Image processing and analysis
DAF-FM-loaded, fixed and frozen tissue sections were observed on either a Zeiss (Thornwood, NY) Axiovert 200M inverted microscope equipped with epifluorescence and a Zeiss Apotome or on a Leica TCS SP2 wide-field confocal fluorescence microscope (Buffalo Grove, IL). Images of double-labeled sections were collected by sequential scanning with all confocal images collected using the same confocal laser intensity. PMT gain was adjusted separately for each antibody. Images of single- and double-labeled tissue are maximum projections of z-stack (1 µm thick planes). All co-localization of eNOS-LI and marker antibodies were confirmed by inspection of single plane images. All fluorescent confocal images were median-filtered using the Leica Confocal Software. Images were adjusted for brightness in Adobe Photoshop (Adobe, San Jose, CA). When images are intended to convey the differences between two conditions, the images have to be adjusted equally (Fig. 1C–1F, Fig. 3B and 3C). Figures were assembled in Adobe Illustrator.
Results
Nitric oxide is produced endogenously in the chicken retina
Previous studies have demonstrated NO production in the retinal slice of turtle and tiger salamander using DAF-2 and DAF-FM (Blute et al., Reference Blute, Lee and Eldred2000; Eldred & Blute, Reference Eldred and Blute2005; Blom et al., Reference Blom, Blute and Eldred2009). To investigate the production pattern of NO in the chicken retina, freshly dissected retinae were loaded with DAF-FM in a solution containing NMDA to stimulate excitatory pathways and Ca2+ influx. Although great care was taken to process all retinas under the same set of conditions, variability in the DAF signal from retina to retina was observed. The primary difference observed in some retinas was that there was very little DAF signal in the tissue rather than novel cell types showing DAF signal. The results reported here will describe the cell types with strong DAF signals that were commonly observed in retinas derived collectively from more than 20 chickens under control conditions.
Multiple cell types were DAF-FM-positive in the chicken retina (Fig. 1). DAF-FM fluorescence was strong in photoreceptors, horizontal cell bodies and processes (arrowheads, Fig. 1A), efferent synapses onto target amacrine cells (Fig. 1B and 1C, arrowheads, Fig. 1F, arrow), and axons that could consist of both ganglion cell axons and efferent axons from the ION (Fig. 1A, asterisks,). Nontarget amacrine cells could also be DAF-FM-positive (Fig. 1A and 1C, arrows). The photoreceptor signal often had a punctate appearance which may represent the activation of nNOS associated with ellipsoid mitochondria (Cao and Eldred, Reference Cao and Eldred2001; Eldred and Blute, Reference Eldred and Blute2005). Consistent with observations in the turtle retina, the DAF-FM signal was typically confined within the cells and did not appear to spread beyond the plasma membrane (Blute et al., Reference Blute, Lee and Eldred2000; Eldred & Blute, Reference Eldred and Blute2005; Blom et al., Reference Blom, Blute and Eldred2009). We also observed DAF-FM fluorescence in the somata in the GCL. The strong DAF-FM signal in the horizontal cells was unexpected and was unlikely to be directly due to the NMDA included in our loading and washing solutions because the evidence for NMDAR’s on horizontal cells is limited (reviewed in Shen et al., Reference Shen, Liu and Yang2006). NMDAR independence was supported by experiments using the NMDAR antagonist (APV, 250 µM). APV suppressed the DAF signal in the inner two-thirds of the inner nuclear layer (INL) but the horizontal cell signal and the signal in the GCL persisted (Fig. 1C and 1D). The horizontal cell and some GCL signal also persisted in the absence of NMDA (Fig. 1E). The observation that the horizontal cell and GCL DAF signal is independent of the NMDA receptor activity suggests that the signal was generated via endogenous glutamate release onto nonNMDA receptors and possibly subsequent activation of voltage-gated Ca2+ channels.
To investigate the role of NOS in the generation of the DAF-FM signal, we used a general NOS inhibitor, L-NAME. L-NAME (200 µM) was included in the external solution (before, during and after the DAF-FM-loading). L-NAME reduced the DAF-FM signal in the chicken retina (Fig. 1F) providing evidence that the DAF-FM signal represents the NO generated by the NOS activity. The DAF-FM signal most resistant to NOS inhibition was in photoreceptors and some elements in the nerve fiber layer. The relative persistance of the DAF signal in photoreceptors suggests especially a high level of NOS activity. Another factor may be that photoreceptors have a relatively high level of the substrate arginine.
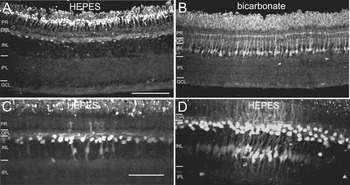
The majority of our DAF experiments were done in a HEPES-buffered external solution. We discovered, however, that DAF loading done in bicarbonate-buffered external solutions gave a distinctive DAF labeling pattern. Furthermore, this difference was observed in pieces of retina derived from the same retinal region from the same animals. We consistently observed that retinas loaded and processed in bicarbonate buffered solution had an INL DAF-FM signal that was nearly exclusively confined to Müller glia unlike the majority of those that were loaded and processed in HEPES-buffered solution (Fig. 2A and 2B). DAF-FM signals in Müller cells were occasionally observed when normal (HEPES buffered) solution was used. In these instances, the signal was usually observed in “hotspots” and was also seen in the nearby horizontal cells (Fig. 2C and 2D). When we initially observed the hot spots, we suspected that we might have damaged the retina; however, inspection of the sections did not reveal any obvious damage (see Discussion section).
The pattern of the DAF-FM signal can be altered in different buffering conditions. (A) An example of a section of a DAF-FM-loaded retina processed in normal external solution containing 10 mM HEPES. (B) A section from the same DAF-FM-loaded retina as in (A) but was processed in bicarbonate-buffered external solution shows extensive DAF-FM signal in Müller glial cells. Scale bar in (A) is 50 µm and applies to (B) as well. (C and D) Examples of “hot spots” of DAF-FM signal occasionally observed in sections of retina processed in normal (HEPES-buffered) external solution. In both cases, a group of horizontal cells have relatively strong DAF-FM signal and the signal is also observed in the Müller cells in the same location. Scale bar in (C) is 50 µm and also applies to (D).

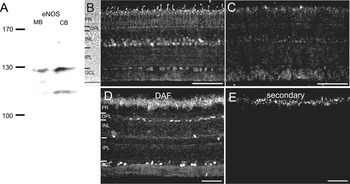
The specificity of the eNOS antibody in chicken tissue. (A) Western blot of protein (300 µg/lane) from CB and MBs. The eNOS antibody detects protein near the appropriate molecular weight for eNOS (135 kDa) in both MB and CB. The additional band in CB may represent a degradation product. (B) A section of chicken retina labeled with the eNOS antibody. (C) Preincubation of the primary antibody with the antigen peptide markedly reduces eNOS antibody labeling. (D and E) A section of a DAF-FM-loaded retina is also treated with the secondary antibody used to visualize eNOS. No interference from the DAF-FM signal and no nonspecific labeling are seen in the secondary only control. Scale bar is 50 µm.

Expression of nNOS and eNOS
Previously reported patterns of nNOS expression using a polyclonal antibody in the chicken retina do not show horizontal cell body labeling or extensive Müller cell labeling (Fischer & Stell, Reference Fischer and Stell1999). A monoclonal antibody raised against nNOS, however, did show some partial labeling of Müller cells (McMains et al., Reference McMains, Krishnan, Prasad and Gleason2011). nNOS expression in processes in the outer plexiform layer (OPL) has been observed at the light microscope level in the chicken retina (Fischer & Stell, Reference Fischer and Stell1999) and horizontal cell process labeling has been reported at the light level in salamander retina (Blom et al., Reference Blom, Blute and Eldred2009) and at the electron microscope level in the turtle retina (Haverkamp & Eldred, Reference Haverkamp and Eldred1998). eNOS expression was previously studied in the chicken retina using a monoclonal eNOS antibody and labeling was confined to Müller cell end feet and fine OPL processes, possibly arising from horizontal cells (Haverkamp et al., Reference Haverkamp, Kolb and Cuenca1999). We have identified a polyclonal eNOS antibody to further explore the source of the horizontal cell and Müller cell DAF-FM signal.
We have previously shown nNOS-immunolabeling in cultured retinal amacrine cells in chicken with a polyclonal antibody that recognized a band of the correct molecular weight in homogenates of both CB and retina (Crousillac et al., Reference Crousillac, LeRouge, Rankin and Gleason2003). Here, we further examine the expression of nNOS and eNOS by using that same polyclonal nNOS antibody and the polyclonal eNOS antibody on sections of DAF-loaded chicken retina.
The specificity of the eNOS antibodies was assessed by Western blot analysis using homogenates of chicken brain (CB) and mouse brain (MB). Polyclonal eNOS antibodies labeled a band near the expected molecular weight for eNOS (135 kDa) both in mouse and CB homogenates (Fig. 3A). The eNOS antibodies also labeled a second band near the molecular weight of 115 kDa, possibly a degradation product. To further examine the specificity of the antibody, we had the eNOS antibody AP synthesized and tested its ability to inhibit antibody binding on sections of chicken retina. Co-incubation with the AP was effective in suppressing the labeling by the eNOS antibody (Fig. 3B and 3C). However, because the extra band in the Western blot may indicate that some fraction of the antibody labeling on sections could be nonspecific, we will refer to the labeling pattern with the eNOS antibody as eNOS-like immunoreactivity (eNOS-LI). To address whether DAF-FM loading might somehow be incompatible with antibody labeling or visualization, we tested the DAF-FM-loaded sections of the retina with the Cy3-conjugated goat anti-rabbit secondary antibodies and found no nonspecific secondary labeling or bleed through of the DAF-FM fluorescence signal (Fig. 3D and 3E).
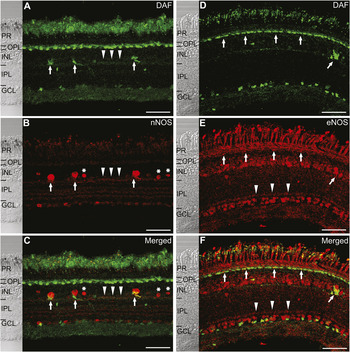
As in previous experiments, DAF-FM labeling was found in photoreceptors, horizontal cells, amacrine cells, Müller cells (occasionally, in hot spots), some cells in the GCL, efferent axons and axons in the nerve fiber layer (Fig. 4A and 4D). Arrowheads (A–C) indicate some of the DAF-FM-positive processes at the INL–inner plexiform layer (IPL) border labeled with anti-nNOS. The nNOS antibody also labeled some photoreceptors (see also Fig. 5A), and cell bodies at the inner border of the INL; some of which were target amacrine cells, (Fig. 4B, arrows) and others that were nontarget amacrine cells (asterisks). DAF-FM-positive efferent synapses onto target amacrine cells were also labeled with nNOS antibody (Fig. 4C, arrows). Faint labeling could sometimes be observed in the OPL. Although horizontal cells had a strong DAF signal, no definitive horizontal cell labeling was observed with the nNOS antibody. INL cells with DAF signals but no nNOS expression have also been reported in the salamander retina (Eldred & Blute, Reference Eldred and Blute2005). Faint vertical elements extending through the INL that might be Müller cells could sometimes be observed (see Fig. 5B). In the IPL, distinct bands were labeled with the nNOS antibody. Particularly prominent were the labeled processes at the INL–IPL border (Fig. 4B, arrowheads) and these show overlapping with DAF (Fig. 4C).
NOS-expressing cells and nitric oxide (NO) production. (A–C) Confocal microscopy images of DAF-FM-labeling along with anti-nNOS. Efferent synapses are both DAF-FM- and neuronal NOS-positive (arrows), and anti-nNOS also labels target cell somata (B). Arrowheads indicate processes at the outer border of the IPL that are co-labeled with DAF-FM and anti-nNOS. Asterisks indicate nNOS-positive nontarget amacrine cells. (D–F) Confocal images of DAF-FM labeling along with anti-eNOS. Vertical arrows indicate DAF-FM- and anti-eNOS-positive horizontal cells. Diagonal arrow shows an efferent synapse positive for anti-eNOS and DAF-FM. Arrowheads in (E) indicate a band of eNOS-LI near the border of IPL and GCL that is often observed. Scale bar is 50 µm.

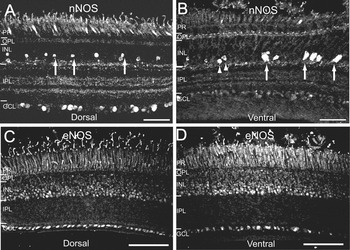
Neuronal nitric oxide synthase (nNOS) has a different labeling pattern in dorsal and ventral retina. Confocal images of dorsal and ventral retina labeled with the polyclonal nNOS antibodies (A) and (B). The IPL synaptic bands labeled with nNOS are visible both in ventral and dorsal retina. Cells in the GCL are labeled with anti-nNOS both in dorsal and ventral retina; however, more cells are labeled in dorsal retina. There is a weak signal in the OPL and photoreceptor labeling in both dorsal and ventral retina. Dorsal retina contains amacrine cells that have smaller somata than those found in ventral retina (arrows in A). Target amacrine cells and their efferent synapses are confined to the ventral retina (arrows). The ventral retina also contains labeled nontarget amacrine cells with somata larger than those nontarget amacrine cells in dorsal retina (B, arrowheads). (C and D) The pattern of endothelial nitric oxide synthase-like immunoreactivity (eNOS-LI) does not differ in dorsal and ventral retina. Scale bars are 50 µm.

The eNOS antibody-labeled photoreceptors, the OPL and cells at the outer border of the INL (Fig. 4E, vertical arrows). Cell body labeling was also found in the inner one-third to one-half of the INL. Labeling in the IPL was generally diffuse with the exception of a distinct band near the GCL that could often be discerned (Fig. 4E and 4F, arrowheads). Many of the DAF-FM-positive horizontal cells showed eNOS-LI (Fig. 4D–4F, vertical arrows). A DAF-FM-positive efferent synapse was also positive for eNOS antibody (Fig. 4D–4F, diagonal arrow). This observation was relatively rare as efferent synapses much more commonly express nNOS. However, expression of both enzymes cannot be ruled out.
The regional distribution of nNOS and eNOS-LI
Differences in nitrergic amacrine cells between dorsal and ventral retina has been previously demonstrated for the chicken retina (Weller et al., Reference Weller, Lindstrom, De Grip and Wilson2009; Wilson et al., Reference Wilson, Nacsa, Hart, Weller and Vaney2011). To examine whether these differences extend to the overall patterns of NOS expression, we explored the expression pattern of nNOS and eNOS in the dorsal and ventral samples of retinal tissue. nNOS-positive amacrine cells in the dorsal retina had smaller somata (<7 µm vs. >10 µm in diameter, Fig. 5A, arrows) and often had vertical processes extending into the IPL (not shown). Target amacrine cells were found exclusively in the ventral retina as previously shown (Weller et al. Reference Weller, Lindstrom, De Grip and Wilson2009). Photoreceptor terminals were also labeled with anti-nNOS primarily in the ventral retina (Fig. 5B). Unlike for nNOS, the eNOS antibody did not reveal consistent differences between the dorsal and ventral retina (Fig. 5C and 5D). The appearance of a band of eNOS-LI in the IPL near the GCL (Fig. 5C) was variable but could be observed in both the dorsal and ventral retina (see Fig. 6K, 6N, and 6Q). The one exception is that we very rarely observed eNOS-LI an efferent synapse in the ventral retina (Fig. 4F, angled arrow).
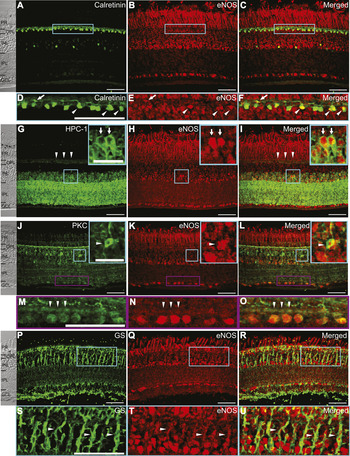
Identification of retinal cells expressing endothelial nitric oxide synthase-like immunoreactivity (eNOS-LI). (A–F) Images of anti-calretinin and anti-eNOS double-labeling. Some horizontal cell somata (arrowheads) and processes (arrows) were co-labeled with both antibodies (C) and (F). (G–I) Images of sections labeled with HPC-1 (G) and eNOS (H) antibodies and the merged image (I) indicate the co-labeled amacrine cells in the INL (arrows). Arrowheads (G and I) indicate HPC-1 label in the OPL. Boxed region in INL is shown in the inset. (J–O) Sections are labeled with anti-protein kinase C (anti-PKC) (J) anti-eNOS (K) and the merge of both (L). The arrowhead (inset, J–L) shows one bipolar cell body labeled with both antibodies. Boxed region in the INL is shown in the inset. Vertical arrows in (M–O) indicate a band at the border of IPL and GCL labeled with both antibodies. (P–U) Images of a retinal section with GS and eNOS antibody labeling. (S–U) Arrowheads indicate glia labeled with both antibodies. Some double-labeled elements are observed in the GCL. (A–C), (J–O), and (P–U) are derived from ventral retina and (G–I) are derived from dorsal retina. No differences in the labeling pattern for these antibodies were observed between dorsal and ventral retinas. Confocal settings and image adjustments were the same for all eNOS images. Scale bars are 50 µm (A–C, G–I, J-L, and P–R), and 20 µm (insets, D–F, M–O, and S–U).

eNOS-LI is expressed in multiple cell types in the chicken retina
To determine the cell types that showed eNOS-LI, we did double-labeling experiments with the eNOS antibody and four cell-type marker antibodies previously established for the chicken retina. Calretinin is a calcium-binding protein that can be expressed in the subsets of horizontal cells, bipolar cells, amacrine cells and ganglion cells (Ellis et al., Reference Ellis, Richards and Rogers1991). Calretinin-positive horizontal cells represent two (H1 and H3) of the four major classes of horizontal cells in the chicken retina (Fischer et al., Reference Fischer, Stanke, Aloisio, Hoy and Stell2007). In the present study we used a monoclonal calretinin antibody to identify horizontal cells. Calretinin antibody labeled horizontal cell bodies near the outer border of the INL and their processes in the OPL (Fig. 6A and 6D, arrowheads and arrows, respectively). We also observed labeling of additional cell bodies in the inner INL. Co-incubation with eNOS antibodies revealed a substantial overlap in labeling of the horizontal cell bodies (Fig. 6B–6F, arrowheads) as well as on some processes (arrows). A few amacrine cell bodies in the INL were also double-labeled.
To confirm that eNOS antibodies label amacrine cells in the INL of the chicken retina, we used a monoclonal HPC-1 antibody as an amacrine cell marker. HPC-1 labels the syntaxin 1 protein primarily in amacrine cells (Barnstable et al., Reference Barnstable, Hofstein and Akagawa1985) and in multiple species including chicken (Gleason et al., Reference Gleason, Borges and Wilson1993). HPC-1-labeling was strong in the INL and the IPL indicating labeling of amacrine cell bodies and processes, respectively. HPC-1 labeling was also observed in the OPL (Fig. 6G and 6I, arrowheads). Arrows in Fig. 6G–6I indicate two representative HPC-1-positive amacrine cells in the INL. All the amacrine cells that showed HPC-1 immunolabeling were also labeled with the eNOS antibody, suggesting that eNOS is broadly expressed in amacrine cells in the INL (Fig. 6H and 6I). We also noticed a weak double-labeled signal in the OPL; possibly due to the labeling of horizontal cell processes by HPC-1 that we have previously observed in the chicken retina (Gleason and Wilson, unpublished observation). In the GCL, eNOS labeled cells were observed but they were not double-labeled with the HPC-1 antibody suggesting that the eNOS-positive cells in the GCL are ganglion cells rather than displaced amacrine cells.
A monoclonal antibody raised against PKC recognizes the alpha and beta isoforms of the PKC and has been established as a marker for two populations of bipolar cells in the chicken (Koulen et al., Reference Koulen, Brandstatter, Kroger, Enz, Bormann and Wassle1997; Caminos et al., Reference Caminos, Velasco, Jarrin, Aijon and Lara1999). In order to examine the expression of eNOS in bipolar cells, we performed double-labeling experiment with eNOS and PKC antibodies (Fig. 6J–6O). The PKC antibody labeled a population of bipolar cell bodies in the INL (Fig. 6J, arrowhead), bipolar cell dendrites in the OPL and processes extending from the INL into the IPL. We also observed weaker labeling in other INL cell bodies, bands in the IPL and cells in the GCL. The co-labeling pattern with the eNOS antibodies demonstrated that bipolar cells expressing eNOS are rare (Fig. 6J–6L). One exception is shown in Fig. 6L, inset. This is consistent with the lack of DAF-FM labeled bipolar cell bodies observed in our experiments. Interestingly, anti-PKC also labeled the band that we frequently see with the eNOS antibody near the border of the IPL and the GCL (Fig. 6M–6O). This co-localization may indicate a highly localized overlap of expression in some bipolar cell terminals or a site where other eNOS positive processes interact with PKC-positive bipolar cells.
Müller cell end feet have been previously shown to be labeled by a monoclonal antibody raised against GS in the chicken retina (Norenberg et al., Reference Norenberg, Dutt and Reif-Lehrer1980). The GS antibody labeled Müller glia with an expression pattern that extended from the outer limiting membrane to the nerve fiber layer (Fig. 6P). Merged images of eNOS-LI and GS labeling support eNOS expression in Müller glia in the chicken retina (Fig. 6R and 6D, arrowheads). Overlap with eNOS-LI is seen in the INL (Fig. 6S–6U) but also extends into the GCL. Together, these results confirm the expression of eNOS-LI in the horizontal cells, amacrine cells and Müller cells in the chicken retina.
Discussion
By comparing the production of NO to the expression of nNOS and eNOS-LI, our results suggest a more wide-spread and complex role for NO than previously appreciated in the avian retina. The pattern of NO production under our standard conditions typically included photoreceptors, horizontal cells, efferent synapses, amacrine cells and cells in the ganglion cell layer (GCL). In some retinas, hotspots of NO production were observed that included horizontal cells and Müller cells. DAF signals were most wide-spread in photoreceptors and horizontal cells. Interestingly, neither the expression of nNOS immunoreactivity alone nor the expression of eNOS-LI alone could account for the pattern of NO production.
Horizontal cells and NO
We observed only very faint labeling for nNOS in the OPL and no horizontal cell body labeling was observed. Nonetheless, under our standard conditions, the DAF signal in the horizontal cells was strong and commonly observed. With different antibodies, nNOS expression has been demonstrated in the OPL processes in chicken (Fischer & Stell, Reference Fischer and Stell1999) and salamander retinas (Blom et al., Reference Blom, Blute and Eldred2009). In turtle and rat retina, nNOS has been observed in the horizontal cell processes at the electron microscope level (Haverkamp & Eldred, Reference Haverkamp and Eldred1998; Cao & Eldred, Reference Cao and Eldred2001). It is possible that in the chicken retina, nNOS is expressed in horizontal cells and is highly localized to processes but generates sufficient NO to diffuse throughout the cell. Alternatively, based on the more substantial expression of eNOS-LI in chicken horizontal cells, eNOS may generate the strong NO signal that we observed in our preparations.
Like DAF signals, NADPH diaphorase histochemistry does not discriminate among NOS subtypes (Dawson et al., Reference Dawson, Bredt, Fotuhi, Hwang and Snyder1991; Tracey et al., Reference Tracey, Nakane, Pollock and Forstermann1993). Strong NADPH diaphorase signals have been reported for horizontal cells in rabbit (Zemel et al., Reference Zemel, Eyal and Lei1996) carp (Weiler & Kewitz, Reference Weiler and Kewitz1993) and goldfish retinae (Liepe et al., Reference Liepe, Stone, Koistinaho and Copenhagen1994). Horizontal cell DAF signals have been reported in both the turtle and salamander retinas (Blute et al., Reference Blute, Lee and Eldred2000; Eldred & Blute, Reference Eldred and Blute2005) but the patterns in those species differ from what we see in the labeling observed in the single horizontal cells rather than the continuous array of horizontal cells that we find in the chicken retina. The DAF signal we observe in the horizontal cells appears to be well retained within the cells; however, coupling of the horizontal cells may permit spread of NO from cell to cell. The retention of NO within the horizontal cells implies that NO generated there has primarily cell-autonomous effects. Adding NO (DeVries & Schwartz, Reference DeVries and Schwartz1989; Lu & McMahon, Reference Lu and McMahon1997; Xin & Bloomfield, Reference Xin and Bloomfield2000) or arginine (McMahon & Ponomareva, Reference McMahon and Ponomareva1996) to the extracellular environment alters horizontal cell function and significantly, intracellular delivery of the NOS substrate L-arginine was demonstrated to reduce gap junctional conductance in the turtle retina (Miyachi et al., Reference Miyachi, Murakami and Nakaki1990). This cell autonomous action of arginine is consistent with our suggestion that horizontal cells are capable of producing NO via activation of eNOS.
The presence of a strong DAF signal in HEPES buffer and the absence of a horizontal cell DAF signal in bicarbonate buffer is an interesting observation that could be explained by the physiological differences in horizontal cells in the two buffer systems described by Hare & Owen (Reference Hare and Owen1998). Their experiments in the salamander horizontal cells demonstrated that HEPES-buffered solutions decreased the resting membrane potential to about −20 mV whereas in bicarbonate-buffered solutions the resting membrane potentials were about −50 mV. This observation raises the possibility that in HEPES, horizontal cell voltage-gated Ca2+ channels might be activated and that the resulting Ca2+ influx activated the production of NO. Furthermore, junctional conductance was increased in the HEPES-buffered solution which could contribute to the extensive DAF signal observed throughout the horizontal cell network. It is not clear why a similar pattern of DAF signal was not seen in the imaging experiments using HEPES-buffered solution in salamander retinal slices (Eldred & Blute, Reference Eldred and Blute2005) except that in those experiments, DAF loading and stimulation was done in slices of retina rather than the whole retina. The observations of Hare & Owen (Reference Hare and Owen1998) raise the possibility that our HEPES-buffered solution might alter the functional state of horizontal cells. Nonetheless, our results still provide evidence that horizontal cells have the capability to produce NO, most likely via the activation of eNOS.
Nitric oxide in Müller cells
In the chicken retina, we find eNOS-LI in Müller cells and a strong Müller cell DAF signal if the retina is loaded and processed in bicarbonate-buffered saline. We also observed strong Müller cell DAF signal associated with hot spots of horizontal cell signal under standard (HEPES-buffered) conditions. The key to these observations may lie in the Ca2+ elevations that Müller cells could be undergoing in the two conditions. It is well established that waves of Ca2+ elevations can occur spontaneously in the Müller cell network, but can also be initiated by multiple mechanisms including small mechanical deformations (5–10 µm), electrical stimulation, light and ATP (Newman & Zahs, Reference Newman and Zahs1997). The propagation of Ca2+ elevations from Müller cell to Müller cell is dependent up ATP release from Müller cells and binding to purinergic receptors on neighboring Müller cells (Newman, Reference Newman2001, Reference Newman2005). It is possible that the bicarbonate-buffered solution provided an environment that encouraged the release of ATP, promotion of Ca2+ elevations and subsequent activation of NOS. Interestingly, in experiments similar to ours involving DAF fixation in the salamander retina with HEPES-buffered solutions, no Müller cell DAF signal was reported (Eldred & Blute, Reference Eldred and Blute2005; Blom et al., Reference Blom, Blute and Eldred2009). Our observations of occasional DAF-positive Müller cell and horizontal cell show that hot spots might be due to our inadvertent stimulation of Müller cells to release ATP. Any ATP released from Müller cells might have the capacity to stimulate horizontal cells as well because it has been reported that horizontal cells in the mammalian retina express purinergic receptors (Ishii et al., Reference Ishii, Kaneda, Li, Rockland and Hashikawa2003; Puthussery & Fletcher, Reference Puthussery and Fletcher2004; Vessey & Fletcher, Reference Vessey and Fletcher2012). It is not clear; however, why horizontal cells would have strong DAF signals in hot spots with HEPES buffering but not in bicarbonate-buffered solutions. Nonetheless, these observations of Müller cell DAF signals raise the possibility that if Ca2+ waves occur in the Müller cell network of the chicken retina, then these waves might be sufficient to stimulate the production of NO via activation of eNOS. It has also been demonstrated that Müller cells produce strong NADPH diaphorase signals in quisqualate-treated chicken retina but not in untreated retina (Fischer & Stell, Reference Fischer and Stell1999). This report, together with our results, is consistent with the possibility that these cells can produce NO but that their NO-synthetic enzyme is suppressed or sequestered under more normal conditions.
Two potential NO systems in the avian retina
The sum of our DAF and immunnohistochemistry results suggest that there might be two broad systems of NO production in the chicken retina that subserve different types of signaling. The first system would modulate specific aspects of retinal circuitry to alter the properties of signal processing. For example, the NO-dependent reduction in gap junction coupling between horizontal cells (DeVries & Schwartz, Reference DeVries and Schwartz1989; Lu & McMahon, Reference Lu and McMahon1997; Xin & Bloomfield, Reference Xin and Bloomfield2000) reduces the receptive field size of these cells which in turn limits the sharing of information from photoreceptors. NO is also dominant in the centrifugal visual system that is prominent in ground-feeding birds. It has been hypothesized that this circuitry that loops between dorsal ganglion cells, the ION and the ventral target amacrine cells functions to detect looming shadows on the ground and to ultimately localize aerial predators (Wilson & Lindstrom, Reference Wilson and Lindstrom2011). Both efferent fibers from the ION and target amacrine cells strongly express nNOS. Thus, NO is a likely player in this visual function that could play a critical role in the animals survival.
With the exception of horizontal cells, DAF signals and eNOS-LI are a generally poor match under our standard conditions. For example, it is clear that the fraction of DAF-positive amacrine cells is generally lower than the fraction of amacrine cells expressing nNOS or eNOS-LI. While it is possible that this is due to some nonspecific binding of the eNOS antibody, the capability of eNOS+/nNOS− Müller cells to produce NO in bicarbonate-buffered solutions and in hot spots indicates that these cells are expressing an NO synthetic enzyme. We propose the alternative hypothesis that much of the eNOS-LI in cells other than horizontal cells represents enzyme that is either sequestered in sub-cellular organelles or is posttranslationally modified such that the enzyme is essentially dormant. eNOS is both myristolated and palmitoylated which supports its localization to plasmalemmal cavealoe (Garcia-Cardena et al., Reference Garcia-Cardena, Oh, Liu, Schnitzer and Sessa1996; Shaul et al., Reference Shaul, Smart, Robinson, German, Yuhanna, Ying, Anderson and Michel1996; reviewed in Michel & Vanhoutte, Reference Michel and Vanhoutte2010). Caveolae-associated proteins, caveolins, bind and inhibit the function of eNOS until the inhibition is reversed by the Ca2+/CaM complex (Ju et al., Reference Ju, Zou, Venema and Venema1997; Michel et al., Reference Michel, Feron, Sase, Prabhakar and Michel1997). eNOS can also be localized to subcellular organelles. NOS trafficking inducer protein (NOSTRIN) association activates the endocytic translocation of the enzyme from the plasma membrane to internal membranes (Zimmermann et al., Reference Zimmermann, Opitz, Dedio, Renne, Müller-Esterl and Oess2002; Icking et al., Reference Icking, Matt, Opitz, Wiesenthal, Müller-Esterl and Schilling2005). This translocation is associated with substantial suppression of eNOS activity when the cells experienced a Ca2+ elevation. Another way that eNOS can be suppressed is by association with NOSIP which targets eNOS to the cytoskeleton and inactivates it (Schleicher et al., Reference Schleicher, Brundin, Gross, Müller-Esterl and Oess2005). It might be that a more quiescent system has evolved to function during physiologically stressful or pathological conditions. In this vein, it is intriguing that the excitotoxin quisqulate dramatically increased the NADPH signal in chicken Müller cells (Fischer and Stell, Reference Fischer and Stell1999). Although under some conditions, NO can damage neural tissue by inducing necrosis or apoptosis, NO can also have protective effects via multiple mechanisms including activation of cGMP and S-nitrosation of caspases (Brown, Reference Brown2010). Further studies of the patterns of DAF signals engendered by a wider array of conditions will help to explore this possibility.
Acknowledgments
We would like to thank Emily McMains for her critical reading of this manuscript. This work was supported by NIH grant EY012204 to E.G.