1 Introduction
Particles transported by a turbulent flow are commonly found in many natural processes as well as industrial applications, such as the paper industry, crystallizers, fluidized beds, icy clouds and sandstorms. Proper knowledge of particle behaviour is vital for understating these phenomena. A large number of numerical and experimental studies concerning spherical particles can be found in the literature (e.g., Kulick, Fessler & Eaton Reference Kulick, Fessler and Eaton1994; Uhlmann Reference Uhlmann2008; Vowinckel, Kempe & Fröhlich Reference Vowinckel, Kempe and Fröhlich2014). Numerical simulation of turbulent flows with spherical particles is complex. In the case of non-spherical particles, the problem becomes even more complicated because the orientation and distribution of the particles play an important role and can significantly modify the flow behaviour. However, in practical applications, the transported particles often show a non-spherical shape.
In numerical studies, anisotropic particles are normally modelled by axisymmetric spheroids with either fibre-like (prolate) or disk-like (oblate) shape. With respect to spheroidal particles, many numerical studies are devoted to the behaviour of a single particle in shear flows. In this regard, Jeffery (Reference Jeffery1922) first derived an analytical solution for the rotation of a single spheroid in simple shear flow with the Stokes flow assumption. Drag and lift force expressions of spheroidal particles in the Stokes condition were later proposed by Brenner (Reference Brenner1964). Ding & Aidun (Reference Ding and Aidun2000) used the lattice Boltzmann method (LBM) to investigate the effect of inertia on the behaviour of a single suspended oblate spheroid in planar Couette flow with a Reynolds number smaller than 90. Yu, Phan-Thien & Tanner (Reference Yu, Phan-Thien and Tanner2007) used the distributed Lagrangian multiplier based fictitious domain (DLM/FD) model to test the rotation of oblate and prolate spheroids at moderate Reynolds numbers. The following rotation modes for oblate spheroids on increasing the Reynolds number from 0 to 192 were observed: Jeffery orbit, log rolling, inclined rolling, and motionless state. Huang et al. (Reference Huang, Yang, Krafczyk and Lu2012) extended the Reynolds number limit to 700 in their shear-flow studies. The effect of particle Reynolds number and its initial orientation on the final mode of rotation was discussed there. Oblate spheroid dynamics is found to be insensitive to the initial particle orientation. Rosén, Lundell & Aidun (Reference Rosén, Lundell and Aidun2014) investigated the rotational behaviour of neutrally buoyant prolate spheroidal particles in shear flows and the transitions between rotational states were studied. Particle inertia is found to drive the particle to rotate with its symmetry axis in the flow-gradient plane before experiencing a motionless state at a critical Reynolds number. Yang, Huang & Lu (Reference Yang, Huang and Lu2015) explored the sedimentation modes of a single oblate particle in a narrow tube. Four periodic and two steady sedimentation modes were identified where the blockage ratio is influencing. The effect of fluid and particle inertia on the rotation modes of an oblate spheroid was studied by Rosén et al. (Reference Rosén, Do-Quang, Aidun and Lundell2015). The particle aspect ratio and density and the domain size can alter the rotation mode of the particle based on the competition between particle and fluid inertia.
The next category of studies focuses on turbulent flows of spheroidal particle suspensions (Voth & Soldati Reference Voth and Soldati2017). However, in most of these studies, the particle volume fraction belongs to the dilute regime and the particle size is smaller than the smallest turbulence length scale (Kolmogorov scale). These so-called point particles can be either tracer (inertia free) or inertial particles. The velocity of tracer spheroidal particles matches the fluid velocity at the particle position, and particle rotation can be updated using Jeffery’s analytical solution (Ni, Ouellette & Voth Reference Ni, Ouellette and Voth2014; Challabotla, Zhao & Andersson Reference Challabotla, Zhao and Andersson2015c
). Inertial effects are important when particles do not respond to small turbulence fluctuations as massless tracer particles. For inertial point particles, the creeping flow condition in the vicinity of the particle is usually assumed. This holds only for low particle Reynolds number,
 $Re_{p}\ll 1$
. A Stokes drag model which depends on the slip velocity of the particle relative to the fluid is often used in this respect. Direct numerical simulation (DNS) of inertial point spheroidal particles in the dilute regime has already been reported in the numerical studies of Zhang et al. (Reference Zhang, Ahmadi, Fan and McLaughlin2001), Mortensen et al. (Reference Mortensen, Andersson, Gillissen and Boersma2008), and Marchioli & Soldati (Reference Marchioli and Soldati2013), to name only a few. In the dilute regime, the one-way coupling is justified. Therefore, particles are affected by the fluid, but the influence of particles on the fluid flow and particle–particle interactions are ignored (Elghobashi Reference Elghobashi2006). Based on the observations by Marchioli, Fantoni & Soldati (Reference Marchioli, Fantoni and Soldati2010), Challabotla, Zhao & Andersson (Reference Challabotla, Zhao and Andersson2015b
) and Challabotla et al. (Reference Challabotla, Zhao and Andersson2015c
), the orientation of tracer and inertial spheroids are completely different near the wall. Tracer prolate spheroids (fibres) orient with their symmetry axis in the streamwise direction, whereas the symmetry axis of oblate spheroids aligns in the wall-normal direction. On the other hand, inertial fibres demonstrate tumbling motion with the symmetry axis in the wall-normal/streamwise plane while oblate spheroids orient with their symmetry axis in the spanwise direction. When the particle Reynolds number is much larger than unity, other effects of inertia must be taken into account and empirical drag models should be used instead of the Stokes model (see, for example, Hölzer & Sommerfeld Reference Hölzer and Sommerfeld2008; Mandø & Rosendahl Reference Mandø and Rosendahl2010). Zhao et al. (Reference Zhao, Challabotla, Andersson and Variano2015) showed that high-inertia tiny oblate particles rotate isotropically about their major axes at the channel centre. Near the walls, strong orientation about the particle symmetry axis was reported.
If the solid-phase volume fraction
 $\unicode[STIX]{x1D719}$
is sufficiently high (
 $\unicode[STIX]{x1D719}\gtrsim 10^{-6}$
), the feedback on fluid flow due to the presence of particles should be considered. This requires a two-way coupled simulation. Modelling the momentum exchange between the particle and the fluid needs extra models. The effect of the torque of point particles on the fluid is usually estimated by closure models (Den Toonder et al.
Reference Den Toonder, Hulsen, Kuiken and Nieuwstadt1997), Monte Carlo simulations (Moosaie & Manhart Reference Moosaie and Manhart2015), or using an approach similar to force-coupling (Andersson, Zhao & Barri Reference Andersson, Zhao and Barri2012). By further increasing the concentration of the dispersed phase (
 $\unicode[STIX]{x1D719}\gtrsim 10^{-3}$
), inter-particle collisions become important and must be taken into account (four-way coupling). Zhao & van Wachem (Reference Zhao and van Wachem2013) performed a four-way coupling DNS of point prolate spheroids at
 $Re_{\unicode[STIX]{x1D70F}}=150$
and compared the results to spherical particles. The orientation trends of prolate spheroidal particles were comparable to those of the one-way coupled simulations of Marchioli et al. (Reference Marchioli, Fantoni and Soldati2010), with some differences. Zhao, George & van Wachem (Reference Zhao, George and van Wachem2015) reported drag reduction and attenuation of turbulence by using elongated point spheroids in a wall-bounded turbulent flow of
 $Re_{\unicode[STIX]{x1D70F}}=150$
.
When the particle size is larger than the Kolmogorov length scale (
 $L/\unicode[STIX]{x1D702}\gtrsim 10$
), the point-particle model is no longer valid. Modelling these finite-size particles needs tracking of the particle interface (Balachandar & Eaton Reference Balachandar and Eaton2010). DNS of turbulent flows with resolved spherical particles in the dilute or dense regimes has been performed before (see, for example, Pan & Banerjee Reference Pan and Banerjee1996; Fornari et al.
Reference Fornari, Formenti, Picano and Brandt2016; Eshghinejadfard et al.
Reference Eshghinejadfard, Abdelsamie, Hosseini and Thévenin2017a
). Based on the particle size, inertia and volume fraction, turbulence attenuation or augmentation is reported. However, DNS of finite-size anisotropic particles in wall-bounded turbulent flows is quite rare and new. In this respect, Do-Quang et al. (Reference Do-Quang, Amberg, Brethouwer and Johansson2014) studied the effect of finite-size cylindrical fibres on turbulent flow for volume fractions up to 0.4 %. The effect of the finite size of fibres on turbulence modulation and dynamics of the suspension was reported. Particles are found to reduce the fluid streamwise velocity fluctuations. The authors also observed that fibres tend to stay in the high-speed streaks. Ardekani et al. (Reference Ardekani, Costa, Breugem, Picano and Brandt2017) performed DNS of suspensions of oblate spheroids with particles of equivalent diameter
 $D_{eq}/H=1/9$
. Attenuation of the turbulence intensity in the presence of oblate spheroids and reduction of overall drag was observed in their study. Spherical particles of the same volume increased both the Reynolds stress and the drag. Eshghinejadfard, Hosseini & Thévenin (Reference Eshghinejadfard, Hosseini and Thévenin2017b
) simulated turbulent channel flows with prolate spheroids (volume fractions up to
 $\unicode[STIX]{x1D719}=1.5\,\%$
) and showed that prolate spheroids preferentially orient with their symmetry axis being mainly along the flow streamwise direction. Fluid statistics were found to be closer to the single-phase flow for the case of prolate spheroids compared to that for spheres.
A lattice Boltzmann simulation of fully resolved oblate spheroids in turbulent wall-bounded flows has never been published before to the best of our knowledge. With this motivation, we explore the behaviour of oblate spheroids in a turbulent channel flow by means of the LBM. The rest of this paper is organized as follows. Section 2 presents the numerical formulation for the flow and particle dynamics. Section 3 concerns the description of the simulation set-up and numerical validation of single-phase and particle-laden flows. The results are given in § 4, where the effect of particle type and concentration are investigated. Finally, conclusions are drawn in § 5.
2 Numerical formulation
2.1 Flow solver
In this paper, a single-relaxation-time (SRT) lattice Boltzmann method is used to simulate an incompressible Newtonian fluid flow. The SRT-LBM with a BGK collision term (Bhatnagar, Gross & Krook Reference Bhatnagar, Gross and Krook1954) includes the following evolution equation of distribution functions:
 $$\begin{eqnarray}f_{i}(\boldsymbol{x}+\boldsymbol{c}_{i}\unicode[STIX]{x0394}t,t+\unicode[STIX]{x0394}t)-f_{i}(\boldsymbol{x},t)=-\frac{1}{\unicode[STIX]{x1D70F}}[f_{i}(\boldsymbol{x},t)-f_{i}^{eq}(\boldsymbol{x},t)],\end{eqnarray}$$
where
 $f_{i}(\boldsymbol{x},t)$
is the distribution function of fictitious particles moving with speed
 $\boldsymbol{c}_{i}$
between lattice nodes;
 $f_{i}^{eq}(\boldsymbol{x},t)$
is the local equilibrium particle distribution function,
 $\unicode[STIX]{x1D70F}$
is the dimensionless relaxation time and
 $\unicode[STIX]{x0394}t$
is the time step. The equilibrium distribution function is given in a form of the truncated Maxwell–Boltzmann distribution:
 $$\begin{eqnarray}f_{i}^{eq}=\unicode[STIX]{x1D714}_{i}\unicode[STIX]{x1D70C}_{f}\left[1+{\displaystyle \frac{\boldsymbol{c}_{i}\boldsymbol{\cdot }\boldsymbol{u}}{c_{s}^{2}}}+{\displaystyle \frac{(\boldsymbol{c}_{i}\boldsymbol{\cdot }\boldsymbol{u})^{2}}{2c_{s}^{4}}}-{\displaystyle \frac{|\boldsymbol{u}|^{2}}{2c_{s}^{2}}}\right],\end{eqnarray}$$
where
 $\boldsymbol{u}$
is the macroscopic velocity vector,
 $\unicode[STIX]{x1D70C}_{f}$
is the fluid density,
 $\unicode[STIX]{x1D714}_{i}$
is the weight associated with the velocity
 $\boldsymbol{c}_{i}$
, and the sound speed
 $c_{s}=1/\sqrt{3}$
. The relaxation time (
 $\unicode[STIX]{x1D70F}$
) is related to the fluid kinematic lattice viscosity,
 $\unicode[STIX]{x1D708}$
, through
 $$\begin{eqnarray}\unicode[STIX]{x1D708}=(\unicode[STIX]{x1D70F}-0.5)c_{s}^{2}\unicode[STIX]{x0394}t.\end{eqnarray}$$
Macroscopic properties (density and velocity) are computed from the zeroth and first moment of distribution function:
 $$\begin{eqnarray}\displaystyle & \displaystyle \unicode[STIX]{x1D70C}_{f}=\mathop{\sum }_{i}f_{i}, & \displaystyle\end{eqnarray}$$
 $$\begin{eqnarray}\displaystyle & \displaystyle \unicode[STIX]{x1D70C}_{f}\boldsymbol{u}=\mathop{\sum }_{i}\boldsymbol{c}_{i}\,f_{i}. & \displaystyle\end{eqnarray}$$
In the current study a D3Q19 (19 discrete velocity vectors) stencil is used. To incorporate the effect of particle–fluid interaction force on the flow field, the force scheme of Shan & Chen (Reference Shan and Chen1993) is adopted here. In this model, the equilibrium velocity in (2.2) is shifted by using
 $\boldsymbol{v}$
instead of
 $\boldsymbol{u}$
:
 $$\begin{eqnarray}\boldsymbol{v}=\boldsymbol{u}+{\displaystyle \frac{\unicode[STIX]{x1D70F}}{\unicode[STIX]{x1D70C}_{f}}}\boldsymbol{F}=\boldsymbol{u}+\unicode[STIX]{x1D70F}\boldsymbol{f},\end{eqnarray}$$
where
 $\boldsymbol{f}$
is the force density due to the presence of particles, which is computed by the direct forcing-immersed boundary method (IBM) (Peskin Reference Peskin2002; Feng & Michaelides Reference Feng and Michaelides2005).
2.2 Immersed boundary method
In IBM, a fixed Eulerian mesh is used for the flow field covering both the inside and outside of the particle, while a set of Lagrangian points are used to track the particle boundary. The force term on each Lagrangian point is computed as (Uhlmann Reference Uhlmann2005)
 $$\begin{eqnarray}\boldsymbol{f}_{l}^{n}={\displaystyle \frac{\boldsymbol{U}^{d}-\boldsymbol{u}^{noF}}{\unicode[STIX]{x0394}t}},\end{eqnarray}$$
where
 $\boldsymbol{u}^{noF}$
is the fluid velocity interpolated to each Lagrangian point, and
 $\boldsymbol{U}^{d}$
is the desired particle velocity at the same Lagrangian point.
 $\boldsymbol{u}^{noF}$
is calculated using the discrete delta function based on the location of Eulerian
 $(\boldsymbol{x}_{i,j,k})$
and Lagrangian
 $(\boldsymbol{X}_{l})$
points:
 $$\begin{eqnarray}\boldsymbol{u}^{noF}=\mathop{\sum }_{i,j,k}\boldsymbol{u}_{i,j,k}D(\boldsymbol{x}_{i,j,k}-\boldsymbol{X}_{l})(\unicode[STIX]{x0394}h)^{3},\end{eqnarray}$$
where
 $\unicode[STIX]{x0394}h$
is the uniform lattice size (
 $=1$
) and
 $D$
is the discrete delta function. The final step is spreading the force from the Lagrangian points back onto the Eulerian grid. This is achieved using the delta function over the immersed object:
 $$\begin{eqnarray}\boldsymbol{f}_{i,j,k}=\mathop{\sum }_{i,j,k}\boldsymbol{f}_{l}D(\boldsymbol{x}_{i,j,k}-\boldsymbol{X}_{l})\unicode[STIX]{x0394}S_{l}\unicode[STIX]{x0394}h,\end{eqnarray}$$
with
 $\unicode[STIX]{x0394}S_{l}$
being the area of the relevant Lagrangian boundary point segment. This force term is then applied to the flow field equations via (2.6).
2.3 Particle dynamics
The translational and rotational motion of one single particle obey the following equations:
 $$\begin{eqnarray}\displaystyle & \displaystyle \boldsymbol{F}=M_{p}{\displaystyle \frac{\text{d}\boldsymbol{U}_{p}}{\text{d}t}}, & \displaystyle\end{eqnarray}$$
 $$\begin{eqnarray}\displaystyle & \left.\begin{array}{@{}c@{}}\displaystyle T_{x}^{\prime }=I_{p,xx}{\displaystyle \frac{\text{d}\unicode[STIX]{x1D6FA}_{p,x}^{\prime }}{\text{d}t}}+\unicode[STIX]{x1D6FA}_{p,z}^{\prime }\unicode[STIX]{x1D6FA}_{p,y}^{\prime }(I_{p,zz}-I_{p,yy}),\\ \displaystyle T_{y}^{\prime }=I_{p,yy}{\displaystyle \frac{\text{d}\unicode[STIX]{x1D6FA}_{p,y}^{\prime }}{\text{d}t}}+\unicode[STIX]{x1D6FA}_{p,x}^{\prime }\unicode[STIX]{x1D6FA}_{p,z}^{\prime }(I_{p,xx}-I_{p,zz}),\\ \displaystyle T_{z}^{\prime }=I_{p,zz}{\displaystyle \frac{\text{d}\unicode[STIX]{x1D6FA}_{p,z}^{\prime }}{\text{d}t}}+\unicode[STIX]{x1D6FA}_{p,y}^{\prime }\unicode[STIX]{x1D6FA}_{p,x}^{\prime }(I_{p,yy}-I_{p,xx}),\end{array}\right\} & \displaystyle\end{eqnarray}$$
where
 $\boldsymbol{F}$
is the total force exerted on the particle including the force from the fluid, internal fluid mass and repulsive force due to particle–particle and particle–wall collisions.
 $\boldsymbol{U}_{p}$
and
 $\unicode[STIX]{x1D6FA}_{p}^{\prime }$
denote the particle translational and rotational velocity, respectively. Here,
 $T^{\prime }$
is the total torque on particle centre,
 $M_{p}$
is the particle mass, and
 $I_{p}$
is the particle mass moment of inertia. The oblate spheroid surface is governed through
 $$\begin{eqnarray}\frac{x^{\prime 2}}{a^{2}}+\frac{y^{\prime 2}}{b^{2}}+\frac{z^{\prime 2}}{b^{2}}=1,\end{eqnarray}$$
where (
 $x^{\prime },y^{\prime },z^{\prime }$
) denotes a body-fixed coordinate system and
 $a$
and
 $b$
are the radii of the particle (
 $a<b$
). The particle aspect ratio is defined as
 $\unicode[STIX]{x1D706}=a/b<1$
for oblate spheroids. Equation (2.11) is written in the body-fixed frame. Here we use the concept of quaternions to address the rotation of oblate spheroids. To solve (2.11), four quaternions are introduced:
 $q=[q_{0},q_{1},q_{2},q_{3}]$
. Quaternion values depend on the particle orientation, and are represented by Euler angles (
 $\unicode[STIX]{x1D719},\unicode[STIX]{x1D703},\unicode[STIX]{x1D713}$
). These four quaternion parameters are defined as
 $$\begin{eqnarray}\displaystyle & q_{0}=\cos (0.5\unicode[STIX]{x1D703})\cos (0.5(\unicode[STIX]{x1D719}+\unicode[STIX]{x1D713})), & \displaystyle\end{eqnarray}$$
 $$\begin{eqnarray}\displaystyle & q_{1}=\sin (0.5\unicode[STIX]{x1D703})\cos (0.5(\unicode[STIX]{x1D719}-\unicode[STIX]{x1D713})), & \displaystyle\end{eqnarray}$$
 $$\begin{eqnarray}\displaystyle & q_{2}=\sin (0.5\unicode[STIX]{x1D703})\sin (0.5(\unicode[STIX]{x1D719}-\unicode[STIX]{x1D713})), & \displaystyle\end{eqnarray}$$
 $$\begin{eqnarray}\displaystyle & q_{3}=\cos (0.5\unicode[STIX]{x1D703})\sin (0.5(\unicode[STIX]{x1D719}+\unicode[STIX]{x1D713})). & \displaystyle\end{eqnarray}$$
Transformation from the inertial (world) frame to the body-fixed particle frame is performed using matrix
 $\unicode[STIX]{x1D648}$
, which is constructed from the quaternion values:
 $$\begin{eqnarray}\unicode[STIX]{x1D648}=\left[\begin{array}{@{}ccc@{}}q_{0}^{2}+q_{1}^{2}-q_{2}^{2}-q_{3}^{2} & 2(q_{1}q_{2}+q_{0}q_{3}) & 2(q_{1}q_{3}-q_{0}q_{2})\\ 2(q_{1}q_{2}-q_{0}q_{3}) & q_{0}^{2}-q_{1}^{2}+q_{2}^{2}-q_{3}^{2} & 2(q_{2}q_{3}+q_{0}q_{1})\\ 2(q_{1}q_{3}+q_{0}q_{2}) & 2(q_{2}q_{3}-q_{0}q_{1}) & q_{0}^{2}-q_{1}^{2}-q_{2}^{2}+q_{3}^{2}\end{array}\right].\end{eqnarray}$$
Thus, torque and rotational velocity can be transferred between two coordinate systems:
 $$\begin{eqnarray}\displaystyle & T^{\prime }=\unicode[STIX]{x1D648}T, & \displaystyle\end{eqnarray}$$
 $$\begin{eqnarray}\displaystyle & \unicode[STIX]{x1D6FA}^{\prime }=\unicode[STIX]{x1D648}\unicode[STIX]{x1D6FA}. & \displaystyle\end{eqnarray}$$
The evolution of the quaternion parameters is governed by (2.20)
 $$\begin{eqnarray}\dot{q}=\left[\begin{array}{@{}c@{}}\dot{q}_{0}\\ \dot{q}_{1}\\ \dot{q}_{2}\\ \dot{q}_{3}\end{array}\right]=\frac{1}{2}\left[\begin{array}{@{}cccc@{}}q_{0} & -q_{1} & -q_{2} & -q_{3}\\ q_{1} & q_{0} & -q_{3} & q_{2}\\ q_{2} & q_{3} & q_{0} & -q_{1}\\ q_{3} & -q_{2} & q_{1} & q_{0}\end{array}\right]\left[\begin{array}{@{}c@{}}0\\ \unicode[STIX]{x1D6FA}_{x}^{\prime }\\ \unicode[STIX]{x1D6FA}_{y}^{\prime }\\ \unicode[STIX]{x1D6FA}_{z}^{\prime }\end{array}\right].\end{eqnarray}$$
In practice, torques are first transformed from the inertial to the body-fixed coordinate using (2.18). Then, (2.11) together with (2.20) are solved using a fourth-order Runge–Kutta integration algorithm to update each quaternion (
 $q$
) and the angular velocity (
 $\unicode[STIX]{x1D6FA}^{\prime }$
) in the body-fixed coordinate system. Then, the angular rotation velocity in the inertial coordinate (
 $\unicode[STIX]{x1D6FA}$
) is obtained by (2.19) using the inverse of matrix
 $\unicode[STIX]{x1D648}$
. Finally, the location of each Lagrangian point can be updated by
 $\boldsymbol{X}=\unicode[STIX]{x1D648}^{-1}\boldsymbol{X}^{\prime }$
.
3 Simulation set-up and validation
LBM–DNS is employed to simulate a turbulent channel flow at Reynolds number
 $Re_{\unicode[STIX]{x1D70F}}=u_{\unicode[STIX]{x1D70F}}H/\unicode[STIX]{x1D708}=180$
based on the friction velocity (
 $u_{\unicode[STIX]{x1D70F}}=(\unicode[STIX]{x1D70F}_{w}/\unicode[STIX]{x1D70C}_{f})^{0.5}$
) and channel half-height (
 $H$
). Here,
 $\unicode[STIX]{x1D70F}_{w}$
is the shear stress at the wall. Two parallel walls are located at a distance of
 $2H$
from each other (with
 $H=130$
) and streamwise and spanwise directions are periodic. The domain size is
 $L_{x}=4.6H$
,
 $L_{y}=2H$
and
 $L_{z}=2H$
, corresponding to the streamwise
 $x$
, wall-normal
 $y$
and spanwise
 $z$
directions, respectively. Domain discretization is performed by
 $600\times 260\times 260$
lattice nodes in the streamwise, spanwise and wall-normal directions, respectively. The same driving force is used for the single-phase and particle-laden flows. Simulations are performed on 150 parallel cores (AMD Opteron 2.1 GHz and 16 GB main memory) using the message-passing interface (MPI).
Mean streamwise fluid velocity
 $U^{+}$
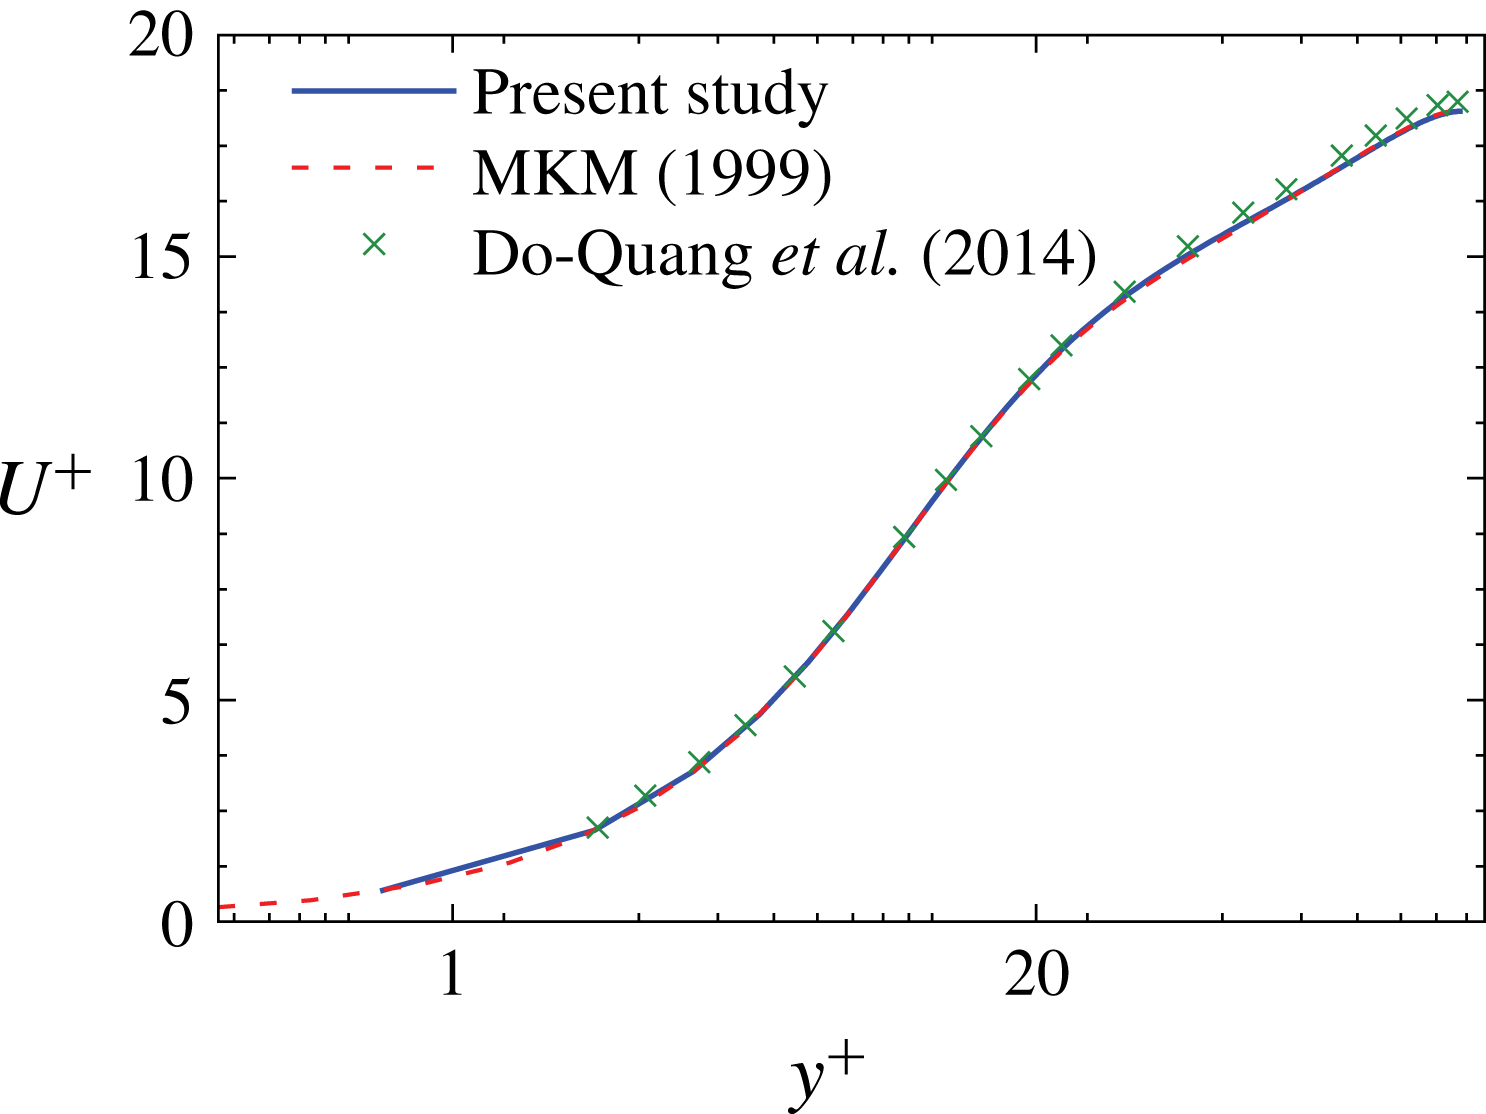
of the single-phase channel flow.

Oblate spheroid and spherical particles are used in the simulations to evaluate fluid and particle statistics and make comparisons. Particle volume fractions vary between
 $\unicode[STIX]{x1D719}=5\,\%$
and 10 %. Particle–particle and particle–wall interactions are modelled for these dense regimes. Lubrication models are used (Ladd & Verberg Reference Ladd and Verberg2001) by assuming interacting spheroids as spheres with the same volume and a radius equal to the local spheroid curvature at the point of collision. For particle collisions, we use a soft-sphere collision model (i.e. an artificial repulsive force), similar to Glowinski et al. (Reference Glowinski, Pan, Hesla and Joseph1999), to prevent particle penetration. Due to the large number of particles, a Verlet approach is used to create a neighbour list and reduce the number of checks for probable particle–particle collisions based on the particle location, size, and maximum travelling distance between time steps (Verlet Reference Verlet1967). Simulations are performed using the in-house LB solver (ALBORZ) developed in the LSS group, University of Magdeburg.
3.1 Single-phase flow validation
For validation of the single-phase flow, the normalized mean streamwise velocity (
 $U^{+}=\overline{u}_{f}/u_{\unicode[STIX]{x1D70F}}$
) versus normalized distance from the wall (
 $y^{+}=yu_{\unicode[STIX]{x1D70F}}/\unicode[STIX]{x1D708}$
) is plotted in figure 1 and compared to the benchmark study of Moser, Kim & Mansour (Reference Moser, Kim and Mansour1999) (MKM). The entropic lattice Boltzmann study of Do-Quang et al. (Reference Do-Quang, Amberg, Brethouwer and Johansson2014), who used a grid size of
 $710\times 180\times 198$
, is also shown. Very good agreement of the current study and the benchmark data (MKM) is observed in terms of mean fluid streamwise velocity. The results of Do-Quang et al. (Reference Do-Quang, Amberg, Brethouwer and Johansson2014) are slightly overpredicted because of fewer computational cells in the wall-normal (
 $y$
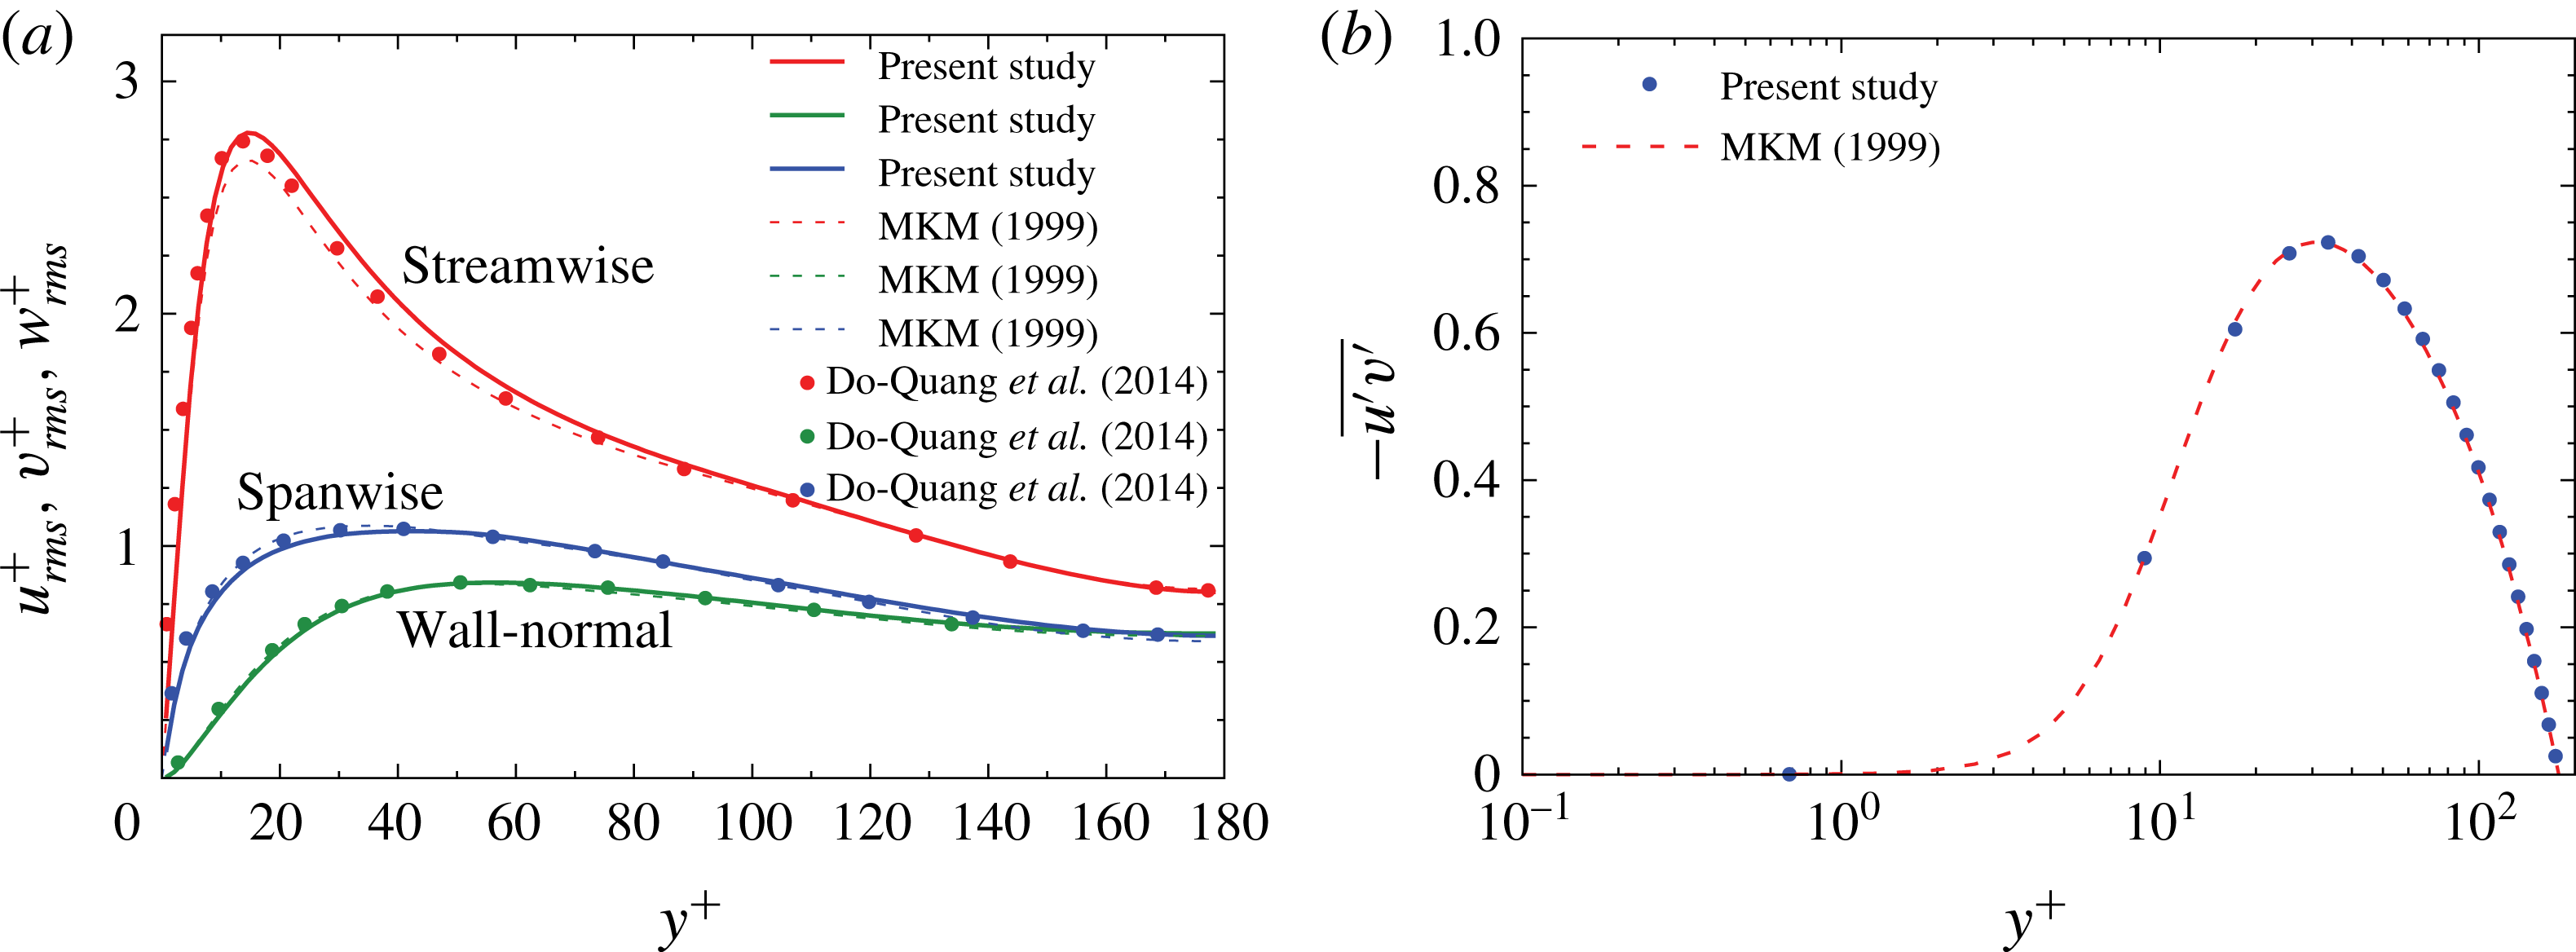
) direction. The root mean square (r.m.s.) of the velocity fluctuations is shown in figure 2(a). The agreement of the current LB simulations is generally good. Near-wall data are also very well predicted. The slight overprediction of the streamwise velocity fluctuations is due to the second-order accuracy of the LBM in space. At the same time, the agreement of the Reynolds shear stress (figure 2
b) is excellent. Considering that the focus is set here on comparisons between single-phase and two-phase flows more than on absolute values, and because of reasonable computational cost, a grid size of
 $600\times 260\times 260$
is used in the rest of this paper.
Single-phase statistics for (a) r.m.s. of the fluid velocity fluctuations and (b) Reynolds shear stress.

3.2 Oblate particle in shear flow of low Reynolds number
Validation of the rotation of a single oblate spheroid in a shear flow with low Reynolds number is performed in this part. A neutrally buoyant oblate spheroid is located at the centre of a Couette flow between two walls with its major axis being parallel to the vorticity axis. The two walls move in opposite directions. Periodic boundary conditions are used for other boundaries of the domain. The domain size is
 $5D_{eq}\times 5D_{eq}\times 5D_{eq}$
, where
 $D_{eq}$
is the equivalent diameter of the particle, which is discretized by 20 grid points (the same particle size as simulations of § 4). The particle aspect ratio is
 $\unicode[STIX]{x1D706}=1/3$
. Jeffery (Reference Jeffery1922) derived an analytical solution for the angular velocity of the particle for low Reynolds numbers. In this case, the particle Reynolds number is defined based on the shear rate
 $G$
:
 $$\begin{eqnarray}\displaystyle & Re_{p}=GD_{eq}^{2}/\unicode[STIX]{x1D708}, & \displaystyle\end{eqnarray}$$
 $$\begin{eqnarray}\displaystyle & G=2U_{w}/N_{y}. & \displaystyle\end{eqnarray}$$
Here,
 $U_{w}$
is the speed of walls and
 $N_{y}$
is their distance. The particle Reynolds number is 0.5 in the simulations.
Jeffery (Reference Jeffery1922) showed that the rotation angle,
 $\unicode[STIX]{x1D711}$
, and the angular rate of rotation,
 $\dot{\unicode[STIX]{x1D711}}$
, when one of the principal axes of the ellipsoid is kept parallel to the vorticity vector in a shear flow without inertia, read
 $$\begin{eqnarray}\displaystyle & \displaystyle \cot \unicode[STIX]{x1D711}=-\unicode[STIX]{x1D706}\cot \left(\frac{\unicode[STIX]{x1D706}Gt}{\unicode[STIX]{x1D706}^{2}+1}\right), & \displaystyle\end{eqnarray}$$
 $$\begin{eqnarray}\displaystyle & \displaystyle \dot{\unicode[STIX]{x1D711}}=-\frac{G}{\unicode[STIX]{x1D706}^{2}+1}(\unicode[STIX]{x1D706}^{2}\sin ^{2}\unicode[STIX]{x1D711}+\cos ^{2}\unicode[STIX]{x1D711}). & \displaystyle\end{eqnarray}$$
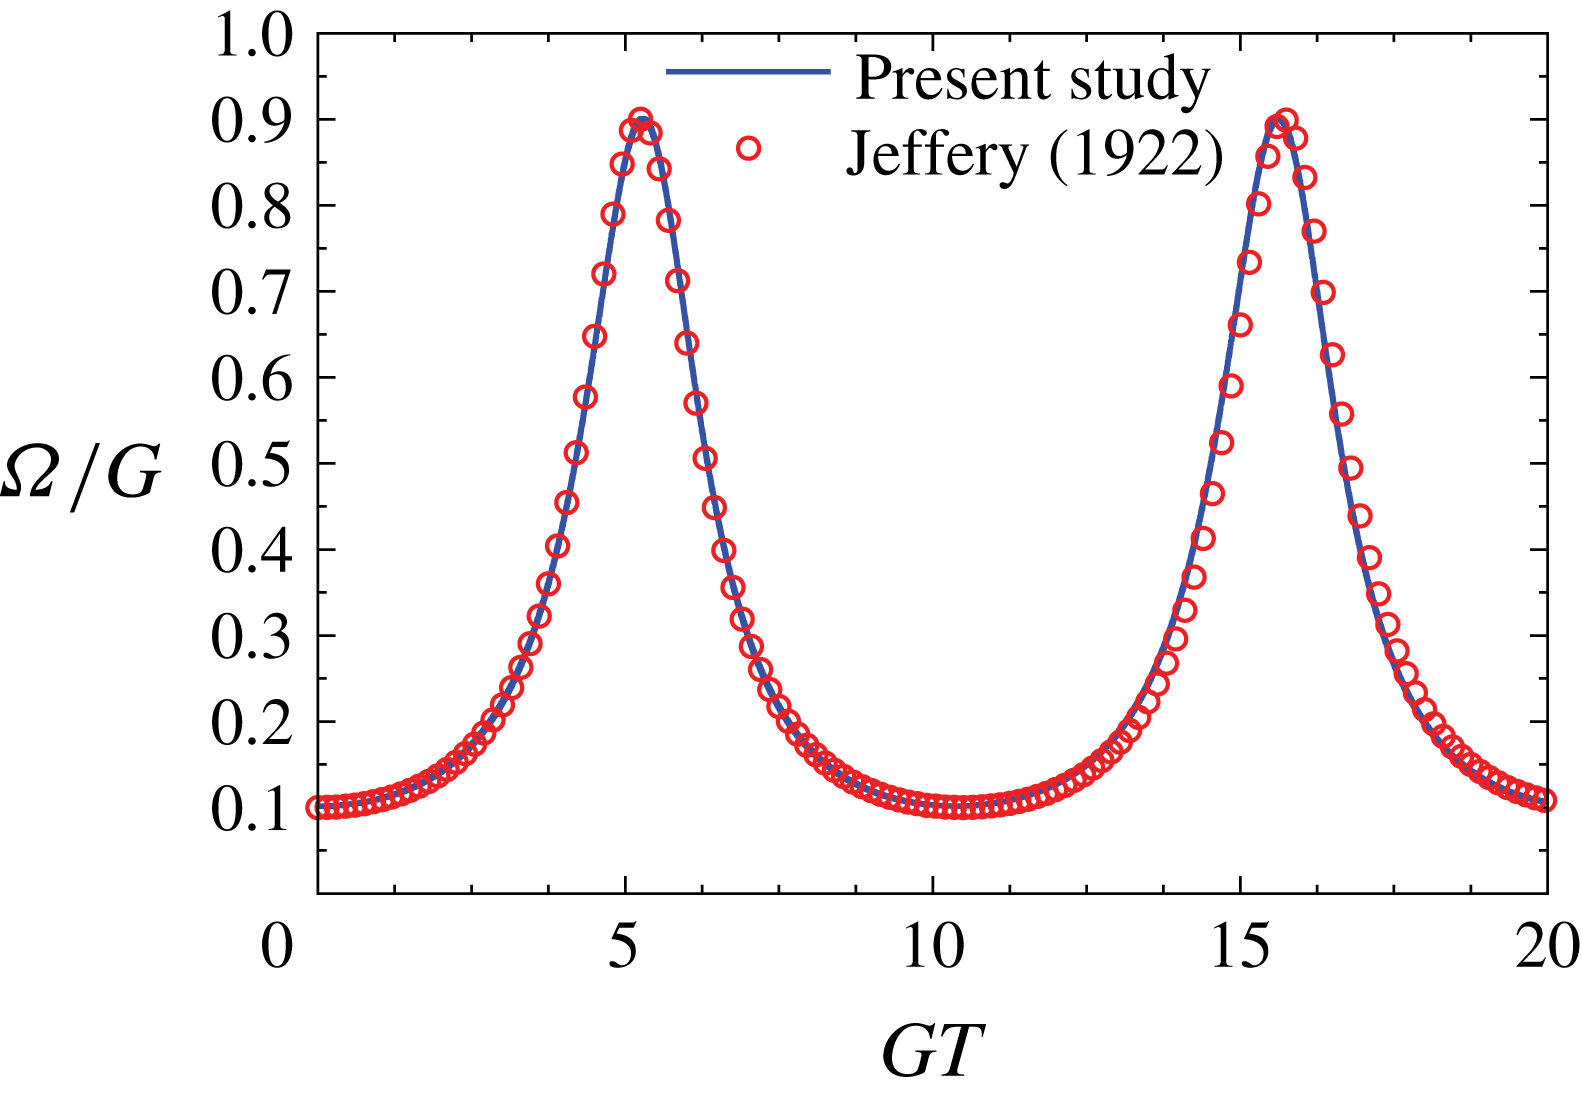
Our simulation result for the angular velocity of the particle versus time is shown in figure 3. It is seen that current data has good agreement with the analytical solution. The particle experiences an oscillating angular velocity during its tumbling motion around the vorticity axis.
Non-dimensional angular velocity of an oblate spheroid in a shear flow versus non-dimensional time compared with the analytical solution of Jeffery (Reference Jeffery1922).

3.3 Oblate particle in shear flow of high Reynolds number
In order to validate the results for higher particle Reynolds numbers, a comparison with the results of Mao & Alexeev (Reference Mao and Alexeev2014) is performed. Again a particle is located in a Couette flow between two parallel walls. The domain size is
 $200\times 80\times 40$
lattice nodes and the particle semi-minor and semi-major axes are 8 and 16 lattice units, respectively. The period of a tumbling motion of the particle is measured. For a particle Reynolds number of
 $Re_{p}=60$
a tumbling period of
 $GT=44.5$
is obtained. This is in very good agreement with the data of Mao & Alexeev (Reference Mao and Alexeev2014), who reported a value of 44.6.
3.4 Oblate particle in cross-flow
In this part the rotation of an oblate particle in a cross-flow will be examined. An oblate particle of aspect ratio
 $\unicode[STIX]{x1D706}=1/2$
and major and minor axes of
 $L_{1}=2b=16\unicode[STIX]{x0394}x$
and
 $L_{2}=2a=8\unicode[STIX]{x0394}x$
, respectively, is located in a domain with a size of
 $17L_{1}\times 8L_{1}\times 8L_{1}$
. The particle is located at
 $x=5L_{1}$
,
 $y=4L_{1}$
and
 $z=4L_{1}$
. A uniform streamwise velocity is applied at the inlet (
 $x=0$
) and a zero-gradient boundary condition is used on the outlet (
 $x=N_{x}$
). The two parallel walls are located on the upper and lower sides of the domain and they move with the same speed as the inlet velocity. In the spanwise direction, periodic boundary conditions are used. The particle position is fixed but it can freely rotate. The particle is initially inclined and has an angle of
 $\unicode[STIX]{x1D703}_{0}=\unicode[STIX]{x03C0}/4$
with respect to the
 $y$
-axis. The particle Reynolds number based on the particle equivalent diameter (
 $D_{eq}$
) and uniform velocity at the inlet (
 $U_{0}$
) is 30.2. Particle density varies between 2 and 16.
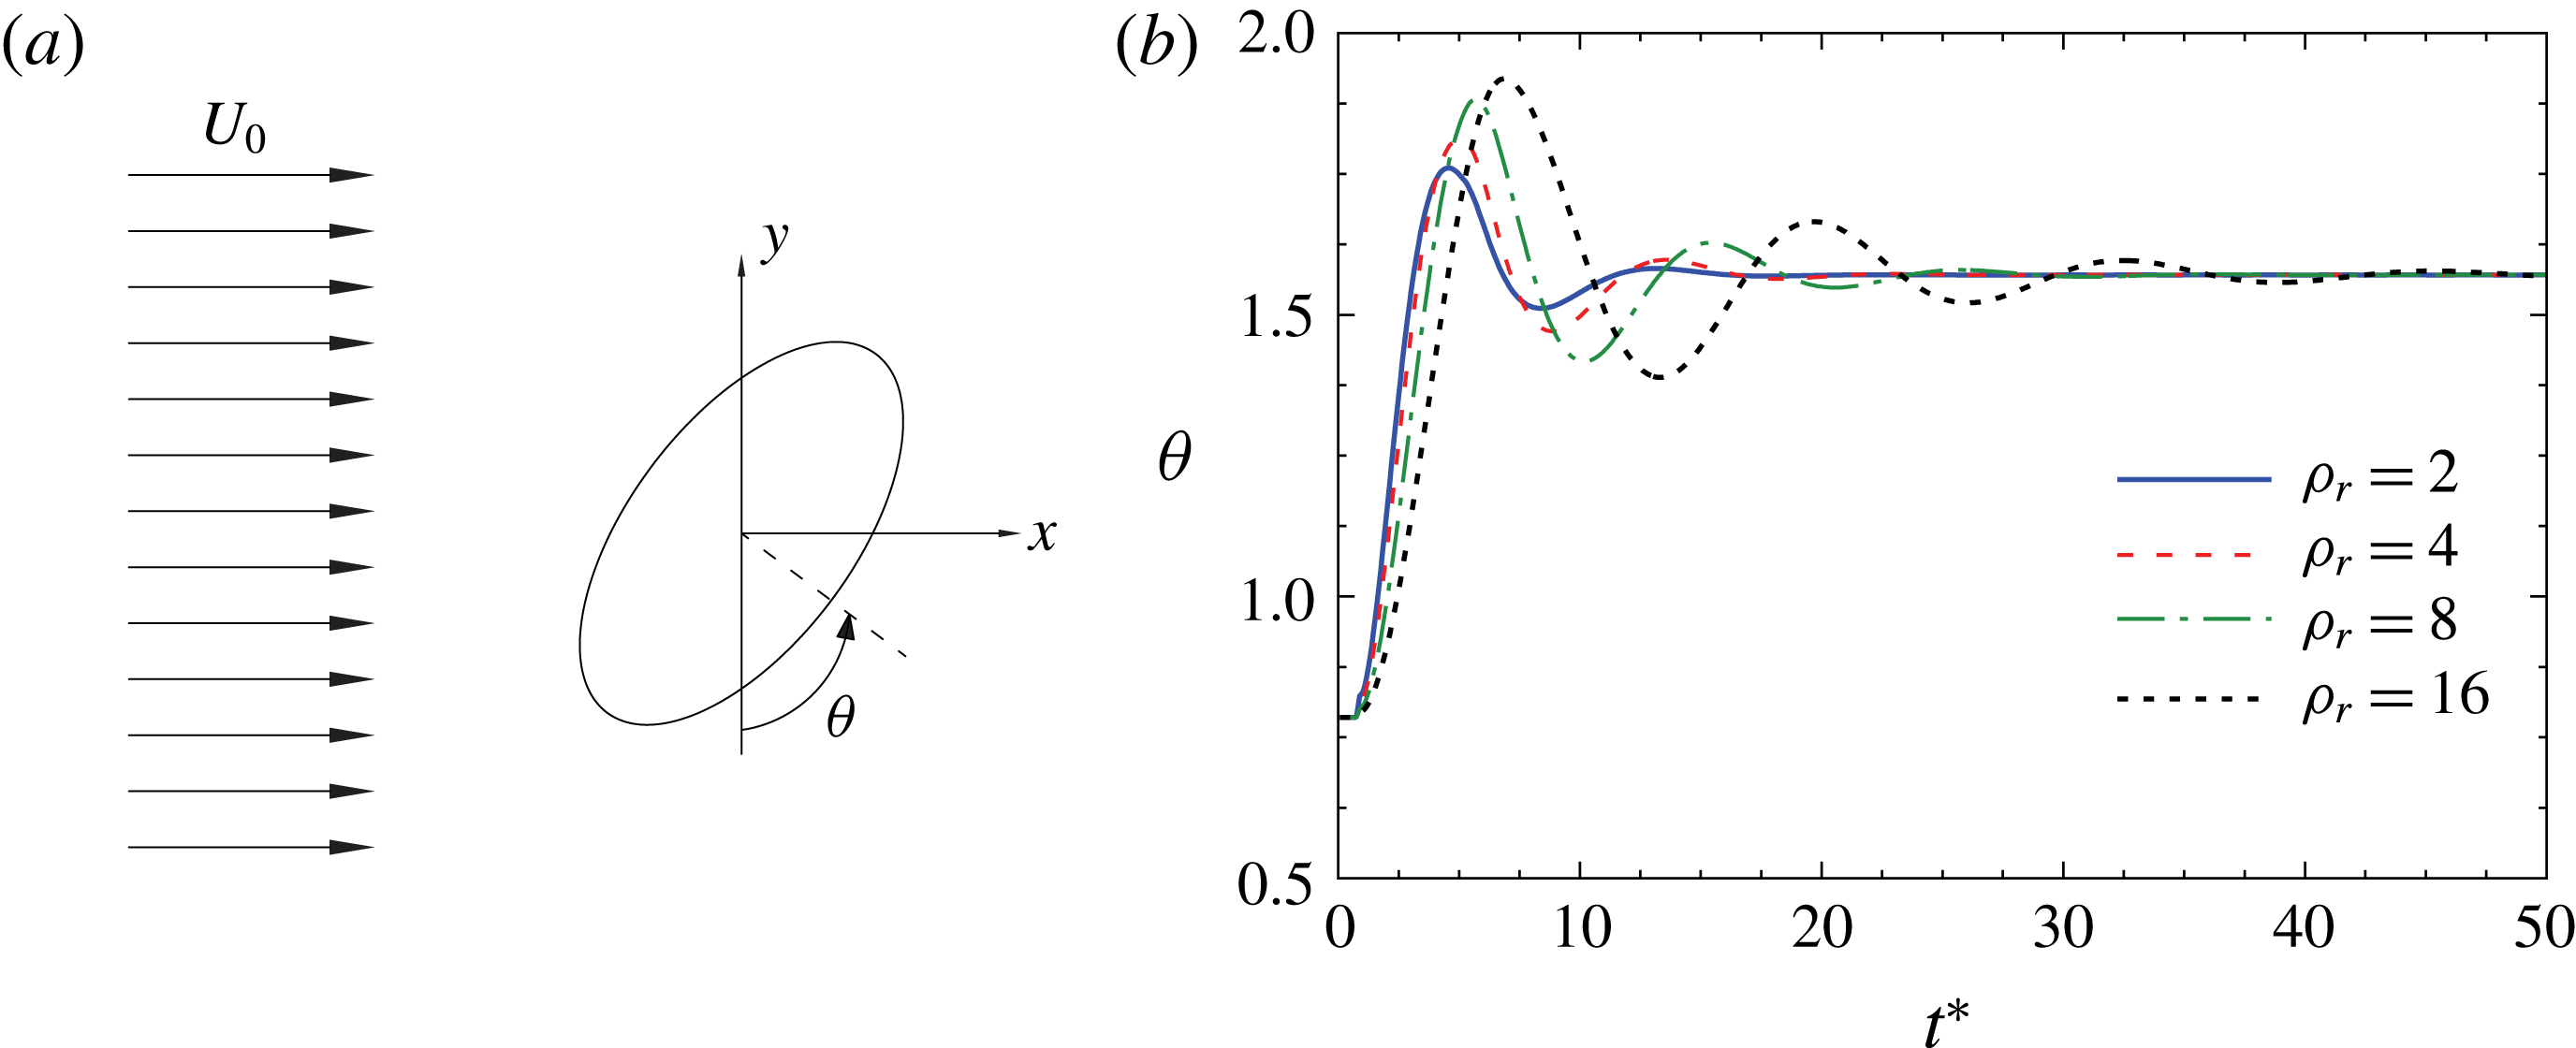
In this configuration, it is known from previous studies that regardless of the initial particle orientation, its symmetry axis finally gets aligned with the streamwise direction (Clift, Grace & Weber Reference Clift, Grace and Weber2005; Kempe, Schwarz & Fröhlich Reference Kempe, Schwarz and Fröhlich2009). The time evolution of the angle between the particle symmetry axis and streamwise direction is depicted in figure 4, where dimensionless time is
 $t^{\ast }=tU_{0}/D_{eq}$
. It is observed that the amplitude of oscillations decreases with time for each case and the particle finally orients itself with its symmetry axis along the streamwise direction (
 $\unicode[STIX]{x1D703}=\unicode[STIX]{x03C0}/2$
). On increasing the density, the period of oscillations increases and the particle requires a longer time to reach the final steady state. Increasing the density leads also to higher amplitudes of oscillation. These observations are in agreement with the reported behaviour in the literature (Clift et al.
Reference Clift, Grace and Weber2005; Kempe et al.
Reference Kempe, Schwarz and Fröhlich2009).
(a) Schematic of the orientation angle of an oblate spheroid in a cross-flow, (b) time history of the orientation angle.

All the results of § 3 confirm the validity of the current LB–IB approach for treatment of particle-laden flows. In addition to these examples, other validation cases of the LB code concerning interaction with non-spherical particles are documented (Eshghinejadfard et al. Reference Eshghinejadfard, Abdelsamie, Janiga and Thévenin2016, Reference Eshghinejadfard, Hosseini and Thévenin2017b ).
4 Results and discussion
In this section, the effect of particle shape (oblate P1 or sphere P2) as well as the concentration of oblate particles on the fluid and particle statistics will be investigated. Relevant particle parameters are listed in table 1, where
 $D_{eq}$
is the equivalent diameter of a sphere of the same volume and
 $\unicode[STIX]{x1D70C}_{p}$
is the particle density. In this section, we try to illustrate the mechanism of drag reduction by oblate spheroids and explain the differences with respect to polymers.
Parameters of particles.

4.1 Fluid statistics
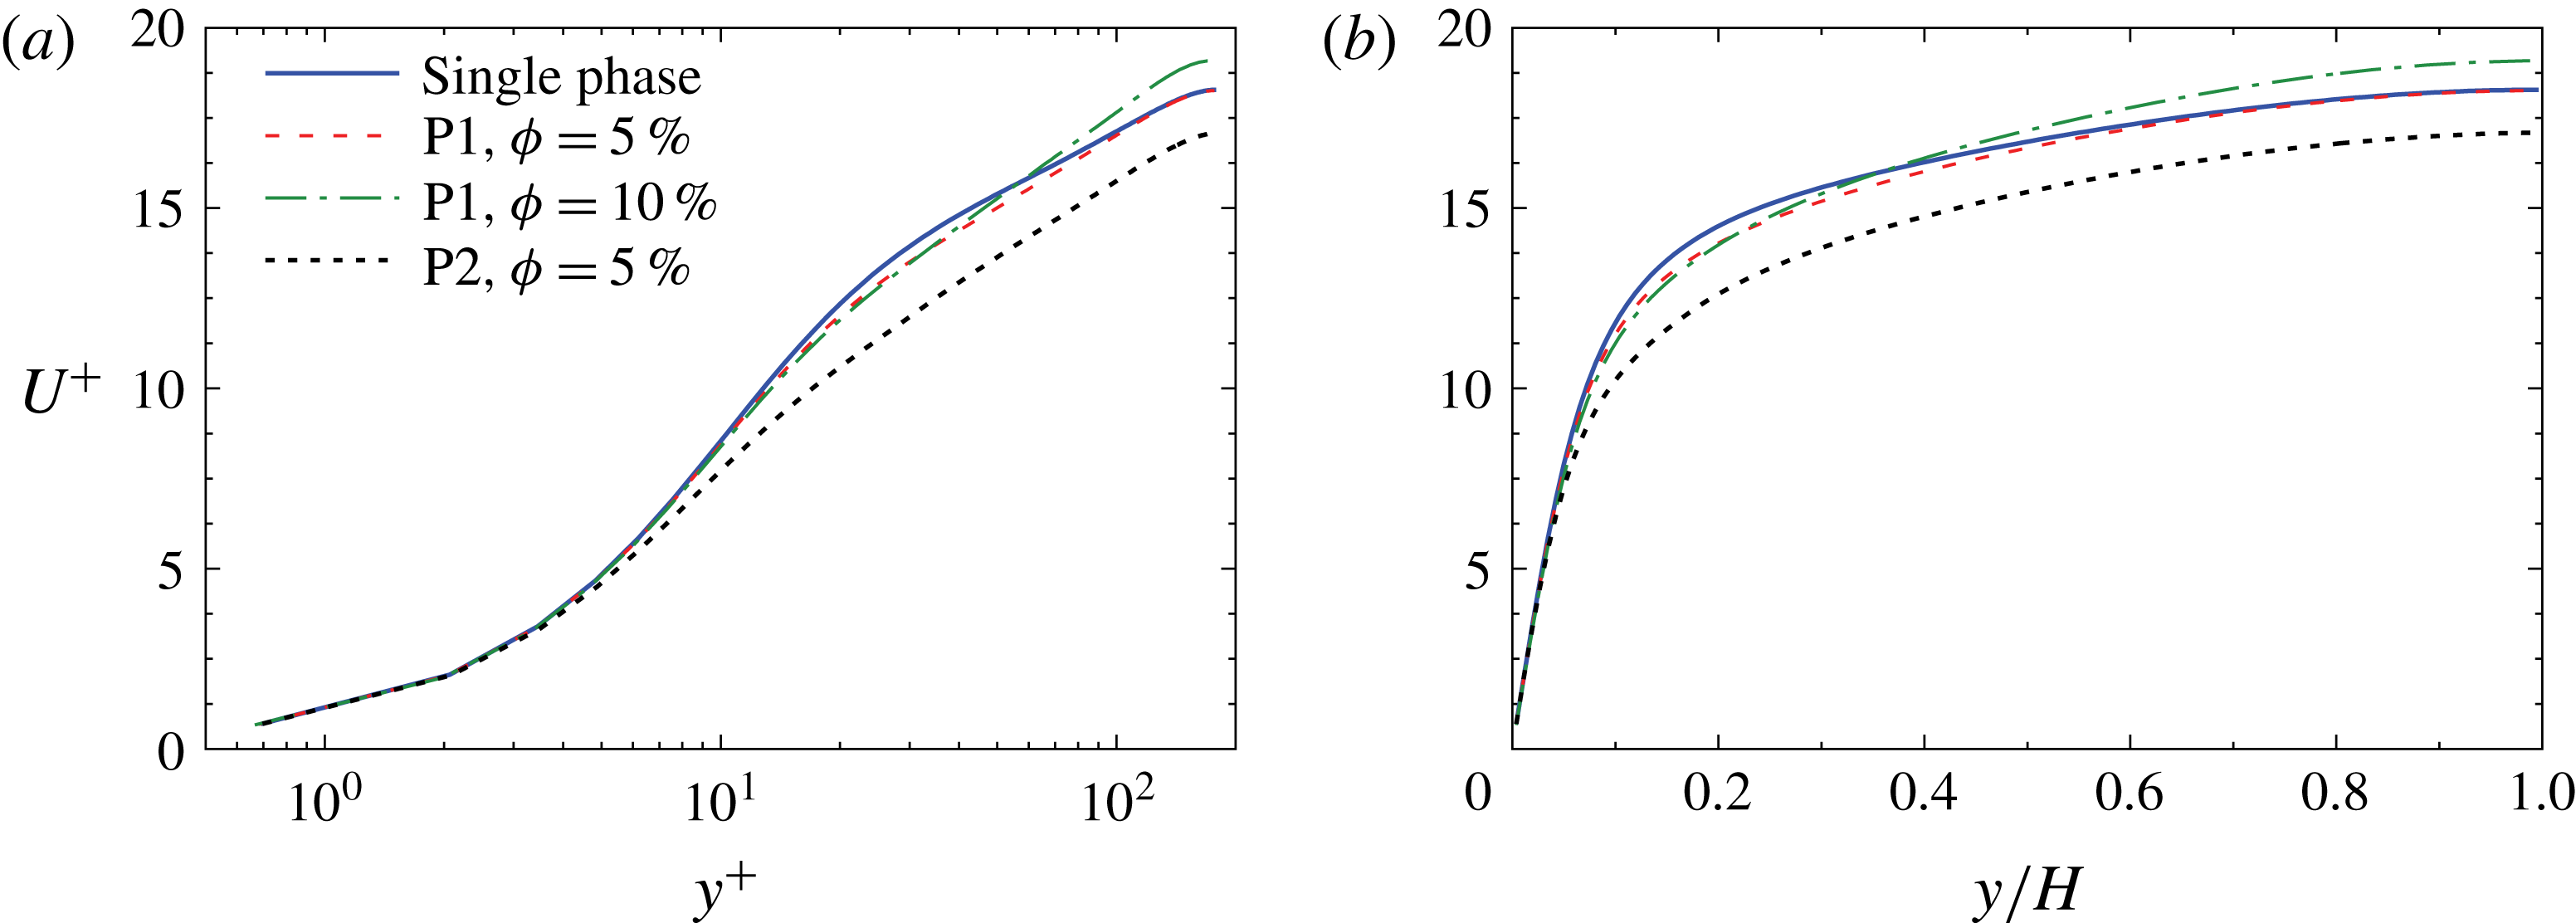
First, the influence of particles on the mean and fluctuating fluid velocity is studied. Figure 5 shows the normalized mean fluid velocity from the wall to the channel centre. It is immediately seen that the fluid velocity with spheres at
 $\unicode[STIX]{x1D719}=5\,\%$
is much less than that with oblate spheroids. At
 $\unicode[STIX]{x1D719}=5\,\%$
, the mean fluid velocity is reduced by 8.7 % due to the presence of spheres compared to a 1.2 % reduction in the case of oblate spheroids. Interestingly, oblate spheroids at
 $\unicode[STIX]{x1D719}=10\,\%$
lead to a 1.3 % velocity enhancement (drag-reduction effect). The maximum fluid velocity enhancement (by 4.4 %) occurs at the channel centre. It is also seen that increasing the volume fraction of oblate spheroids from
 $\unicode[STIX]{x1D719}=5\,\%$
to 10 % has only a minor effect on the mean velocity in the buffer region (
 $10<y^{+}<40$
). However, close to the channel centre the velocity profile is significantly shifted upwards and is located above the single-phase profile. Spheres show a different behaviour, in which the drag increases on increasing the volume fraction (Picano, Breugem & Brandt Reference Picano, Breugem and Brandt2015; Eshghinejadfard et al.
Reference Eshghinejadfard, Abdelsamie, Hosseini and Thévenin2017a
). Prolate spheroids are also shown to increase the mean fluid velocity in the channel centre region when increasing the solid-phase volume fraction (Eshghinejadfard et al.
Reference Eshghinejadfard, Hosseini and Thévenin2017b
). Therefore, non-spherical particles are able to reduce the drag at sufficiently high volume fractions.
Normalized mean streamwise fluid velocity
 $U^{+}$
as a function of distance from the wall in (a) inner units,
 $y^{+}$
, and (b) outer units,
 $y/H$
.

It can be also seen from figure 5 that the addition of spherical particles decreases the buffer layer thickness while the logarithmic region is extended. Oblate spheroids have a larger buffer layer thickness than spheres; but slightly smaller than the single-phase thickness. Finally, the slope of the logarithmic region is increased when using oblate particles at
 $\unicode[STIX]{x1D719}=10\,\%$
. A similar effect has been noted for high concentrations of polymers (Ptasinski et al.
Reference Ptasinski, Nieuwstadt, Van Den Brule and Hulsen2001, Reference Ptasinski, Boersma, Nieuwstadt, Hulsen, Van den Brule and Hunt2003; White, Somandepalli & Mungal Reference White, Somandepalli and Mungal2004). For an oblate spheroid volume fraction of
 $\unicode[STIX]{x1D719}=10\,\%$
, the von Kármán parameters in the logarithmic region (
 $u^{+}=\unicode[STIX]{x1D705}\ln y^{+}+B$
) are found to be
 $\unicode[STIX]{x1D705}=3.45$
and
 $B=1.8$
, confirming the greater slope of oblate-spheroid-laden flow profile compared to the single-phase case (i.e.,
 $\unicode[STIX]{x1D705}=2.5$
).
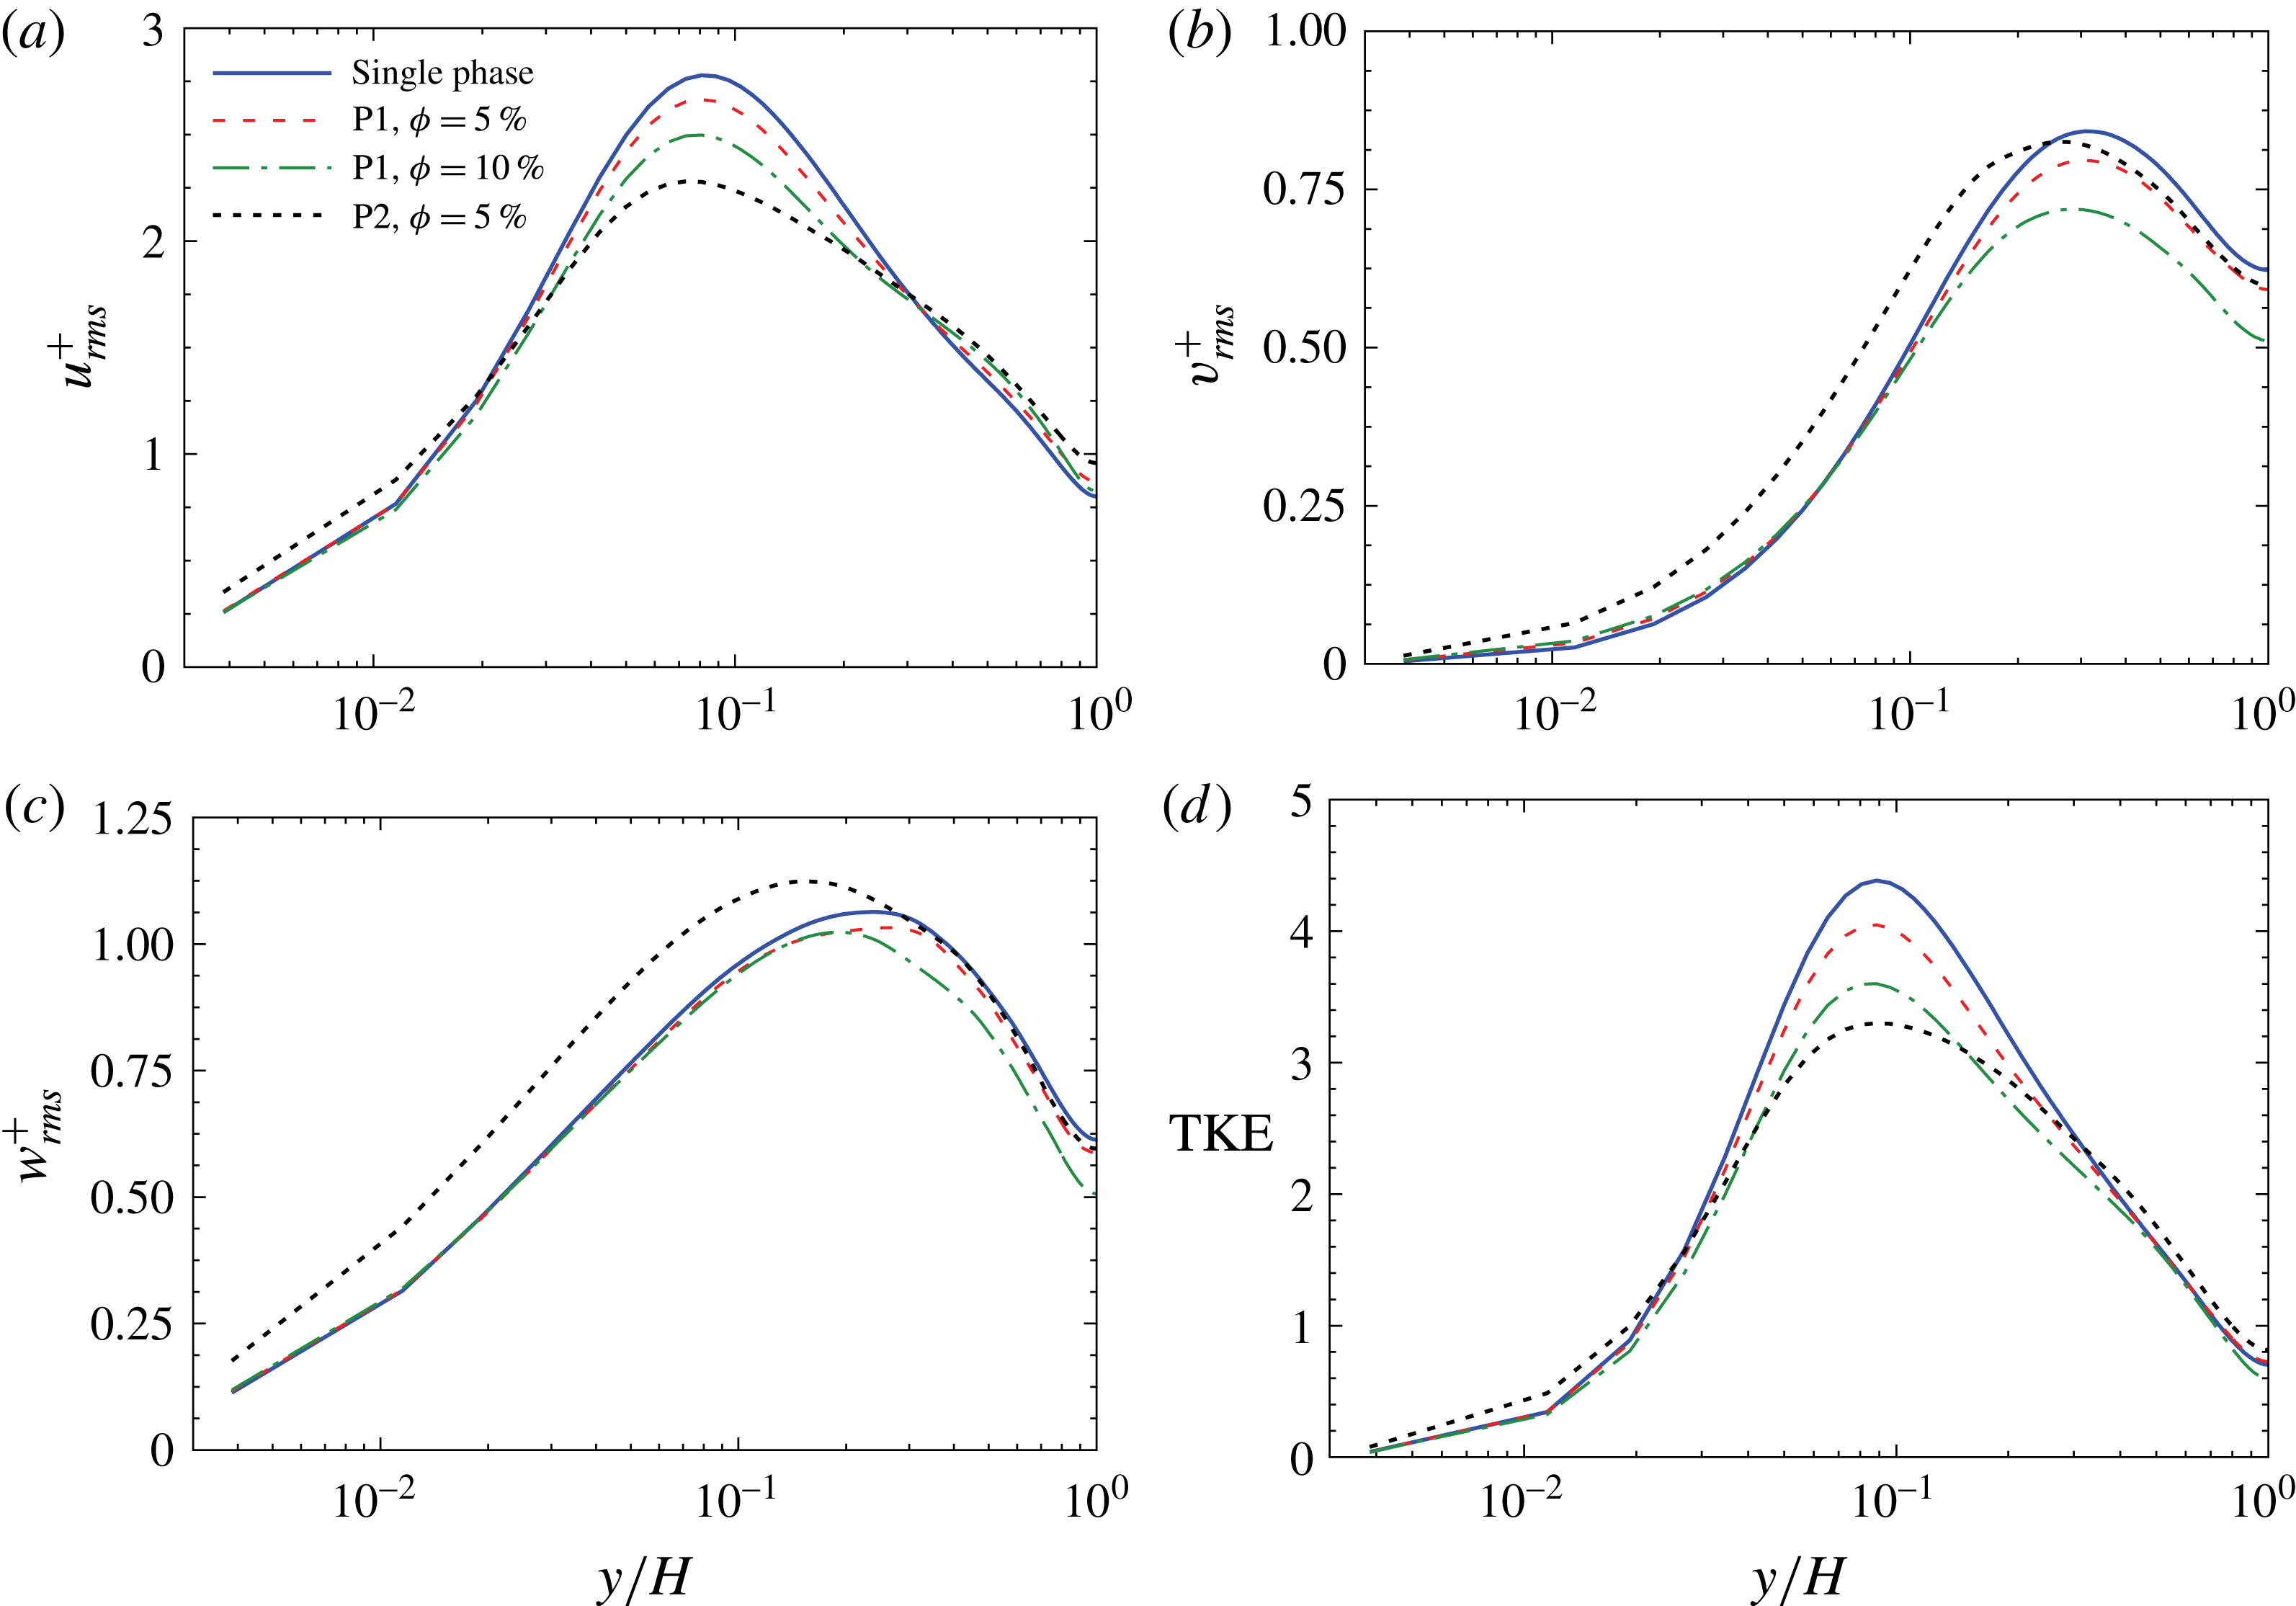
Figure 6(a–c) shows the root mean square velocity fluctuations in single-phase and particle-laden flows. In figure 6(a) the normalized r.m.s. of the streamwise velocity fluctuations are plotted. It is observed that both particle types reduce the maximum streamwise velocity fluctuations. This reduction is stronger for spheres (P2) even in comparison with higher volume fractions of oblate spheroids. The behaviour of
 $u_{rms}^{+}$
is not unique among different drag-reducing methods. An increase of
 $u_{rms}^{+}$
is usually observed for flow with polymers (Min et al.
Reference Min, Yul Yoo, Choi and Joseph2003) but its reduction for flow over riblets is reported (Choi, Moin & Kim Reference Choi, Moin and Kim1993). Thus, variation of the streamwise velocity fluctuations is not an indication of drag reduction. Moreover, the peak point of all particle-laden curves is shifted towards the wall. The shift of the maximum point towards the wall is consistent with the reduced buffer layer thickness. A major effect of particle shape is observed in the near-wall region, where spheres increase the streamwise turbulence intensity but oblate spheroids do not create a noticeable change. In the channel centre, enhancement of the streamwise velocity fluctuations is stronger for spheres compared to spheroids.
(a–c) R.m.s. fluid velocity fluctuations in the streamwise, wall-normal and spanwise directions, respectively, and (d) turbulent kinetic energy (TKE) versus distance from the wall.

With respect to the spanwise and wall-normal directions (figure 6 b,c), spheres enhance the near-wall intensities, while the effect of oblate spheroids is again negligible there. Enhanced velocity fluctuations by spheres are due to wake dynamics and vortex shedding behind the particles. Particle Reynolds numbers of spheres can be up to 40 % larger than those of oblate spheroids due to the special orientation of oblate spheroids and lower projected area. Far from the wall, oblate spheroids suppress fluctuations and the effect is more dominant for higher volume fractions. Spheres have less effect in this region, particularly for the spanwise direction. The location of the peak is again shifted towards the wall by adding particles.
For the case of polymers or tiny fibres, drag reduction is mainly characterized by attenuation of the spanwise and wall-normal velocity fluctuations (Ptasinski et al. Reference Ptasinski, Nieuwstadt, Van Den Brule and Hulsen2001; Escudier, Nickson & Poole Reference Escudier, Nickson and Poole2009) that is similar to what is observed for finite-size oblate spheroids. Also, the enhancement of spanwise and wall-normal velocity fluctuations by using spheres and a negligible change by oblate spheroids in the region close to the wall confirm the observations of Ardekani et al. (Reference Ardekani, Costa, Breugem, Picano and Brandt2017). However, far from the wall, the larger spheres used in the current study do not show an enhancement of the transverse fluctuations. This is different from the observations of Ardekani et al. (Reference Ardekani, Costa, Breugem, Picano and Brandt2017) for smaller spheres because large and small spheres can differently affect velocity fluctuations (Shao, Wu & Yu Reference Shao, Wu and Yu2012). Based on figure 6, the main effect of particle type on cross-stream fluctuations occurs in the viscous sublayer and in the buffer layer.
The turbulent kinetic energy (TKE) for different cases is plotted in figure 6(d). Again oblate spheroids have negligible effect close to the wall, while spheres augment the TKE in this region because of the wakes trailing the particles. Close to the centre, spheres enhance the TKE, while oblate spheroids have no effect at a volume fraction of
 $\unicode[STIX]{x1D719}=5\,\%$
. However, further enhancement of the oblate spheroid concentration to
 $\unicode[STIX]{x1D719}=10\,\%$
slightly reduces the TKE at locations far from the wall. As expected from the streamwise velocity fluctuations, all particle types have a lower peak compared to the single-phase flow; however, the effect is stronger in the case of spheres. Therefore, the intensity of turbulence is reduced by adding particles. Turbulence attenuation is due to extra dissipation by particles that apply forces opposing the turbulent fluctuations. Although particles can enhance the turbulence through vortex shedding, the overall modulation depends on the competition between turbulence attenuation via increased dissipation and its enhancement by wake dynamics; particle size plays an important role in this respect (Matas, Morris & Guazzelli Reference Matas, Morris and Guazzelli2003; Burton & Eaton Reference Burton and Eaton2005; Balachandar & Eaton Reference Balachandar and Eaton2010). Moreover, particles reduce the contribution of ejection events to the turbulence production, and therefore TKE is reduced.
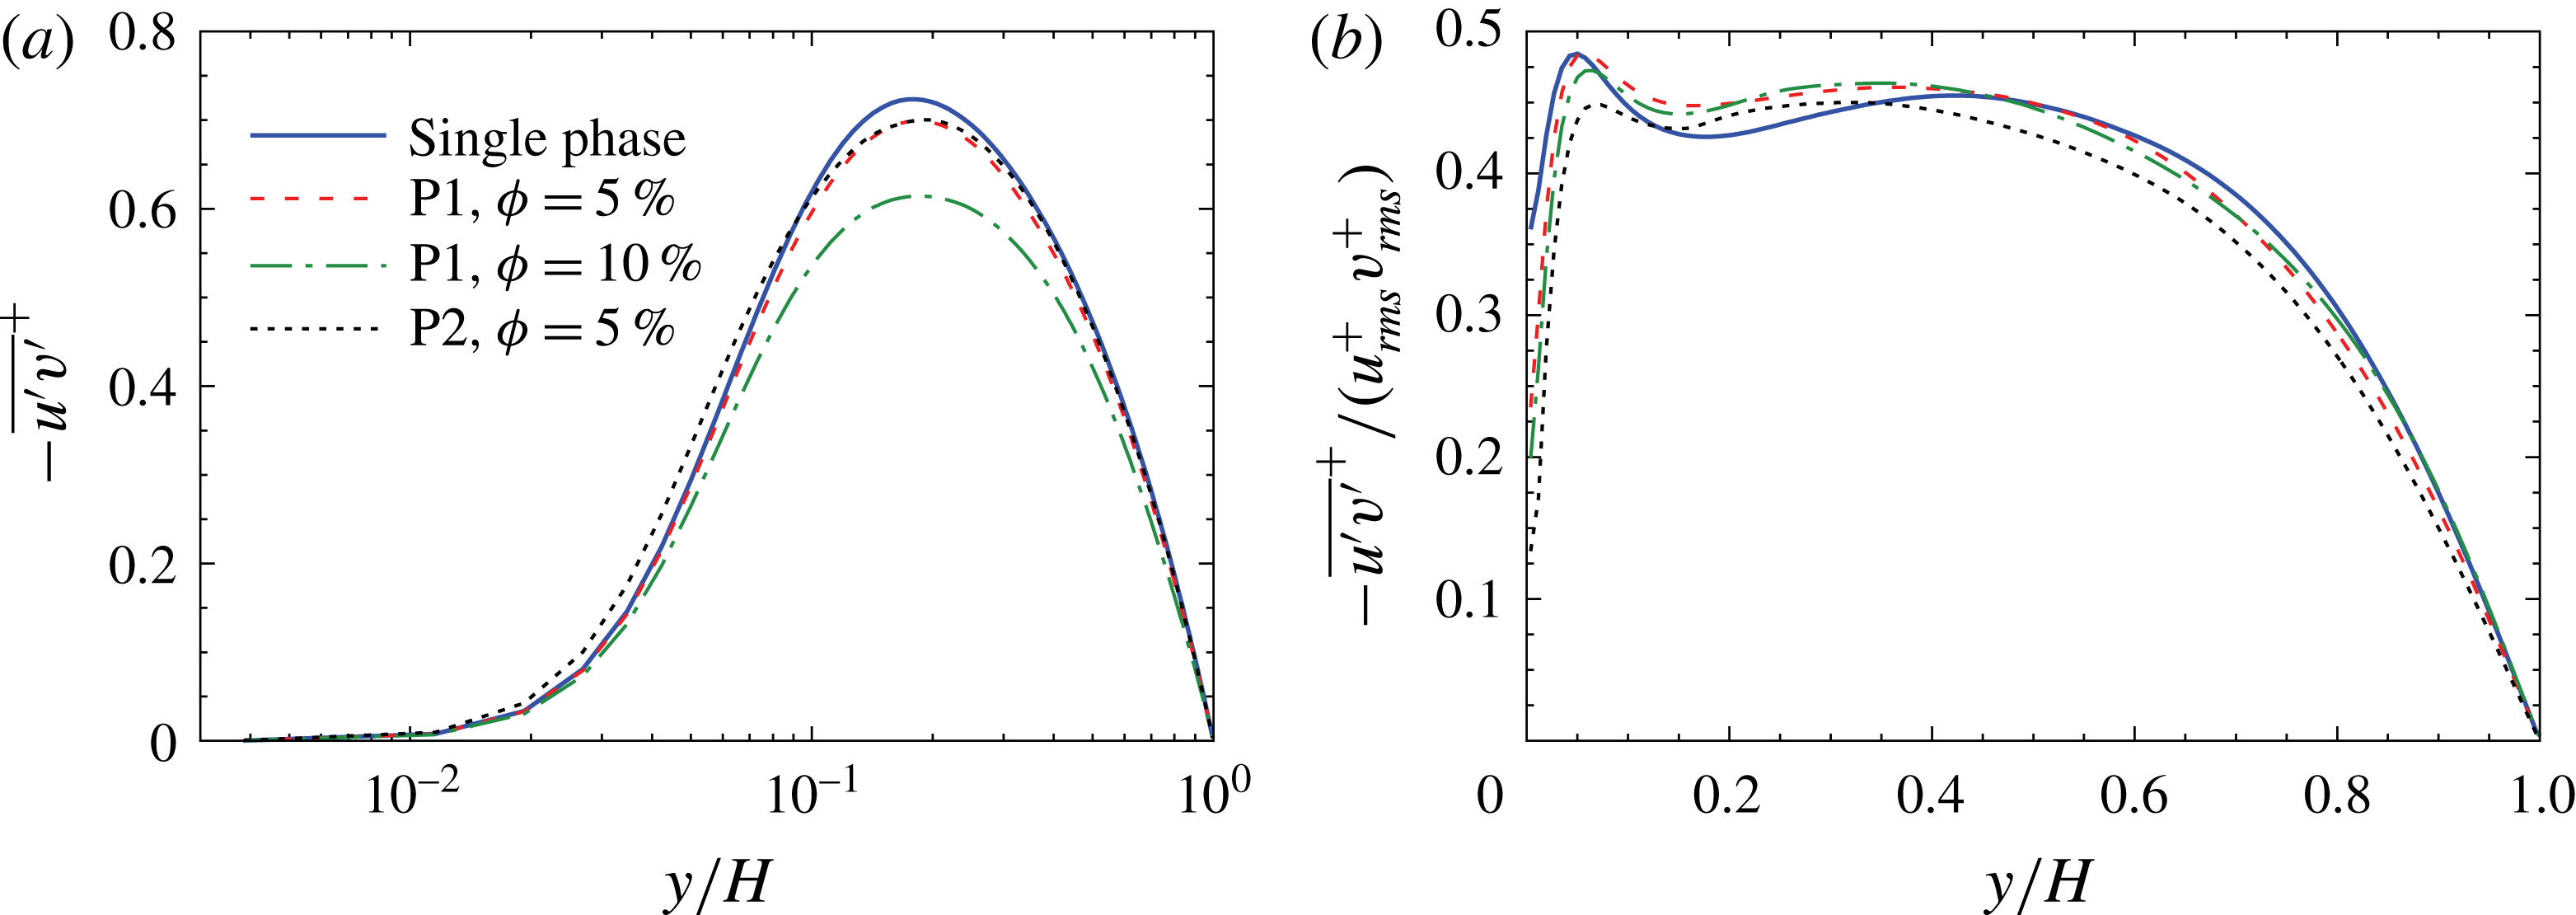
(a) Reynolds shear stress, and (b) correlation coefficient between
 $u^{\prime }$
and
 $v^{\prime }$
versus distance from the wall.

Reynolds shear stress is depicted in figure 7(a). Addition of particles decreases the Reynolds shear stress. This effect is quite enormous for P1 at
 $\unicode[STIX]{x1D719}=10\,\%$
, where a reduction of up to 15 % can be detected. By comparing the profiles of Reynolds shear stress for P1 at two concentrations, the reduction strongly increases with concentration throughout the channel height. Again, close to the wall, spheres have higher Reynolds stress than the single-phase flow, which is not seen for oblate spheroids. It is also observed that, although P1 and P2 (
 $\unicode[STIX]{x1D719}=5\,\%$
) have close shear stresses, fluid velocity reduction by oblate spheroids is much less than spheres. Reduction of Reynolds shear stress by all particle types proves therefore that the reduction of Reynolds stress is not the unique factor that leads to drag reduction. Two other important issues need to be considered: (i) particle shape, where spherical and non-spherical particles have different effects, and (ii) particle size, where small and large particles behave differently. In the numerical studies of Ardekani et al. (Reference Ardekani, Costa, Breugem, Picano and Brandt2017), Reynolds shear stress is increased for small spherical particles (
 $a/H=0.056$
) that have a drag enhancement effect, but it is decreased for drag-reducing oblate spheroids. However, recall that larger spheres can reduce the Reynolds shear stress without any drag-reduction effect, as shown by Shao et al. (Reference Shao, Wu and Yu2012); in their study, spherical particles of
 $a/H=0.1$
decrease the maximum Reynolds stress, while particles of
 $a/H=0.05$
increased the Reynolds stress in the entire channel. But both particle types increased the drag.
Figure 7(b) shows the profile of the correlation coefficient between
 $u^{\prime }$
and
 $v^{\prime }$
for all cases. The differences of Reynolds shear stress between the single-phase and particle-laden flows can be as a result of changes in
 $u^{\prime }$
,
 $v^{\prime }$
and/or the correlation coefficient. The effect of the oblate spheroid concentration on the correlation coefficient is less evident than on the Reynolds shear stress. Therefore, the oblate spheroid concentration mainly affects
 $u^{\prime }$
and
 $v^{\prime }$
rather than the correlation between them. Also a peak near to the wall is observed for all curves whose location is close to the location of the peak point of streamwise velocity fluctuations. Close to the wall, the correlation coefficient shows a reduction in particle-laden flows. Thus, the Reynolds shear stress profile (figure 7
a) of particle-laden flows gets closer to the single-phase one, whereas each of
 $u_{rms}^{+}$
and
 $v_{rms}^{+}$
of particle-laden flows have a larger difference with respect to the corresponding single-phase curves.
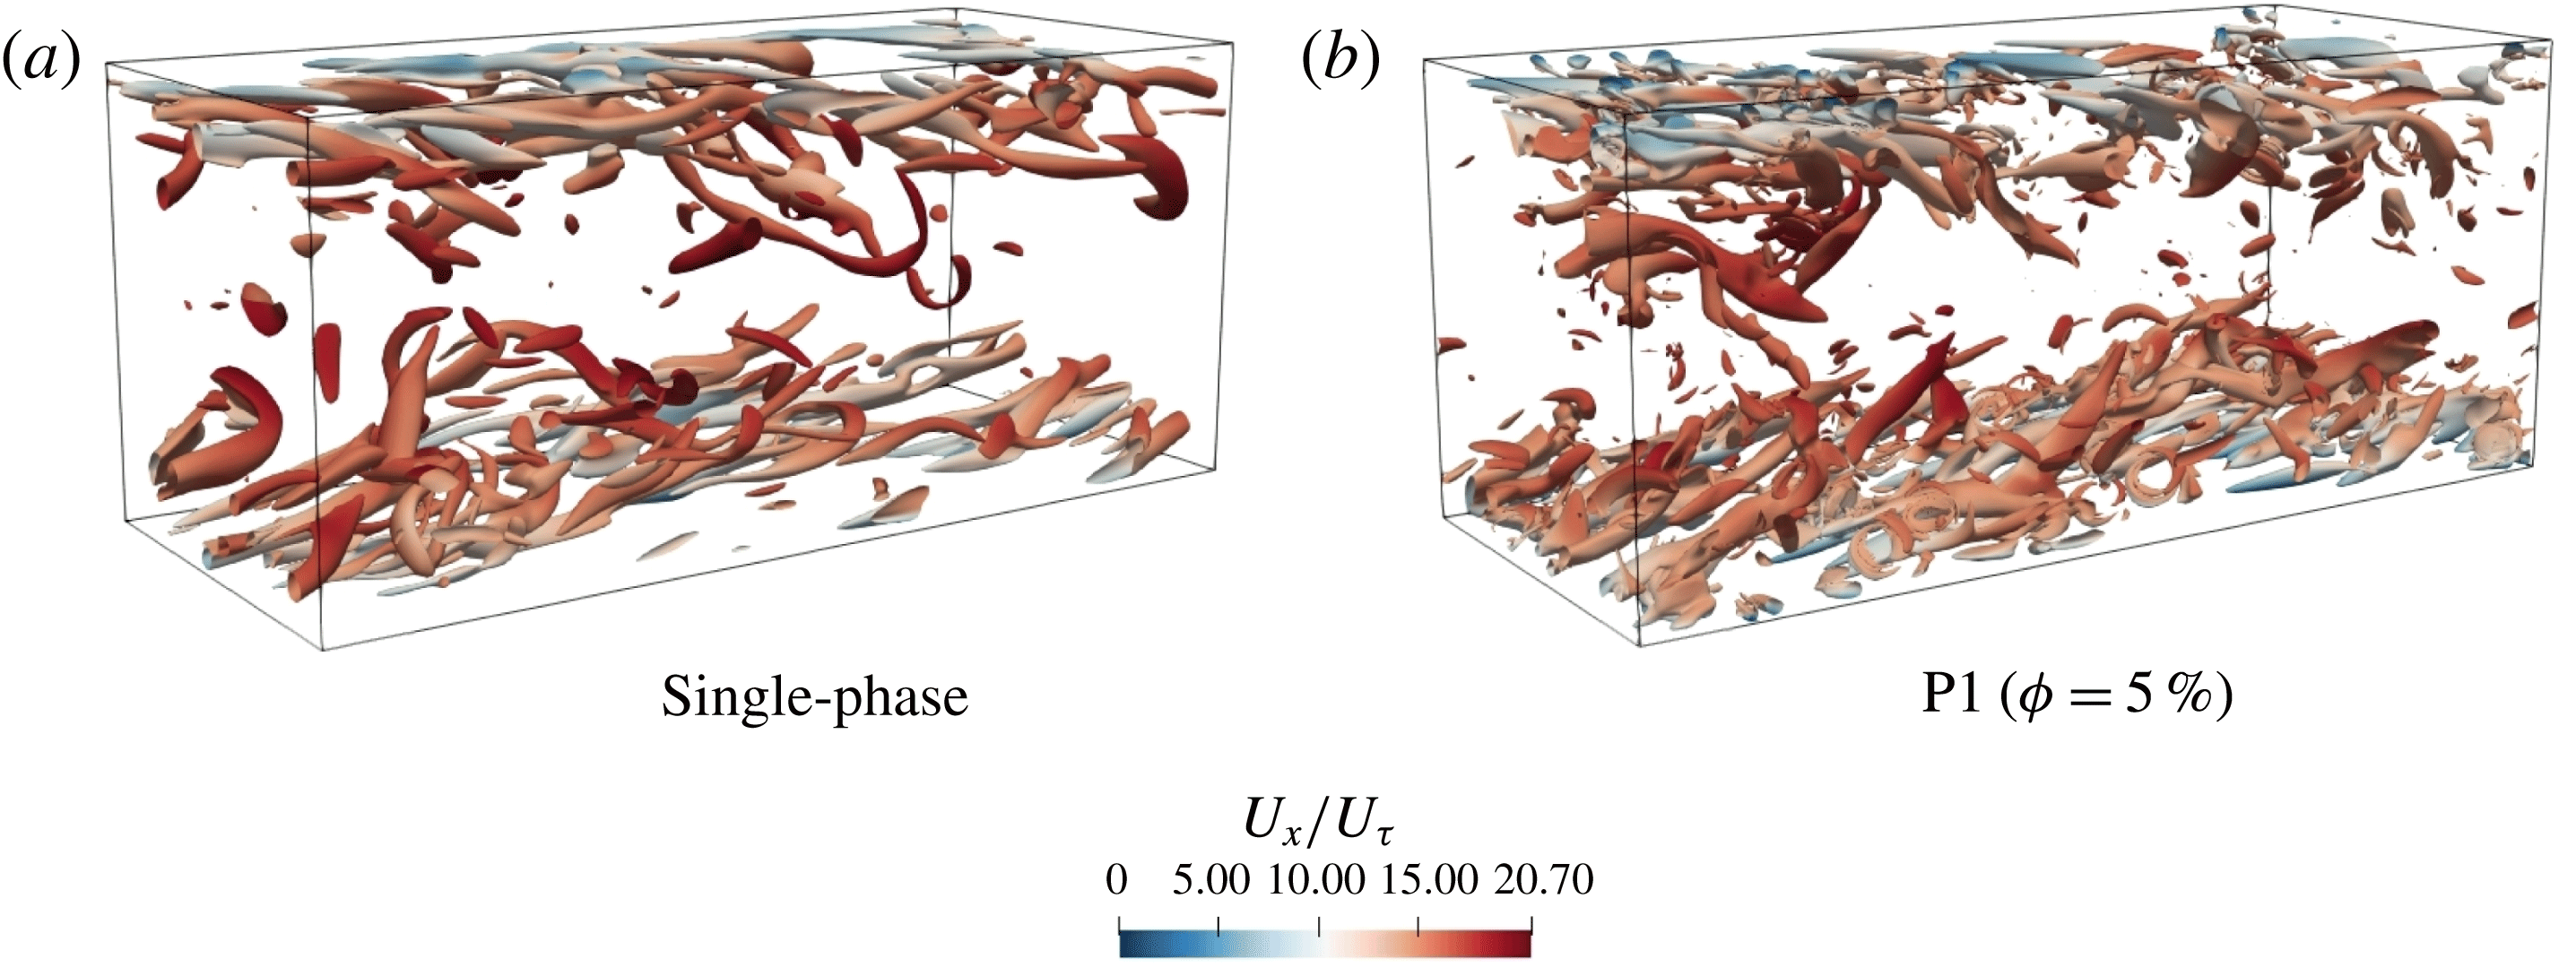
Figure 8 shows the streamwise vortical structure in the wall region visualized by the isosurfaces of the
 $Q$
-criterion (second invariant of the velocity-gradient tensor). Fluid flows from left to right. Quasi-streamwise coherent structures that are slightly tilted are seen in figure 8(a). By adding oblate spheroids (figure 8
b), the large-scale structures become smaller but more numerous. We will later show that the vortices are stronger in the particle-laden regime. Smaller but more energetic vortices have also been previously observed in the numerical simulation of dense sphere-laden flows in the transitional regime (Loisel et al.
Reference Loisel, Abbas, Masbernat and Climent2013).
Coherent structures visualized by the
 $Q$
-criterion at
 $Q/(u_{\unicode[STIX]{x1D70F}}^{4}/\unicode[STIX]{x1D708}^{2})=0.009$
and coloured by the streamwise velocity for (a) single phase, and (b) flow with oblate spheroids at
 $\unicode[STIX]{x1D719}=5\,\%$
(particles are not shown for a better visualization).

4.2 Mechanism of drag reduction
Turbulent drag reduction was first observed in the experimental studies of Toms (Reference Toms1948) using polymer additives. Since then, a large number of theoretical, numerical and experimental studies have been performed to explore this concept. However, most of these studies consider flexible polymers as a drag-reduction agent (White & Mungal Reference White and Mungal2008; Tiong, Kumar & Saptoro Reference Tiong, Kumar and Saptoro2015). Although polymers have a high drag-reduction effect (up to 80 %), they lose their efficiency very rapidly due to degradation (Pereira & Soares Reference Pereira and Soares2012). Another problem concerning polymers is that drag reduction occurs only beyond a certain Reynolds number. This is justified by the so-called ‘time criterion’, indicating that drag reduction occurs when the polymer relaxation time is longer than the near-wall turbulent time scale (Lumley Reference Lumley1969). Therefore, a stretched polymer does not return to a coiled configuration. These issues motivate studies on rigid additives that are most resistant to degradation and breakup, in particular when realizing that elastic effects have minor contributions to the drag reduction and viscous effects are more important (Paschkewitz et al. Reference Paschkewitz, Dubief, Dimitropoulos, Shaqfeh and Moin2004). In the present work, drag reduction by rigid particles is observed. Although oblate spheroids generate less drag reduction compared to polymers, they are less prone to degradation and could therefore last longer, avoiding a frequent replacement with a fresh solution.
To understand the drag reduction by oblate spheroids we need to study the effect of particles on quasi-streamwise vortices. These vortices that populate in the buffer region are responsible for the exchange of fluid momentum between the inner and outer layers. Streamwise vortices contribute to the skin-friction drag because of the impingement of high-speed fluid on the wall (Orlandi & Jiménez Reference Orlandi and Jiménez1994). They extract energy from the mean flow (sweep) and create high/low velocity streaks of the streamwise velocity. Instability of low-speed streaks, on the other hand, drives the fluid flow away from the wall (ejection) and increases quasi-streamwise vortices that maintain the turbulence (Jiménez & Pinelli Reference Jiménez and Pinelli1999). Low-speed streaks and quasi-streamwise vortices are the dominant features of the near-wall turbulence in this so-called ‘streak cycle’ of turbulence regeneration. Therefore, drag reduction is usually related to the increase in the spanwise spacing between low-speed velocity streaks and reduction of the number and strength of vortices (Hammond, Bewley & Moin Reference Hammond, Bewley and Moin1998; White et al. Reference White, Somandepalli and Mungal2004; Wang, Huang & Xu Reference Wang, Huang and Xu2016). In this part, these phenomena in flows seeded with rigid particles will be investigated.
Based on previous figures, it appears that the profile of the Reynolds shear stress (its reduction or enhancement) cannot solely determine whether total drag increases or decreases. In dense particle-laden flows, Reynolds shear stress is not the only contribution to the drag and viscous stress, and particle-induced stress can alter the streamwise momentum budget as well. In this respect, streamwise vortices and velocity streaks play an important role in explaining the differences between spheres and oblate spheroids.
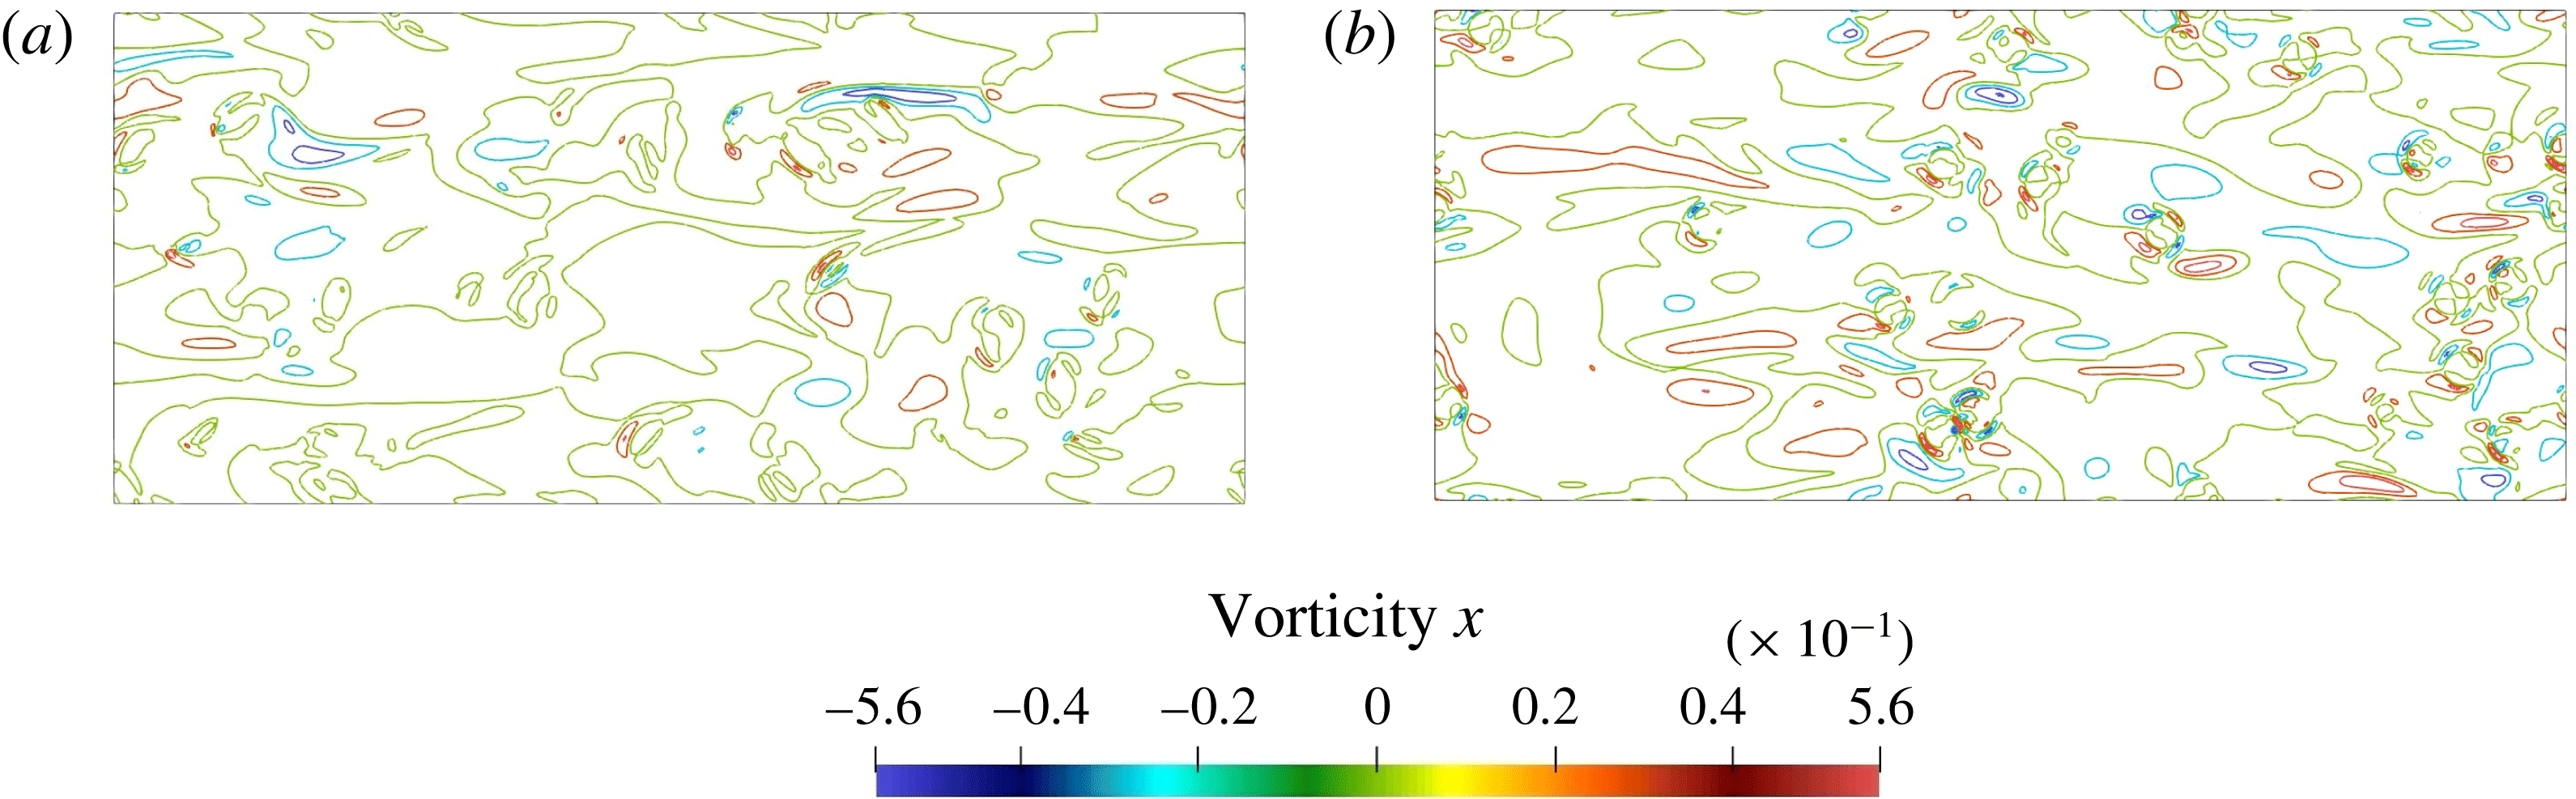
Figure 9 illustrates contours of instantaneous streamwise vorticity (
 $\unicode[STIX]{x1D714}_{x}$
) for oblate spheroids (
 $\unicode[STIX]{x1D719}=10\,\%$
) and spheres (
 $\unicode[STIX]{x1D719}=5\,\%$
). It is seen that the near-wall streamwise vortices are weaker for flow with oblate spheroids than those with spheres. Weakened streamwise vortices have a major influence on lower drag by oblate spheroids. This effect was also documented before for other types of drag reduction by polymers, microbubbles, hydrophobic surfaces or flow control (Kim Reference Kim2011). Stronger streamwise vortices, on the other hand, lead to higher skin friction in the flow with spherical particles.
Contours of streamwise vorticity in the
 $y$
–
 $z$
plane at
 $y/H=0.12$
(
 $y^{+}=21$
) (coloured by the streamwise vorticity). (a) Oblate spheroids at
 $\unicode[STIX]{x1D719}=10\,\%$
, (b) spherical particles at
 $\unicode[STIX]{x1D719}=5\,\%$
.

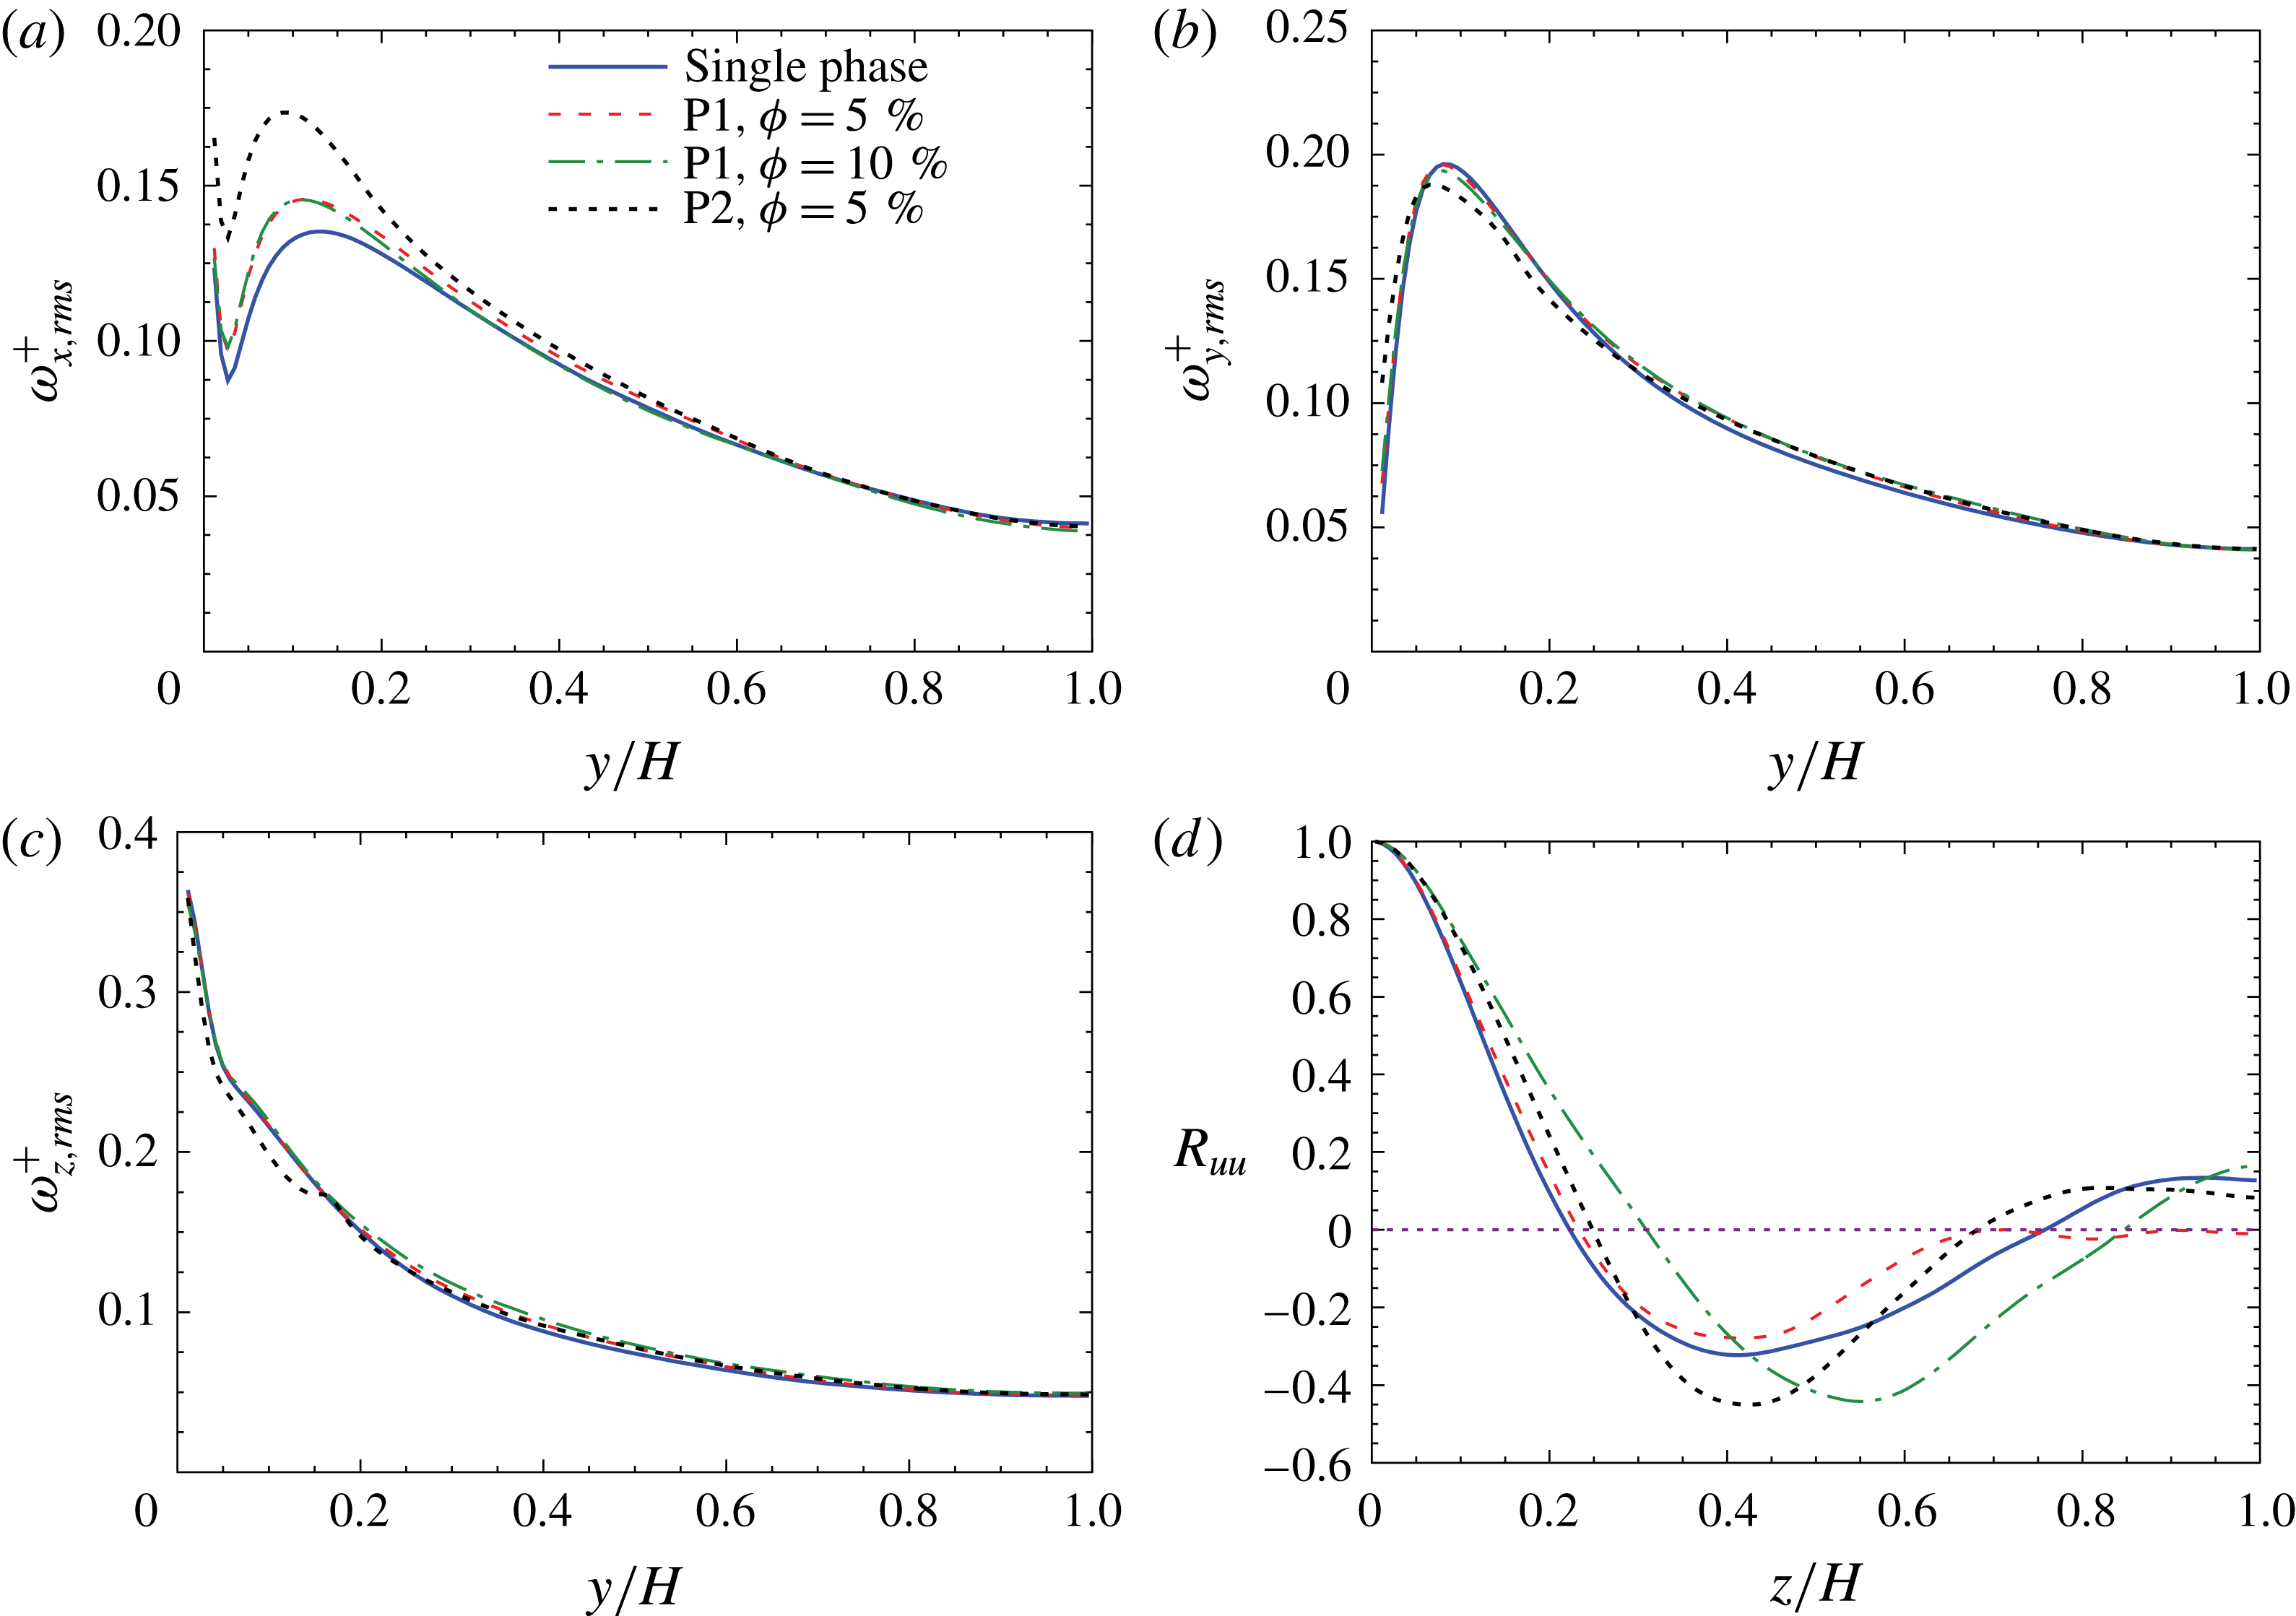
(a–c) R.m.s. fluid vorticity fluctuations in streamwise, wall-normal and spanwise directions, respectively, and (d) spanwise autocorrelation function of streamwise velocity fluctuations at
 $y^{+}=20$
(
 $y/H=0.11$
).

To quantitatively examine the effect of particles on velocity streaks and quasi-streamwise vortices, normalized fluid vorticity fluctuations and the two-point spanwise autocorrelation function will be explored. Figure 10(a–c) shows the r.m.s. of the fluid vorticity fluctuations normalized by
 $u_{\unicode[STIX]{x1D70F}}^{2}/\unicode[STIX]{x1D708}$
versus distance from the wall. It is seen that spanwise vorticity fluctuations are higher than the two other components for both particle types because of the more frequent occurrences of large variations of
 $\unicode[STIX]{x1D714}_{z}^{\prime }$
. Strong anisotropy in the near-wall region is also observed. After
 $y/H\approx 0.3$
, vorticity fluctuations show isotropy. The r.m.s. of the streamwise vorticity fluctuations represents the size and strength of the vortices (Kim, Moin & Moser Reference Kim, Moin and Moser1987). The maximum value of streamwise vorticity fluctuations demonstrates the strength of streamwise vortices. It is clearly seen that spheres have much higher streamwise vorticity fluctuations than oblate spheroids. The peak value of
 $\unicode[STIX]{x1D714}_{x,rms}^{+}=0.146$
for flow laden with
 $\unicode[STIX]{x1D719}=5\,\%$
of oblate spheroids compared to
 $\unicode[STIX]{x1D714}_{x,rms}^{+}=0.174$
for spheres indicates a 20 % lower strength of streamwise vortices, and thus weaker sweep motions, by using oblate spheroids compared to spheres. The wall-normal (
 $y$
) distance between the peak and the minimum of
 $\unicode[STIX]{x1D714}_{x,rms}^{+}$
represents the averaged radius of the near-wall streamwise vortices. This distance is less influenced by particles. However, a slight reduction from
 $0.11H$
for single-phase flow to
 $0.08H$
for
 $\unicode[STIX]{x1D719}=10\,\%$
of oblates and to
 $0.06H$
for
 $\unicode[STIX]{x1D719}=5\,\%$
of spheres can be observed. Therefore, the examined particle-laden flows have smaller but stronger vortices. This is in accordance with the visual observations of figure 8. The effect of oblate spheroid volume fraction on the streamwise vorticity fluctuations is small, suggesting some sort of saturation has occurred. On the other hand, the peak value of wall-normal vorticity fluctuations (
 $\unicode[STIX]{x1D714}_{y,rms}^{+}$
) is 0.196 in unladen flow and reduces to 0.188 for spheres (
 $\unicode[STIX]{x1D719}=5\,\%$
). Reduction of
 $\unicode[STIX]{x1D714}_{y,rms}^{+}$
for spheres indicates the weakened strength of the velocity streaks. However,
 $\unicode[STIX]{x1D714}_{y,rms}^{+}$
is larger for spheres close to the walls. Oblate particles show almost the same value as the single-phase flow, with a small dependency on volume fraction. Spanwise vorticity fluctuations (
 $\unicode[STIX]{x1D714}_{z,rms}^{+}$
) are large near the wall and decay on going farther from the wall. Again oblate spheroids show a lower dependency on the volume fraction. For spheres, the profile of
 $\unicode[STIX]{x1D714}_{z,rms}^{+}$
shows a stagnation point at
 $y\approx 0.165H$
. This point corresponds to the location of a particle layer formed in this region, as shown in the next section.
Figure 10(d) illustrates the two-point spanwise autocorrelation of streamwise velocity fluctuations (
 $R_{uu}$
) at
 $y/H=0.11$
(
 $y^{+}=20$
). The minimum of
 $R_{uu}$
occurs at one-half of the streak spacing. This minimum point is shifted outwards by adding large amounts of oblate spheroids (10 %), indicating a larger streak spacing. It is seen that the streak spacing increases from
 $0.82H$
in the single-phase flow to
 $1.1H$
for
 $\unicode[STIX]{x1D719}=10\,\%$
of oblate spheroids. However, the single-phase flow and 5 % volume fractions of oblate spheroids or spheres show close data for the location of the minimum point. The spheres have an even slightly larger streak spacing than oblate spheroids at
 $\unicode[STIX]{x1D719}=5\,\%$
, but do not demonstrate any drag-reduction effect. In this case, the vortices are so strong that coarsening of velocity streaks cannot lead to the occurrence of drag reduction. If spheres can increase the streak spacing significantly at higher volume fractions, they may also be able to reduce the drag. However, the volume fraction for the onset of this probable drag reduction is expected to be much higher compared to oblate spheroids. This issue needs future investigations. The location of the minimum spanwise autocorrelation function shows a large shift by changing the volume fraction of oblate spheroids from 5 % to 10 %. This shift is much larger than that between the curves of the single-phase flow (
 $\unicode[STIX]{x1D719}=0\,\%$
) and
 $\unicode[STIX]{x1D719}=5\,\%$
. Thus, we predict the drag reduction to be much larger at higher than 10 % concentration of oblate spheroids as it does not show a linear increase. This also explains the observations of Ardekani et al. (Reference Ardekani, Costa, Breugem, Picano and Brandt2017) for small oblate spheroids (
 $D_{eq}/H=1/9$
). In their simulations, a drag reduction of only 0.5 % by a
 $\unicode[STIX]{x1D719}=5\,\%$
concentration of oblate spheroids was observed; while drag reduction grew to 3.3 % at
 $\unicode[STIX]{x1D719}=7.9\,\%$
and then to 5.4 % at
 $\unicode[STIX]{x1D719}=10\,\%$
. The magnitude of the local minimum of
 $\unicode[STIX]{x1D719}=5\,\%$
of oblate spheroids in figure 10(d) is smaller than that for
 $\unicode[STIX]{x1D719}=10\,\%$
, and this corresponds to the dimmed streaky structure for lower concentrations. Furthermore, as the location of the curve intersection with the horizontal axis (i.e.
 $R_{uu}=0$
) is shifted away from the wall by increasing the volume fraction of oblate spheroids from 5 % to 10 % we can conclude that the width of streaks is increased for higher concentrations.
Based on the presented data on velocity and vorticity fluctuations as well as spanwise autocorrelation of streamwise velocity fluctuations, the mechanism of drag reduction by oblate spheroids can be explained and compared to polymers based on the modification of the self-sustaining process of the near-wall turbulence. In most of the drag-reducing polymer regimes, a decrease of the magnitude of streamwise vorticity fluctuations (as well as wall-normal and spanwise velocity fluctuations) and consequently a reduction of vortices strength is observed (Dubief & Lele Reference Dubief and Lele2001; Paschkewitz et al. Reference Paschkewitz, Dubief, Dimitropoulos, Shaqfeh and Moin2004). Moreover, the spanwise space between velocity streaks is found to increase. These parallel events lead to high levels of drag reduction by only a few parts per million (ppm) of polymers. As we have seen so far, for the case of rigid oblate spheroids, although the spanwise spacing of velocity streaks is increased in high concentrations, vortices are slightly stronger in oblate-spheroid-laden flow compared to the single-phase flow. But turbulence in the transverse directions is attenuated and vortices are also smaller. Vortices of smaller radius have lower access to the high-velocity core region. Moreover, we will see later that oblate spheroids tend to be aligned parallel to the wall. This type of alignment creates a barrier between the streamwise vortex and the wall, and consequently the wall friction might reduce at high enough concentrations due to lower impingement of vortices with the wall and reduced sweep events. The combination of these parallel phenomena lead to minor drag-reduction levels by these rigid particles. Stronger vortices in particle-laden flows also justify the reduction of mean velocity by oblate spheroids in the buffer layer (figure 5). For the case of elastic polymers, mean velocity increases in the buffer layer, and thus the overall drag reduction is higher than rigid particles.
We can now separately identify the role of particle shape and concentration on drag reduction as well. First, oblate spheroids can reduce the drag because of their major influence on the reduction of turbulence in the transverse directions compared to the single-phase flow. Moreover, streamwise vortices are much weaker in the case of oblate spheroids compared to spheres. But the role of particle shape (oblate or sphere) is minimal on the spacing of velocity streaks at
 $\unicode[STIX]{x1D719}=5\,\%$
. Secondly, by increasing the concentration of oblate spheroids, drag tends to decrease. This effect is not observed for low concentrations. By considering figure 10 again we can reason that the oblate spheroid concentration has a great impact on the spanwise autocorrelation function, and therefore on the spanwise spacing of velocity streaks. Particle concentration has a negligible effect on the strength of vortices for the examined concentrations. In summary, drag reduction by oblate spheroids requires a major reduction of the fluid transverse velocity fluctuations and an enhancement of the spanwise spacing of the velocity streaks. Enhancement of the vortex strengths can reduce the drag-reduction level, but it should not be necessarily less than that of the single-phase flow to initiate the drag reduction. These explanations justify very well the reduction of drag with 10 % of oblate spheroids and the enhancement of drag with 5 % of oblate spheroids and spheres.
The self-sustaining turbulence regeneration cycle can also be studied. In the streak cycle of turbulence generation in single-phase flows, weakening of the vortex strengths or increasing the spacing of velocity streaks would suppress the other one and interrupt the turbulence regeneration process. Jiménez & Pinelli (Reference Jiménez and Pinelli1999) showed that eliminating the streaks prevents the generation of new vortices and causes a decay in the existing ones due to viscosity. In oblate-spheroid-laden flows, the increase in the spanwise spacing of velocity streaks versus the enhancement of vortex strengths suggests that another mechanism of vortex generation (in addition to the streak cycle) exists and the streak cycle cannot solely explain the turbulence regeneration process. Thus, flow structures in the region close to the wall are important as well and must be taken into account. Wake shedding occurs behind particles and small vortices are generated in this area. Spheres have higher concentrations and higher rotation rates than oblate spheroids in this zone (§ 4.3) that intensify the generation of vortices. Higher velocity fluctuations close to the wall are also attributed to small-scale vortices generated in this region (Shao et al. Reference Shao, Wu and Yu2012). These near-wall unsteady vortices are transported away from the wall and intensified by the mean shear. In single-phase flows of moderate Reynolds number, the role of the streak cycle overwhelms other turbulence generation cycles (Jiménez & Pinelli Reference Jiménez and Pinelli1999). However, the influence of near-wall vortices is also reported in some turbulent single-phase flows where secondary vortices are generated through a different mechanism (Jiménez & Moin Reference Jiménez and Moin1991; Brooke & Hanratty Reference Brooke and Hanratty1993).
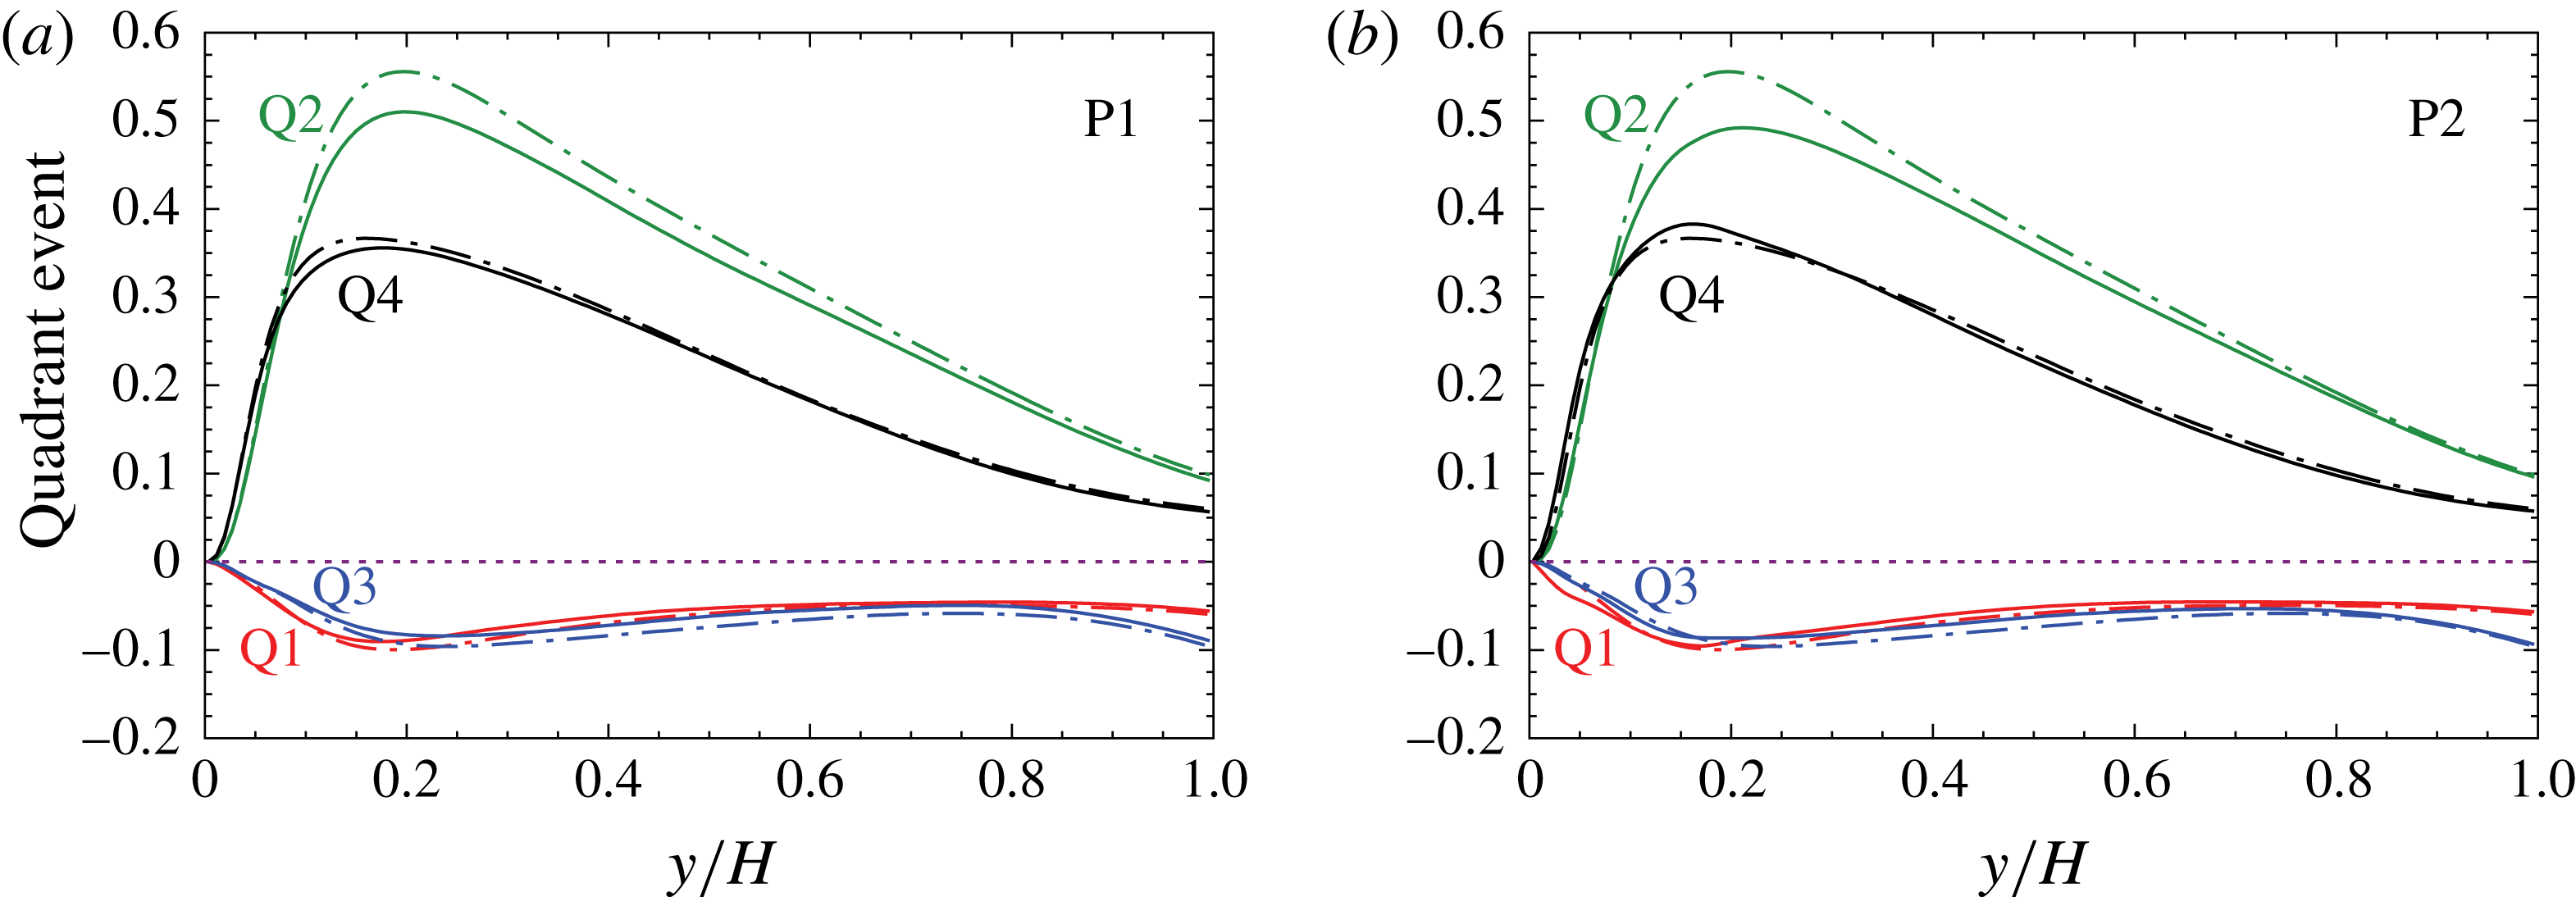
Quadrant analysis of particle-laden flow at
 $\unicode[STIX]{x1D719}=5\,\%$
(solid line) and single-phase flow (dashed line) for (a) P1 and (b) P2.

Coherent structures influence the distribution of particles. They can bring the particles towards or away from the wall. A detailed assessment of the sweep and ejection events and their modification by particles can be performed through quadrant analysis of the Reynolds shear stress. It helps in determining the contribution of turbulent events to the Reynolds shear stress. Four events based on the signs of velocity fluctuations
 $u^{\prime }$
and
 $v^{\prime }$
are detected in this regard. The first quadrant Q1 (
 $u^{\prime }>0$
and
 $v^{\prime }>0$
) contains outward motion of high-speed fluid; the second quadrant (
 $u^{\prime }<0$
and
 $v^{\prime }>0$
) represents the outward motion of low-speed fluid (ejections); the third quadrant (
 $u^{\prime }<0$
and
 $v^{\prime }<0$
) describes the inward motion of low-speed fluid; and the fourth quadrant (
 $u^{\prime }>0$
and
 $v^{\prime }<0$
) denotes the motion of high-speed fluid towards the wall (sweeps) (Kim et al.
Reference Kim, Moin and Moser1987). The first (Q1) and third (Q3) quadrants reduce Reynolds stress (i.e. negative turbulence production), while the second (Q2) and fourth (Q4) quadrants (ejections and sweeps) contribute to the production of Reynolds shear stress. The most relevant events are those of the second and fourth quadrants. Figure 11 shows the four quadrant events normalized by
 $u_{\unicode[STIX]{x1D70F}}^{2}$
. The sum of all values at each
 $y$
position is equal to the Reynolds shear stress at that wall distance. It is seen that sweeps and ejections are the major contributors to the Reynolds shear stress. For the single-phase flow, the sweep event is dominant in the near-wall region
 $y/H\approx 0.07$
(
 $y^{+}\approx 12$
) and the ejection motions are dominant away from the wall; this is in very good agreement with the data of Kim et al. (Reference Kim, Moin and Moser1987). In particle-laden flows, the sweeps still dominate before the cross-over point. This point is slightly shifted outwards by adding oblate spheroids. For oblate spheroids, the contributions of both sweeps and ejections are reduced compared to the single-phase flow. However, the Reynolds shear stresses from the first and third quadrants show slight enhancement. For spheres, the largest change occurs for Q2 events around the peak point; Q2 contributes less to the Reynolds stress but Q4 is increased. Therefore, the reduction of maximum Reynolds shear stress by spherical particles (figure 7) is mainly due to reduction in the ejection events contribution. Turbulent kinetic energy is also reduced in particle-laden flows (figure 6
d) since most of the turbulence production in the boundary layer occurs during the outward motion of low-speed fluid (Robinson Reference Robinson1991). Moreover, it is seen that sweep events in oblate-spheroid-laden flows have less contribution to the Reynolds stress in comparison with spheres. This issue can also explain the lower level of fluid velocity reduction by oblate spheroids compared to spheres at
 $\unicode[STIX]{x1D719}=5\,\%$
because sweep events are the inrush of high-speed fluid towards the wall. However, we observed that it is not the only factor and, as long as the streak cycle of turbulence regeneration is not interrupted, drag reduction does not happen.
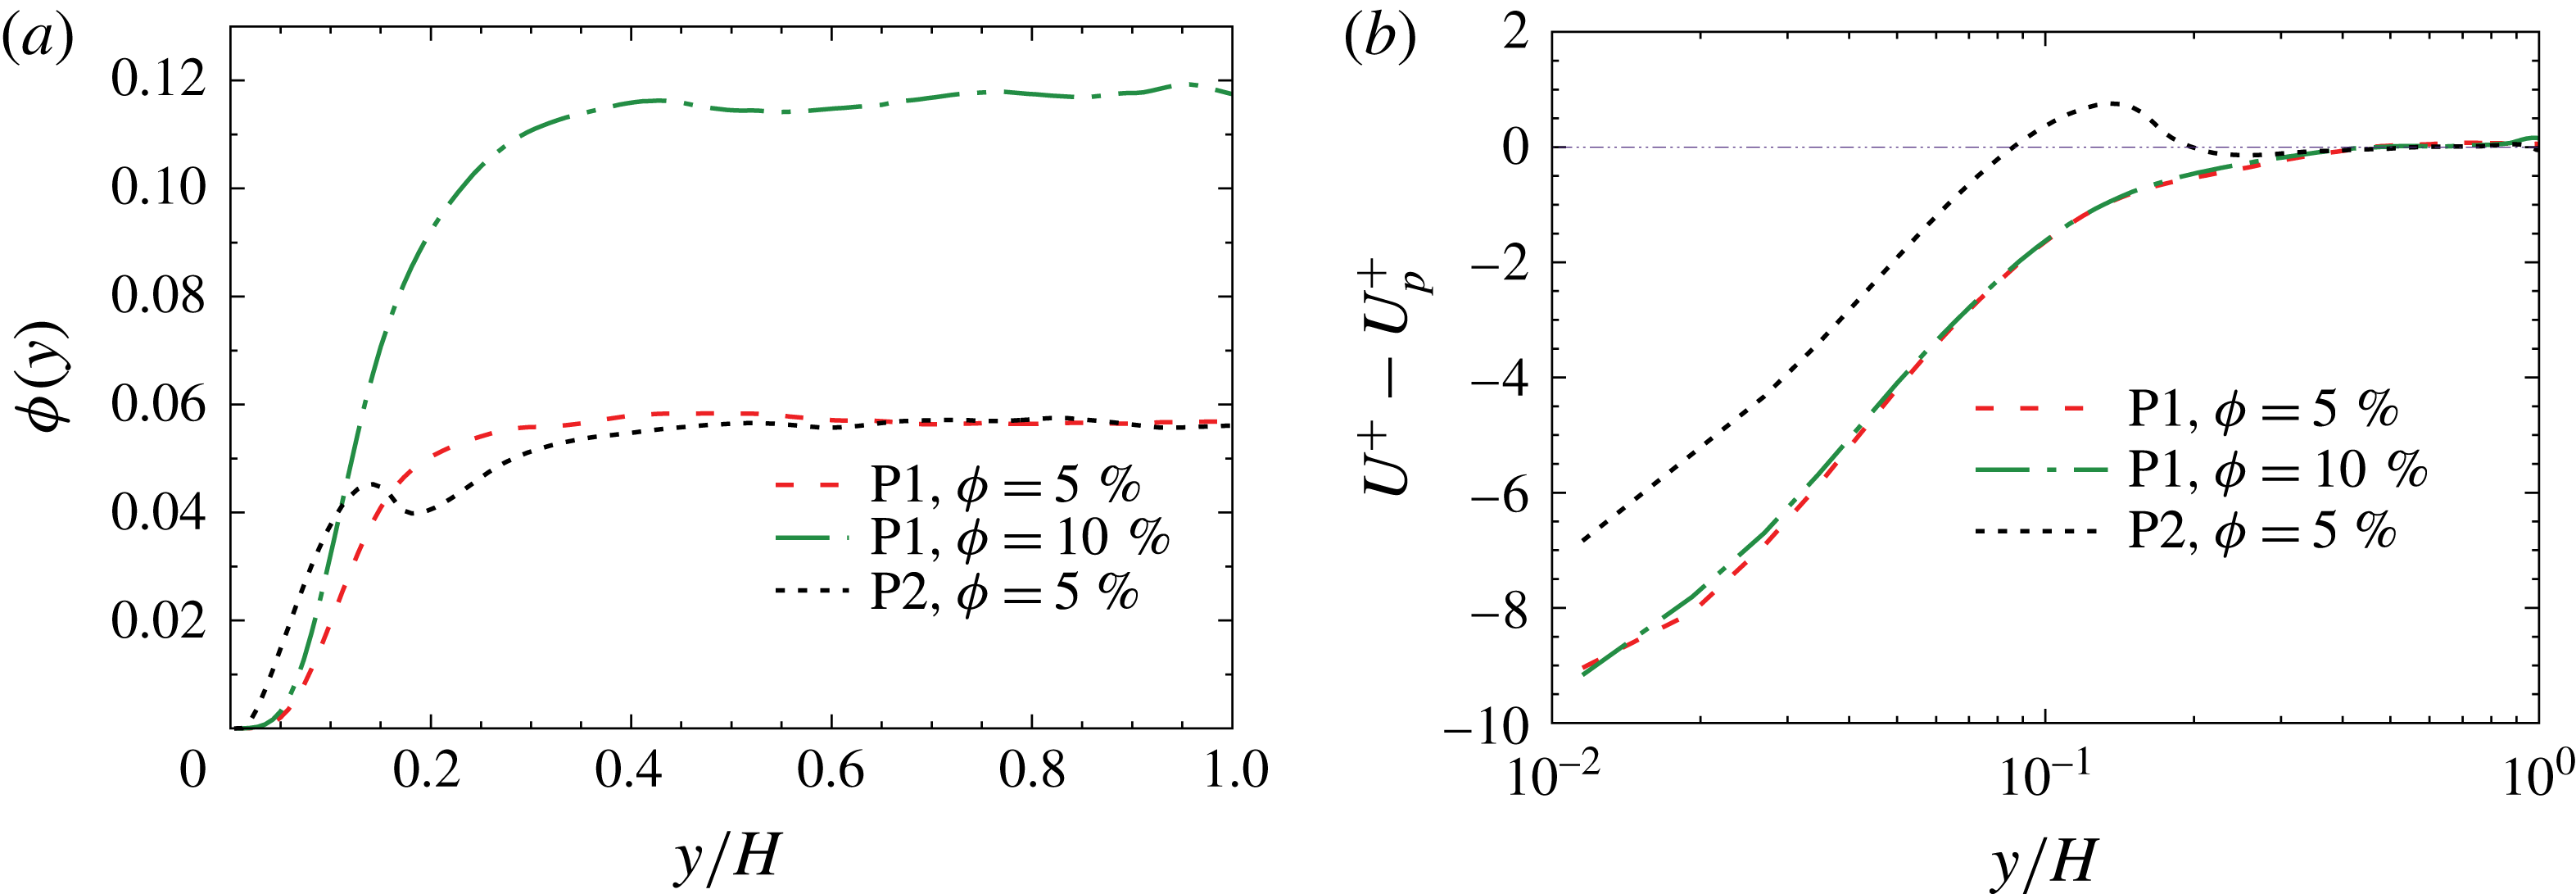
(a) Mean local volume fraction of particles
 $\unicode[STIX]{x1D719}(y)$
, (b) fluid–particle relative mean streamwise velocity (
 $U^{+}-U_{p}^{+}$
).

4.3 Particle statistics
The behaviour and statistics of particles are now investigated. Figure 12(a) illustrates the local concentration of particles versus distance from the wall. These data are calculated based on the grids located inside the particles. It is seen that the interaction of particles and turbulent structures leads to a specific particle distribution that depends on the particle shape. Close to the wall (
 $y/H<0.1$
), spheres at
 $\unicode[STIX]{x1D719}=5\,\%$
have even higher local concentrations than oblate spheroids at
 $\unicode[STIX]{x1D719}=10\,\%$
. A high concentration of spheres generates small-scale vortices that enhance turbulence intensity close to the wall (figure 6) and can contribute to higher drag. Spheres show a local peak of volume fraction around
 $y/H\simeq 0.12$
, followed by slight reduction and then an increase again, reaching a plateau up to the channel centre. This peak point corresponds to the location of maximum fluid velocity reduction by spheres in figure 5. For oblate spheroids, no local peak of accumulation is observed. Instead, the local concentration increases gradually and reaches a constant value towards the channel centre. This type of distribution confirms the observations of Ardekani et al. (Reference Ardekani, Costa, Breugem, Picano and Brandt2017). The plateau values are also very similar (
 ${\approx}1.1\unicode[STIX]{x1D719}$
) in spite of different particle sizes.
Coherent structures can affect the distribution of particles. Based on figure 11, the Reynolds stress from sweeps is smaller for oblate spheroids compared to spheres. Therefore, sweep motion in the oblate spheroid case is not as effective as in the sphere-laden case, and this contributes to a lower concentration of oblate spheroids near the wall. Marchioli & Soldati (Reference Marchioli and Soldati2002) used the concept of newly born vortices as well to explain the high concentration of tiny particles in the near-wall region. They discussed that the presence of newly born vortices prevents particles from accessing the ejection area. For resolved particles of current study, near-wall vortices that are mainly observed for spherical particles can also prevent a number of particles that entered the near-wall region from escaping into the outer flow, and thus the particle concentration in the near-wall area is higher than that for oblate spheroids.
Snapshot of streamwise velocity at
 $y/H=0.12$
(
 $y^{+}=21$
) (flow from left to right). (a) Oblate spheroids (P1) at
 $\unicode[STIX]{x1D719}=5\,\%$
, (b) spherical particles (P2) at
 $\unicode[STIX]{x1D719}=5\,\%$
.

Figure 12(b) displays the fluid–particle relative mean streamwise velocity as a function of distance to the wall. In the near-wall area (
 $y/H<0.08$
) both spheres and oblate spheroids move faster than the fluid because the particles receive streamwise momentum from the fluid in the outer core region, where the fluid velocity is high, and the obtained momentum is kept when particles approach the wall region due to particle inertia. In the present work, the particles show much larger streamwise velocities than the fluid in the vicinity of the wall (
 $U_{p}^{+}-U^{+}>6$
), which cannot be only due to the preferential sampling of high-speed streaks. This shows that a large momentum of the particle must be obtained in the channel centre region. Moreover, oblate spheroids tend to move faster than spheres in the near-wall region because of their type of orientation and lower projected area. For
 $0.08<y/H<0.2$
, oblate spheroids and spheres show different behaviours. Spheres move slower than the fluid while oblate spheroids are faster. In this area, spherical particles have a high concentration that prevents them from moving as fast as the fluid. In the core region, the particle and fluid velocity profiles are quite similar. Furthermore, the effect of particle concentration on relative velocity is small for almost the whole channel height.
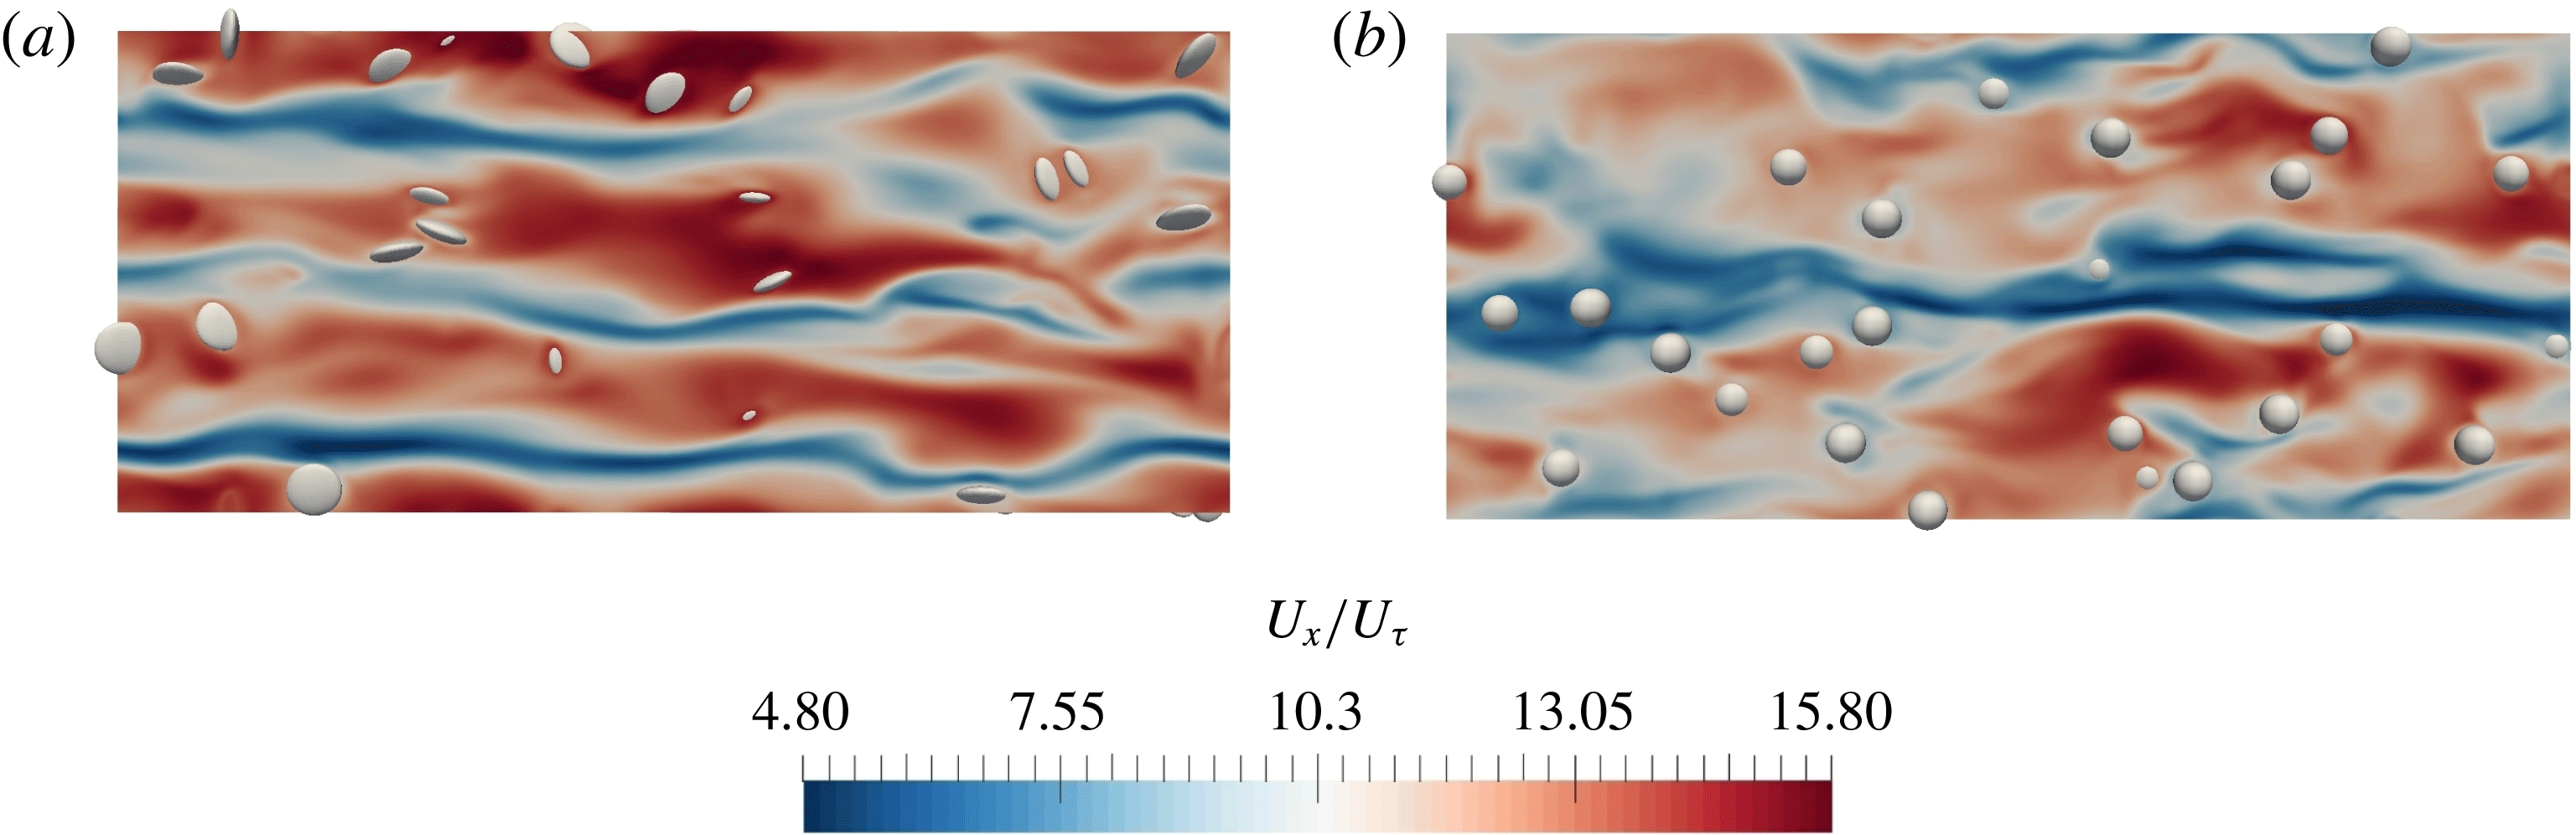
A snapshot of the streamwise fluid velocity together with the distribution of particles at
 $y/H=0.12$
(
 $y^{+}=21$
) is shown in figure 13. It can be immediately seen that the streamwise velocity for the oblate-spheroid-laden flow is much larger than that for spheres, confirming the data of figure 5. Moreover, more spherical particles can be observed at this plane. It is also seen that oblate spheroids seem generally to be located in high-speed flow regions that help them reach a higher velocity than the mean fluid at this
 $y$
-location. Voth & Soldati (Reference Voth and Soldati2017) reason that when finite-size particles are carried out by sweep motions towards the wall, their interactions with the wall do not allow them to get accumulated in low-speed streaks. Furthermore, velocity streaks in the oblate spheroid case are straighter than in the sphere case.
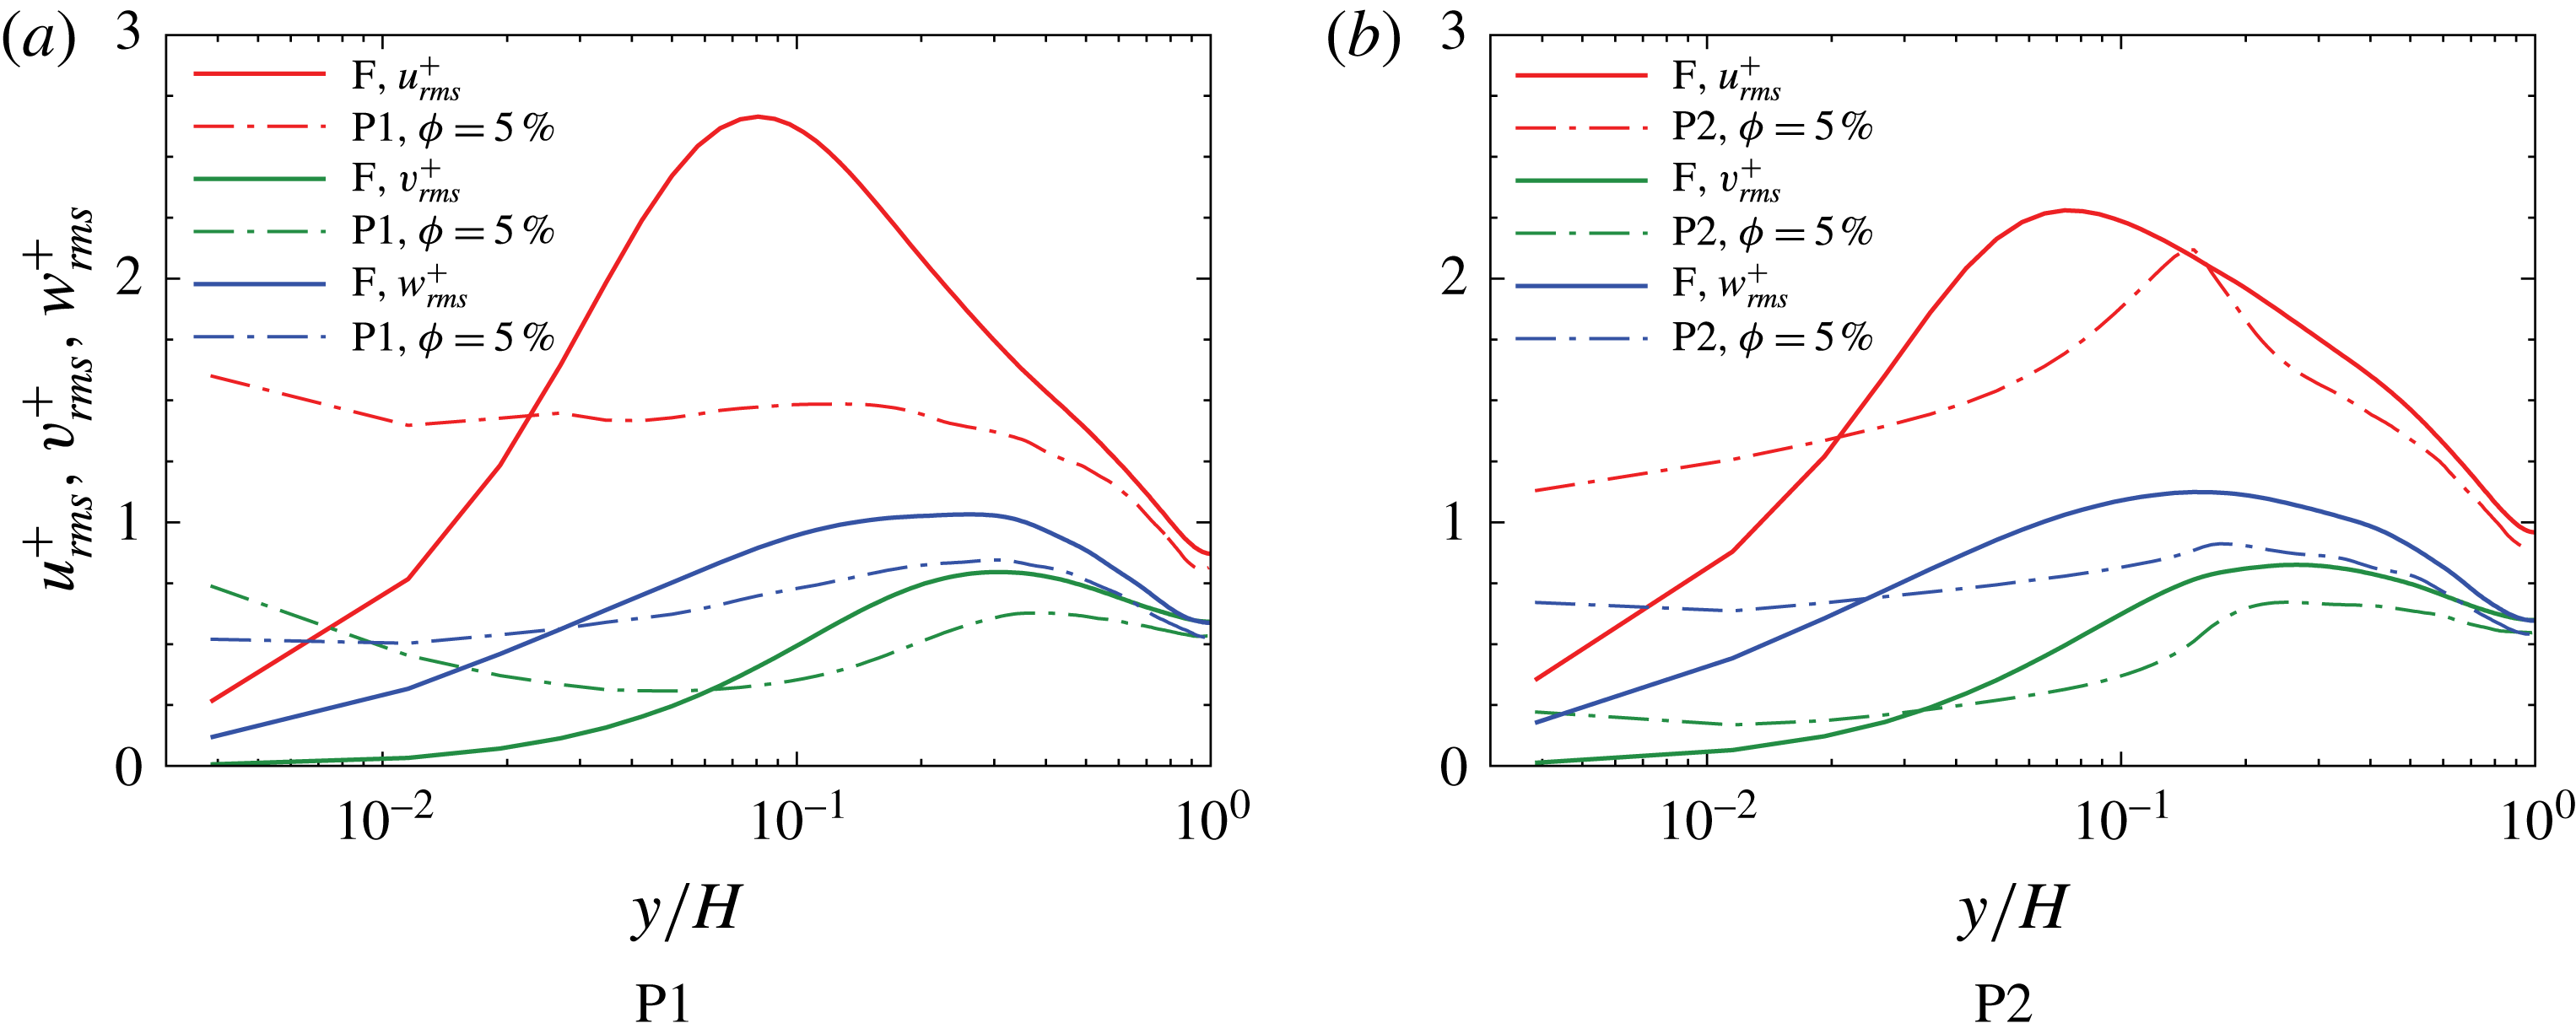
The r.m.s. of the translational velocity fluctuations of the particles are shown in figure 14 and compared to the relevant ones for the fluid. Particles show generally lower velocity fluctuations than the fluid except for a small area in the vicinity of the wall. Lower velocity fluctuations of particles can be attributed to their inertia. Thus, particles resist the effects of fluid turbulence. Near the walls, particle–particle and particle–wall collisions lead to higher particle velocity fluctuations. Particles, in contrast to the fluid, do not have a no-slip boundary condition at the wall and thus can experience higher than zero velocity fluctuations at the wall. Moreover, spheres have considerably higher streamwise fluctuations than oblate spheroids for most of the channel height. The peak point of streamwise velocity fluctuation of spherical particles is different from that of fluids and corresponds to the location of maximum local concentration of spheres. Close to the wall, oblate spheroids have higher fluctuations than spheres, in particular in the wall-normal direction. Non-sphericity of oblate spheroids leads to a higher effect of wall collisions on their fluctuating velocity. For spheres, collisions mainly occur at the point of contact and the particle moves away from the wall after collision. For oblate spheroids, the probability of particle contact with the wall at different particle areas in a short time is higher as they can rotate after collision and another part of the particle then approaches the wall. A local minimum value of spanwise fluctuations at
 $y/H\approx 0.06$
(
 $y^{+}\approx 11$
) is observed for the examined oblate spheroids.
R.m.s. velocity fluctuations of the particles compared to relevant ones of the fluid (F).

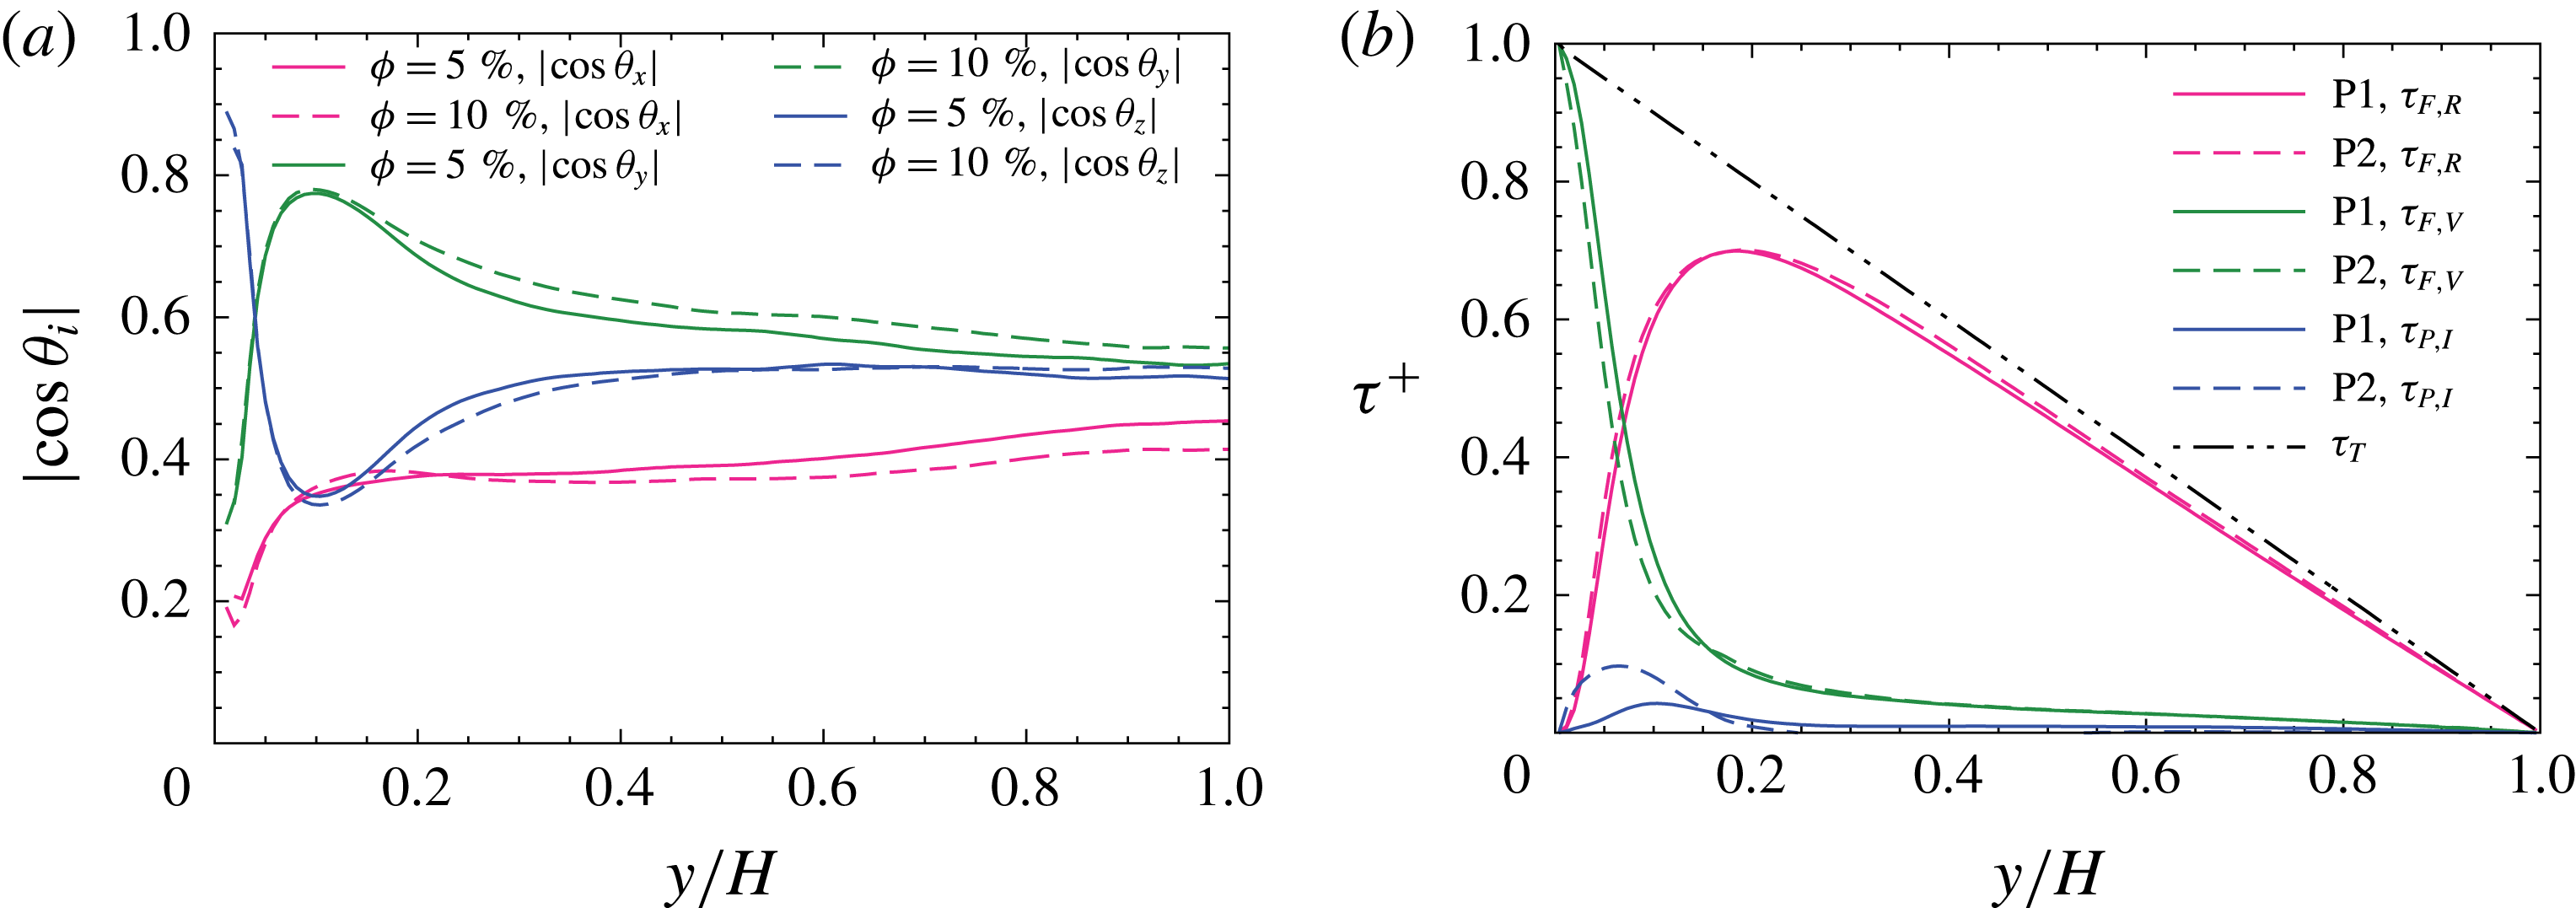
(a) Mean cosine of particle (P1) orientation angle versus distance from the wall for two volume fractions of 5 % and 10 %, (b) contribution of viscous stress (
 $\unicode[STIX]{x1D70F}_{F,V}$
), Reynolds stress (
 $\unicode[STIX]{x1D70F}_{F,R}$
) and particle stress (
 $\unicode[STIX]{x1D70F}_{P,I}$
) to the total stress (
 $\unicode[STIX]{x1D70F}_{T}$
).

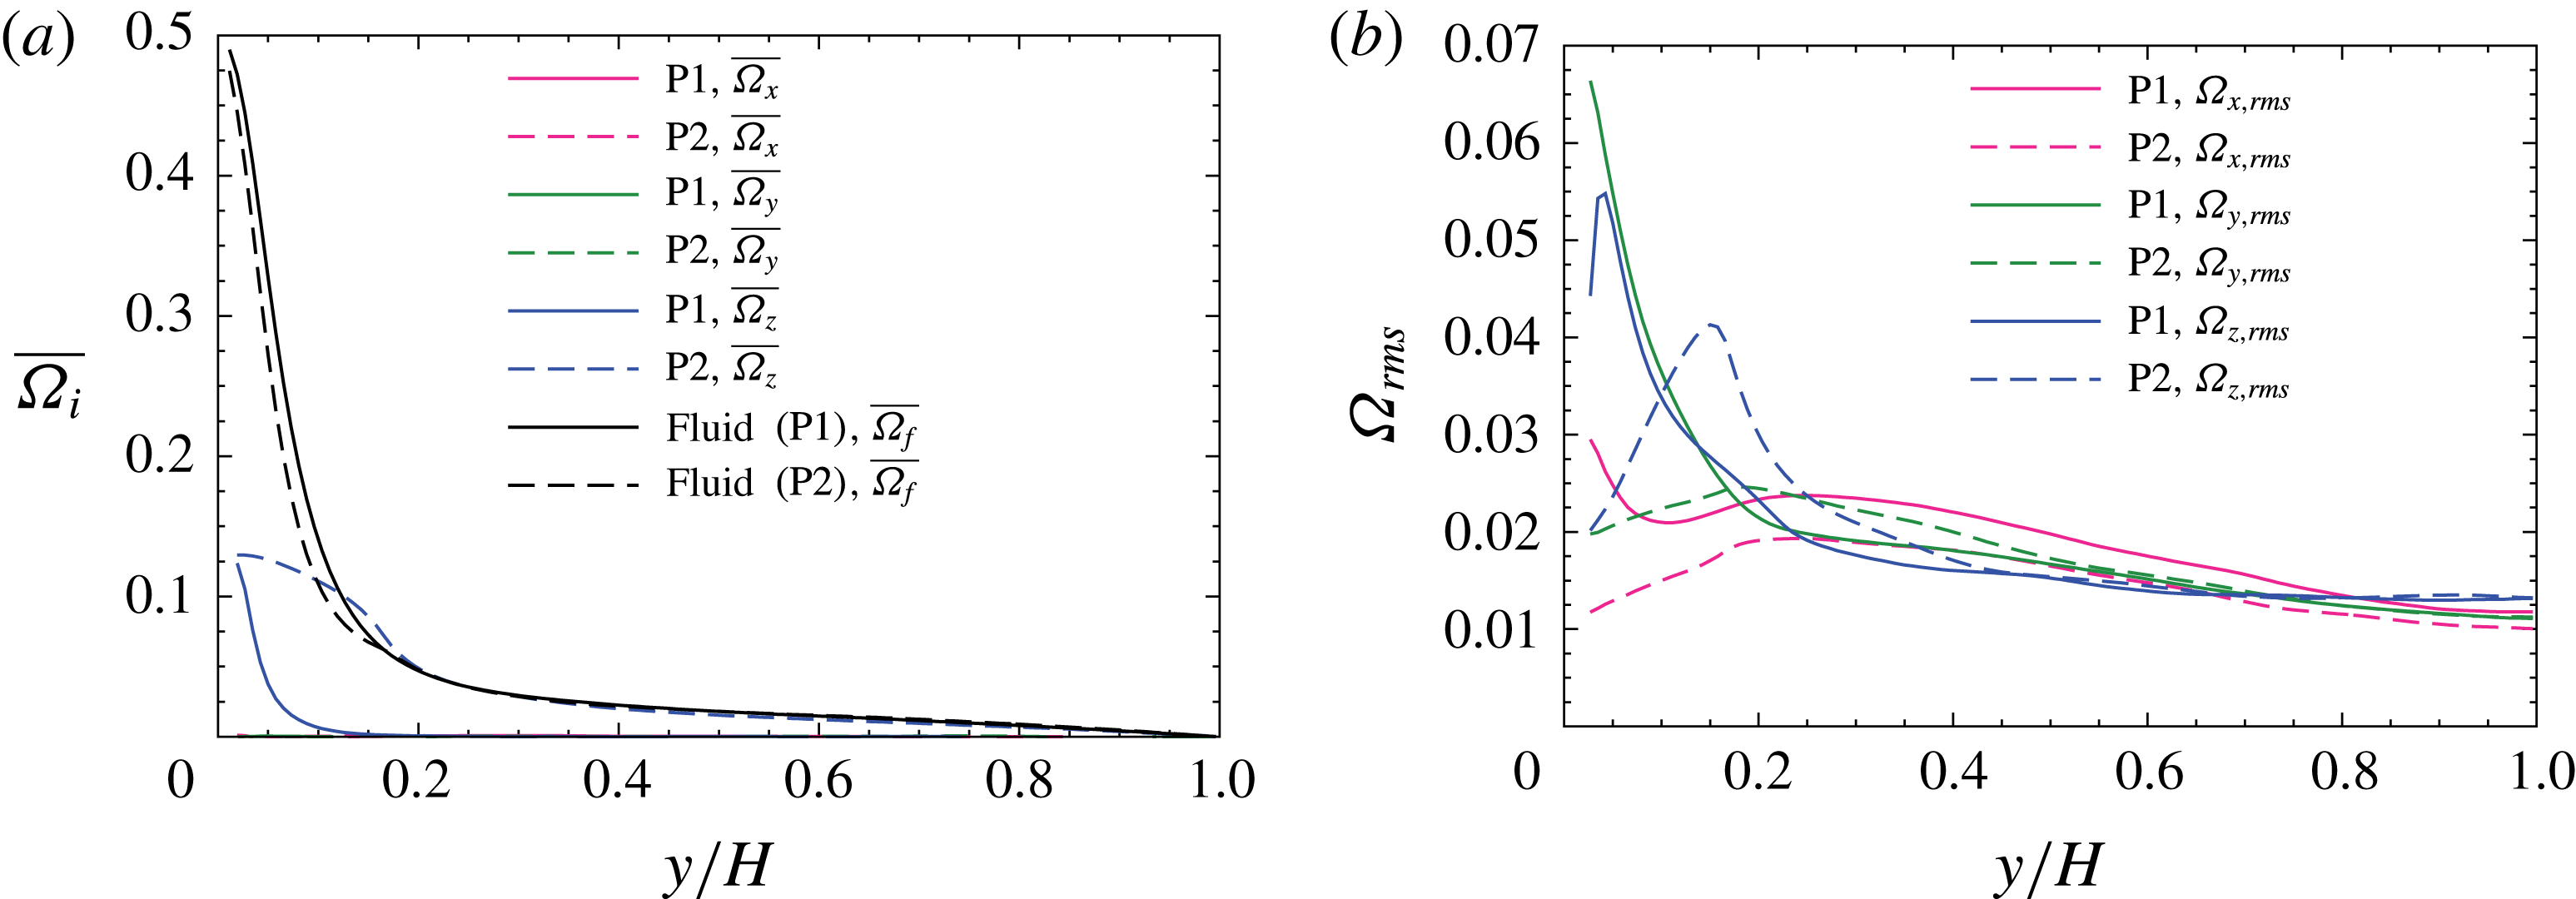
(a) Mean particle angular velocity (
 $\unicode[STIX]{x1D719}=5\,\%$
) compared with the mean fluid rotation rate, and (b) r.m.s. of the angular velocity fluctuations of the particles (
 $\unicode[STIX]{x1D719}=5\,\%$
).

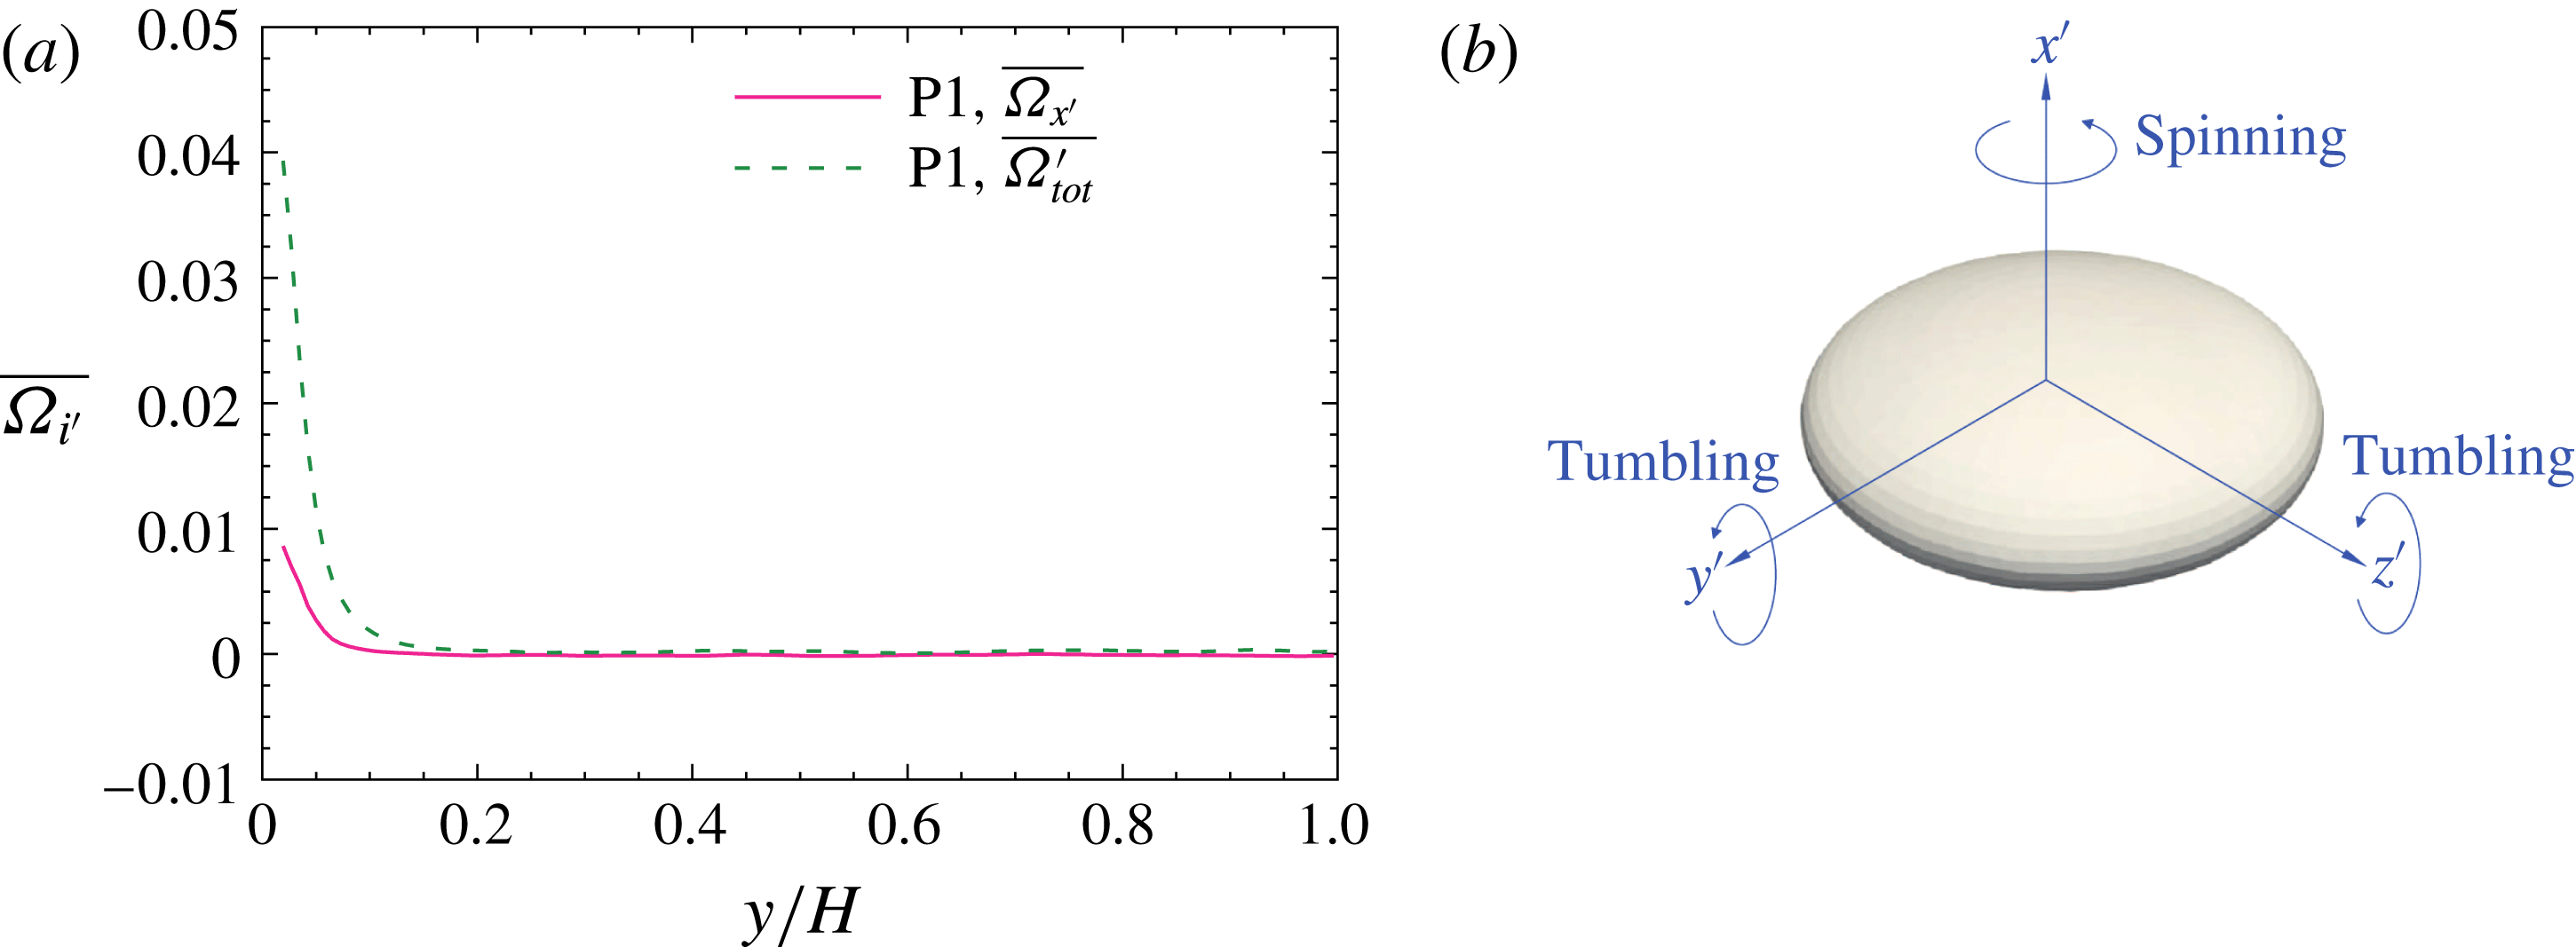
While the orientation of a spherical particle in the flow field is irrelevant, the orientation of oblate spheroids is important and influences the particle dynamics. Figure 15(a) shows the cosine of the particle orientation angle versus distance from the wall. The orientation cosine
 $|\text{cos}\,\unicode[STIX]{x1D703}_{i}|$
is defined based on the angle between the particle symmetry axis and each of the world (inertial) reference axes. It is clearly seen that finite-size oblate spheroids mostly tend to be oriented with their symmetry axis along the wall-normal direction. Thus oblate spheroids are mostly moving parallel to the wall. Particles alignment along the streamwise direction is the least probable one for almost the whole channel height. This type of preferential orientation is different from prolate spheroids, which are shown to be oriented along the streamwise direction (Eshghinejadfard et al.
Reference Eshghinejadfard, Hosseini and Thévenin2017b
). The preferential orientation of oblate spheroids is shifted to the spanwise (
 $z$
) direction on approaching the solid wall at
 $y/H<0.04$
(
 $y^{+}<7$
); such alignment in the direction of the mean fluid vorticity vector in the vicinity of the wall would accelerate the spinning of oblate spheroids on the velocity-gradient plane (
 $xy$
plane), which is consistent with the sharp increase of spanwise angular velocity of oblate spheroids at
 $y/H<0.04$
(figure 16). We think that the preferential orientation of oblate spheroids in the spanwise direction is due to the effect of mean shear, since in the vicinity of the wall the shear is strong and the level of turbulence is low. Challabotla, Nilsen & Andersson (Reference Challabotla, Nilsen and Andersson2015a
) observed that an inertial oblate spheroid in a linear shear flow tends to rotate in the velocity-gradient plane irrespective of initial orientation. However, the preferential alignment of oblate spheroids in the wall-normal direction damps the angular velocity in the spanwise direction. Similar observations have been found for tiny tracer oblate particles (Challabotla et al.
Reference Challabotla, Zhao and Andersson2015c
). The preferential orientation decreases gradually towards the channel centre and the orientation cosines approach 0.5, i.e. isotropic orientation due to isotropy of the vorticity field. In the channel centre, the mean shear is small and therefore the competition of turbulence and particle alignment by mean shear leads to random orientation of oblate spheroids (Voth Reference Voth2015). Random orientation of spheroidal particles in the channel centre has been also observed in our simulations of resolved prolate spheroids (Eshghinejadfard et al.
Reference Eshghinejadfard, Hosseini and Thévenin2017b
). The effect of particle concentration can also be detected by comparing the two curves at
 $\unicode[STIX]{x1D719}=5\,\%$
and 10 %. Higher volume fraction slightly increases the particle orientation in the wall-normal direction and reduces its alignment in the streamwise direction. The isotropy of orientations is more pronounced for
 $\unicode[STIX]{x1D719}=5\,\%$
due to the more isotropic turbulence field. The effect of volume fraction is mainly seen beyond the buffer layer. In general, the orientation of resolved oblate spheroids resembles that of tiny oblate spheroids with low inertia, previously discussed by Challabotla et al. (Reference Challabotla, Zhao and Andersson2015c
); these particles are also found to align with their symmetry axis normal to the vorticity vector. Tiny oblate spheroids of large inertia, on the other side, are shown to be oriented in the direction of fluid vorticity. The orientation of oblate spheroids in figure 15 resembles the data of Ardekani et al. (Reference Ardekani, Costa, Breugem, Picano and Brandt2017) for a higher tendency of particles with alignment parallel to the walls; however, their simulations show an almost perfect alignment in the
 $y$
direction at the wall (i.e.
 $|\text{cos}\,\unicode[STIX]{x1D703}_{y}|\approx 1$
) that could be due to the smaller oblate spheroids considered in that study. Our simulations instead show a local peak near the walls that is similar to previous observations of other non-spherical particles of relatively low asphericity (Marchioli et al.
Reference Marchioli, Fantoni and Soldati2010; Do-Quang et al.
Reference Do-Quang, Amberg, Brethouwer and Johansson2014; Challabotla et al.
Reference Challabotla, Zhao and Andersson2015b
).
The orientation of particles can be explained by the fluid Lagrangian stretching/compression analysis. Zhao & Andersson (Reference Zhao and Andersson2016) showed that in turbulent channel flows, the fluid vorticity vector is aligned with the strongest Lagrangian stretching direction in the channel centre region. On approaching the wall, this alignment vanishes and the fluid rotation vector is oriented perpendicular to the direction of maximum stretching and also maximum compression. It was also seen that in the near-wall turbulence of channel flows, strongest Lagrangian compression is in the wall-normal direction. Looking at figure 15(a), we can reason that the symmetry axis of resolved oblate spheroids also mainly tends to orient with the direction of Lagrangian compression.
Figure 15(b) illustrates the contribution of different stresses, including the fluid Reynolds stress
 $\unicode[STIX]{x1D70F}_{F,R}$
, fluid viscous stress
 $\unicode[STIX]{x1D70F}_{F,V}$
, and particle-induced stresses
 $\unicode[STIX]{x1D70F}_{P,I}$
, to the total stress
 $\unicode[STIX]{x1D70F}_{T}$
for P1 and P2 at
 $\unicode[STIX]{x1D719}=5\,\%$
based on a streamwise momentum budget (Zhang & Prosperetti Reference Zhang and Prosperetti2010; Picano et al.
Reference Picano, Breugem and Brandt2015; Yu et al.
Reference Yu, Lin, Shao and Wang2017). The total stress is equal to
 $\unicode[STIX]{x1D70F}_{T}=\unicode[STIX]{x1D70F}_{F,V}+\unicode[STIX]{x1D70F}_{F,R}+\unicode[STIX]{x1D70F}_{P,I}$
. The viscous shear stress profile is the same as the mean spanwise vorticity (
 $\overline{\unicode[STIX]{x1D714}_{z}}$
) because
 $\overline{\unicode[STIX]{x1D714}_{x}}=\overline{\unicode[STIX]{x1D714}_{y}}=0$
. The sum of fluid viscous and Reynolds shear stresses no longer equals the total stress (Reynolds stress deficit) due to the effect of particles. A qualitatively similar distribution of particle stress induced by tiny spheres has been reported by Lee & Lee (Reference Lee and Lee2015). The total shear stress shows a linear reduction from the wall to the channel centre. Moreover, for most of the channel height, fluid Reynolds stress has the major contribution to the total stress for both particle types. The contribution of particle stress (sum of the particle Reynolds stress and inner stress) is larger for the case of spherical particles than that for oblate spheroids. Therefore, we can deduce from this figure that the larger reduction of the mean fluid velocity by spheres is also due to the larger amount of particle-induced stresses rather than the change of the fluid Reynolds stress. It is also seen that spherical particles cause a narrow peak compared to a broader peak for oblate spheroids that is similar to the observations of Ardekani et al. (Reference Ardekani, Costa, Breugem, Picano and Brandt2017). The peak point for spheres is also located closer to the wall. The location of the peak point of particle stress for spherical particles (
 $y/H\approx 0.07$
) resembles that of the smaller spherical particles (
 $D/H=1/9$
) used by Picano et al. (Reference Picano, Breugem and Brandt2015). Thus, sphere size appears to have less effect on the location of maximum particle-induced stress; however, it can influence the magnitude of the stress. Another interesting point is that the location of the local peak of particle stress for oblate spheroids coincides with the location of maximum particle alignment along the wall-normal direction.
Figure 16(a) compares the mean particle angular velocity (normalized by
 $u_{\unicode[STIX]{x1D70F}}^{2}/\unicode[STIX]{x1D708}$
) for oblate spheroids and spheres at
 $\unicode[STIX]{x1D719}=5\,\%$
in one-half of the channel. Clearly, the rotational velocity around the spanwise direction is dominant for both particle types because of the high shear rate near the walls, while the mean spin in the two other directions tends to zero. Interestingly, spheres have a higher spanwise angular velocity than oblate spheroids for all the domain height, which could be due to the isotropic orientation of spheres. Near the wall, the spanwise rotational velocity of oblate spheroids decays very rapidly. One influencing factor is the non-sphericity of oblate spheroids, which limits particle rotation after collision with the wall. Alignment of oblate spheroids parallel to the wall also contributes to the reduction of spanwise angular momentum. This is common to other particle Reynolds numbers. Oblate particles that are rotating in a simple shear flow at low Reynolds numbers are found to experience a high angular velocity when the symmetry axis is in the flow-gradient plane and parallel to the streamwise direction. They experience a minimum angular velocity when they are in the flow-gradient plane but their symmetry axis is oriented normal to the streamwise direction (Jeffery Reference Jeffery1922). These periodic motions are called Jeffery orbits. When these rotation modes bring the symmetry axis of particles to the wall-normal direction, the particles spend a long time in this orientation before continuing their tumbling motion, and therefore a strong wall-normal orientation of oblate spheroids is observed. Alignment of the symmetry axis of oblate spheroids in the wall-normal direction damps vortices and can reduce drag. The higher rotation rate of spheres is an important factor for generating small vortices near the walls.
Figure 16(a) also compares the mean fluid rotation rate (
 $\overline{\unicode[STIX]{x1D6FA}_{f}}$
), which is half of the local fluid vorticity. For oblate spheroids, the mean fluid rotation rate is always higher than the particle angular velocity. For spheres, particles show a higher rotation rate than the fluid around
 $0.1<y/H<0.2$
. This effect can be due to the presence of rapidly rotating particles that are transported from the near-wall region to this part of the buffer layer (Wang et al.
Reference Wang, Peng, Guo and Yu2016). Near the walls, spheres have a lower rotation rate than the fluid. It is also seen that the fluid rotation is higher in the oblate-spheroid-laden case compared to the sphere-laden flow before
 $y/H\approx 0.2$
. After this point, the two curves are quite close to each other.
The r.m.s. of the angular velocity fluctuations of the particles is shown in figure 16(b). For oblate particles, spanwise and wall-normal fluctuation profiles are close to each other except near the wall (
 $y/H<0.05$
), where these particles show slightly higher wall-normal angular velocity fluctuations. For the case of spheres, spanwise fluctuations are mostly higher than the two other components and a peak around
 $y/H\simeq 0.15$
can be observed. The growing isotropy of angular velocity fluctuations near the centre is clearly seen from the graph for both particle types. It is also observed that oblate spheroids have stronger fluctuations of the streamwise angular velocity than spheres.
To investigate the type of particle rotation (spinning or tumbling), the angular velocity in the particle frame around the symmetry axis (
 $\overline{\unicode[STIX]{x1D6FA}_{x^{\prime }}}$
) (corresponding to the spinning motion) and the total angular velocity (
 $\overline{\unicode[STIX]{x1D6FA}_{tot}^{\prime }}=(\overline{\unicode[STIX]{x1D6FA}_{x^{\prime }}}^{2}+\overline{\unicode[STIX]{x1D6FA}_{y^{\prime }}}^{2}+\overline{\unicode[STIX]{x1D6FA}_{z^{\prime }}}^{2})^{0.5}$
) are plotted in figure 17(a) based on the definition of figure 17(b).
 $\overline{\unicode[STIX]{x1D6FA}_{y^{\prime }}}$
and
 $\overline{\unicode[STIX]{x1D6FA}_{z^{\prime }}}$
denote particle tumbling. It is seen that the spinning motion takes place in the near-wall region because of alignment of the particle symmetry axis in the fluid vorticity direction (spanwise) and also the high shear rate in this area. Spinning motion vanishes very rapidly at
 $y/H\simeq 0.1$
as the particle is mainly parallel to the wall at this location. However, tumbling is more probable than spinning even in the near-wall area. Tumbling motion continues to a farther distance from the wall (
 $y/H\simeq 0.2$
). Beyond this point, mean body-fixed rotation rates approach zero, which is consistent with vanishing angular velocities in the inertial frame (figure 16
a).
(a) Mean particle (P1) angular velocity (
 $\unicode[STIX]{x1D719}=5\,\%$
) in body-fixed frame (spinning,
 $\overline{\unicode[STIX]{x1D6FA}_{x^{\prime }}}$
; total,
 $\overline{\unicode[STIX]{x1D6FA}_{tot}^{\prime }}$
), (b) schematic of an oblate spheroid with the illustration of spinning and tumbling motions.

5 Conclusions and outlook
The lattice Boltzmann method has been used in this work for the first time to explore the dynamics of fully resolved oblate spheroids in turbulent channel flows. Particle concentration belongs to the dense regime and all particle–fluid, particle–particle and particle–wall interactions are taken into account. By using a different flow solver (LBM) and different method for updating the particle rotation (quaternions), the drag-reduction effect of resolved oblate spheroids reported by Ardekani et al. (Reference Ardekani, Costa, Breugem, Picano and Brandt2017) is confirmed. Considering different particle sizes and analysing in detail the particle–turbulence interaction, drag-reduction mechanism, and particle statistics, new insights into this complex system are provided. Based on this study the following conclusions can be drawn.
(i) Drag reduction of 1.3 % by oblate spheroids (
 $\unicode[STIX]{x1D706}=1/3$
) at a volume fraction of
$\unicode[STIX]{x1D719}=10\,\%$
is observed. For
$\unicode[STIX]{x1D719}=5\,\%$
, oblate spheroids slightly reduce the mean fluid velocity (by
$1.2\,\%$
). However, the particle-laden fluid velocity profile coincides with the single-phase profile in the core region. Spheres, on the other hand, demonstrate a large velocity reduction of 8.7 % as a result of a major reduction in the fluid velocity profile in the buffer and core regions.
(ii) Although spheres induce large fluid velocity fluctuations close to the wall, oblate spheroids do not show this effect. Oblate spheroids reduce the fluid velocity fluctuations in most of the channel height, increasingly so at higher concentrations. The effect of particle type on velocity fluctuation behaviour is less in the channel centre.
(iii) By examining the spanwise autocorrelation of streamwise velocity fluctuations and the r.m.s. of the vorticity fluctuations, it is found that particle-laden flows have smaller but stronger vortices. Streak spacing is increased in the drag-reduction regime of oblate spheroids at
$\unicode[STIX]{x1D719}=10\,\%$
. These two contrary effects (stronger vortices versus coarser streaks) lead to minor drag reduction by rigid particles compared to other drag-reduction agents such as polymers, where vortices are much weaker than in the single-phase flow. Moreover, another mechanism of vortex generation exists and the role of near-wall vortices is found to be important.(iv) Since vortices are stronger even in the drag-reduction regime, their strength is not the only factor to initiate drag reduction, even if it has a great influence on the level of drag reduction. Also, reduction of Reynolds shear stress cannot solely guarantee the occurrence of drag reduction, since particle shape and size play important roles. Large spherical particles reduce the Reynolds stress while drag is increased.
(v) Spherical particles show a local peak of concentration near the walls, while the concentration of oblate spheroids increases gradually and reaches a constant value without showing any peak. Spheres also show a higher concentration than oblate spheroids near the walls because of the higher strength of streamwise vortices and stronger sweep motions.
(vi) Oblate spheroids are mainly aligned parallel to the wall (symmetry axis being in the wall-normal direction), which is different from the alignment of resolved prolate spheroids. Preferential orientation of oblate spheroids is stronger close to the wall and weaker in the channel centre. Very close to the wall, oblate spheroids have a dominant spanwise orientation of the symmetry axis and the wall-normal orientation is reduced on approaching the wall.
(vii) Both spheres and oblates have smaller velocity fluctuations than the fluid, except for a near-wall region due to particle–wall interactions. Streamwise velocity fluctuations of spheres are found to be larger than for oblate spheroids.
(viii) The spanwise rotational velocity of spheres is much larger than that of oblate spheroids. The strong preferential orientation of oblate spheroids contributes to their lower rate of rotation. Moreover, the spanwise angular velocity of oblate spheroids shows a rapid decay, while this profile shows a gradual descent for spherical particles.
(ix) The influence of oblate aspect ratio and density on fluid and particle statistics will be examined in the next step of this study. Different particle parameters can modify fluid and particle statistics. This analysis will support the identification of particles with large drag-reduction effects.


Acknowledgements
A.E. and D.T. acknowledge the financial support of the German Research Foundation (DFG) within the graduate college for ‘Micro–macro-interactions in structured media and particle systems’ (GRK 1554) and the EU programme ERDF (European Regional Development Fund) within the research centre of dynamic systems (CDS). L.Z. is grateful for the support of Natural Science Foundation of China through Grants no. 11702158, 91752205 and 11490551.