Since the emergence of influenza (flu) began hundreds of years ago, Reference Potter1 outbreaks of influenza virus have been periodic. In addition, because of its strong infectious qualities and its ability to mutate easily, a global influenza pandemic could result in severe human, economic, and social consequences. In the past decade, with the quicker growth of urbanization and population concentration, influenza pandemic has been the greatest threat to global public health. 2 These diseases can evolve and spread rapidly, greatly affecting people’s health and happiness and even affecting the country’s stability and security. In addition, these days, almost every time, the emergence of new or mutated virus has posed an enormous threat to people, as in the case of severe acute respiratory syndrome (SARS), Reference Donnelly, Ghani and Leung3 H1N1, Reference Domínguez-Cherit, Lapinsky and Macias4 and coronavirus disease 2019 (COVID-19). Reference Jia, Lu and Yuan5 Meanwhile, these new situations have brought great challenges to traditional disease surveillance and infection control. Research on influenza is of great academic and practical significance. Thus, how we respond to these threats deserves further study.
Influenza has affected people’s lives because of its great infectivity and variability. For that reason, flu control and prevention have received much attention from researchers and governments. Today, many traditional influenza prevention and control systems are in operation, such as the World Health Organization (WHO) Global Influenza Surveillance Network (FluNet), the US Outpatient Influenza-like Illness Surveillance Network (ILINet), and the European Influenza Surveillance Network (EISN). However, offline data are associated with problems such as a wide range of sources, long reporting cycles, and high costs. Data collection requires many resources to maintain, and it cannot be updated on a timely basis.
Our goal is to explore the association between the characteristics of the users on social networks and the susceptibility to influenza. In this study, we analyze and extract influenza-related information from all other information of users in social networks, which features many advantages such as efficiency, low cost, and real-time information. Additionally, we choose influenza-related Weibo updates of users to measure the susceptibility to influenza. Furthermore, we establish rankings on the basis of in-degree centrality to quantify the social network status of users. Then, we can explore the interplay between social network status and influenza. Also, we extract users’ physical condition feature from social media based on LDA topic model to conduct its correlation analysis with flu. Throughout this process, different machine learning techniques are applied to classify influenza-related information separately from all other information in an automatic and effective manner.
The value of our research lies in revealing the laws behind the phenomenon of online disease transmission, and providing important evidence for analyzing, predicting, and preventing disease transmission. From the perspective of common medical knowledge, social network is considered irrelevant to disease transmission vectors because online interactions do not lead to people’s direct contact. However, from the findings of our research, social media has become an invisible transmission vector for diseases in a sense. We speculate that the possible reasons include 2 points. (1) People with higher social media status have greater influence in social network interactions. Meanwhile, social media is also a vehicle for emotion transmission. A large number of studies proved that emotions may affect people’s physical health. Reference Hershfield, Scheibe and Sims6–Reference Tyra, Griffin and Fergus8 (2) It means that people with high social media status have a large number of followers. Most often they are not only involved in frequent online activities, but are also invited to participate in corresponding social activities offline. It contributes to a high probability of being infected as well.
This research has important theoretical implications. It provides further evidence that there is a link between user characteristics in social networks and influenza. It also proves that Sina Weibo has great value in disease research. It is reliable to use social media data to conduct research related to epidemics and other health-related issues. Although there are several factors leading to distortion of social media data, we clean and filter the data during the experiment, and also compare different classifiers to exclude irrelevant data. Meanwhile, the use of machine learning further improves the accuracy and reliability of the data. The practical contributions appear in providing a classification model for detecting influenza-related Weibo messages. According to the results, users in social networks can be identified as belonging to different groups on the basis of their susceptibility to influenza. Therefore, we provide a scientific basis for public health intervention.
Throughout this article, from the perspective of social networking status, we divided the users into different groups to find vulnerable groups. In addition, we provided theoretical help to individuals who focus on maintaining their health. Therefore, we provided a basis for judgments for targeted health prevention and intervention measures and furnished better help to improve public health. In future work, we will dig more into the characteristics of users in social networks and explore the relationship between these characteristics and influenza. Our results will be useful for the allocation of influenza prevention resources.
Related Works
Due to the rapid advancement of Internet technology, the Internet has gradually become accepted as an important tool for modern people to access information and communicate. Meanwhile, as an important platform for people to use to express their opinions and emotions and interact with others, we can obtain user-generated content easily and in real time from social networks.
The emergence of social networks has provided an opportunity for health-related research. Reference Edo-Osagie, De La Iglesia and Lake9,Reference Nguyen, Larsen and O’Dea10 Some studies attempt to make use of data from social media to support those systems Reference Charles-Smith, Reynolds and Cameron11 and also demonstrate the reliability of social media data. Reference Shan and Lin12 Early prediction of seasonal epidemics like influenza can be enhanced by using social networking sites and Web blogs for real-time analysis, which enables faster tracking and better predictions compared with traditional methods. Social media data provide an efficient resource for disease surveillance and early warnings, offering an alternative solution to slow and expensive approaches like ILINet. Reference Alessa and Faezipour13 Scanfeld et al.(2010) analyzed Twitter status updates mentioning antibiotics to categorize their content and identify cases of misunderstanding or misuse. The results revealed various categories and instances of misunderstanding or abuse, particularly related to the combination of antibiotics with “flu” and “cold.” Reference Scanfeld, Scanfeld and Larson14 Aramaki et al. (2011) used the Twitter API to obtain flu-related tweets for correlation testing, which proved the feasibility of social media data to reflect the real world. Reference Aramaki, Sachiko and Mizuki15 Twitter data have been used to predict the swine flu pandemic. Reference Ahmed, Bath and Sbaffi16 Yousefinaghani et al. (2019) collected and analyzed posts discussing avian influenza on Twitter to assess the Twitter’s potential for outbreak detection, and the proposed approach was empirically evaluated using a real-world outbreak-reporting source. It is found that 75% of real-world outbreak notifications of AI were identifiable from Twitter. Reference Yousefinaghani, Dara and Poljak17 Paul et al. (2014) showed that Twitter data can help reduce the forecasting error in ILI prediction and advance 2 to 4 wk ahead of baseline models. Reference Paul, Dredze and Broniatowski18 Aiello et al. (2020) studied the public health tracking and prevention, addressing the importance of social media- and Internet-based data in disease surveillance. Reference Aiello, Renson and Zivich19 Lampos et al. (2015) indicated that a nonlinear query modeling approach delivers the lowest cumulative nowcasting ILI rate error, and suggested that query information significantly improves autoregressive inferences, obtaining state-of-the-art performance. Reference Lampos, Miller and Crossan20 The research of Masri et al. (2019) found that Zika tweets were a significant predictor of ZIKV cases, with model evaluation demonstrating that weekly ZIKV case counts could be predicted 1 week in advance. The results showed models using Twitter data are better predictors of Zika virus epidemic than models using traditional case report data. Reference Masri, Jia and Li21 Samaras et al. (2020) collected data on influenza in Greece from Google and Twitter and compared with influenza data from the official authority of Europe. The result shows that Google and Twitter both have potential to estimate and predict influenza but Twitter has some advantages over Google for that it achieves slightly better accuracy. Reference Samaras, García-Barriocanal and Sicilia22
Many studies have proven the correlation between social status and citizens’ health. Hoebel et al. (2017) and Huynh and Chiang (2018) investigated the correlation between subjective social status and health (blood pressure, somatic symptoms, etc.) in adults and adolescents, respectively. Reference Hoebel, Maske and Zeeb23,Reference Huynh and Chiang24 Stringhini et al. (2017) introduced 25 × 25 risk factors into the model to observe the contribution of socioeconomic status and these conventional risk factors to mortality and life loss. Reference Stringhini, Carmeli and Jokela25 Not only physical health, but also social status has an impact on citizens’ mental health. Reference Fournier26,Reference Uecker and Wilkinson27 Euteneuer et al. (2021) used panel data to provide new insights into the longitudinal pathway of subjective social status and health. Reference Euteneuer, Schäfer and Neubert28 In addition to subjective social status, objective socioeconomic status has also been shown to correlate with physical health. Reference McMaughan, Oloruntoba and Smith29 Moreover, unequal socioeconomic status in different regions and communities has different effects on physical and mental illness. Reference Kivimäki, Batty and Pentti30–Reference Peverill, Dirks and Narvaja32 According to research, immune function and social status in the real world were found to be directly correlated. Reference Tung, Barreiro and Johnson33
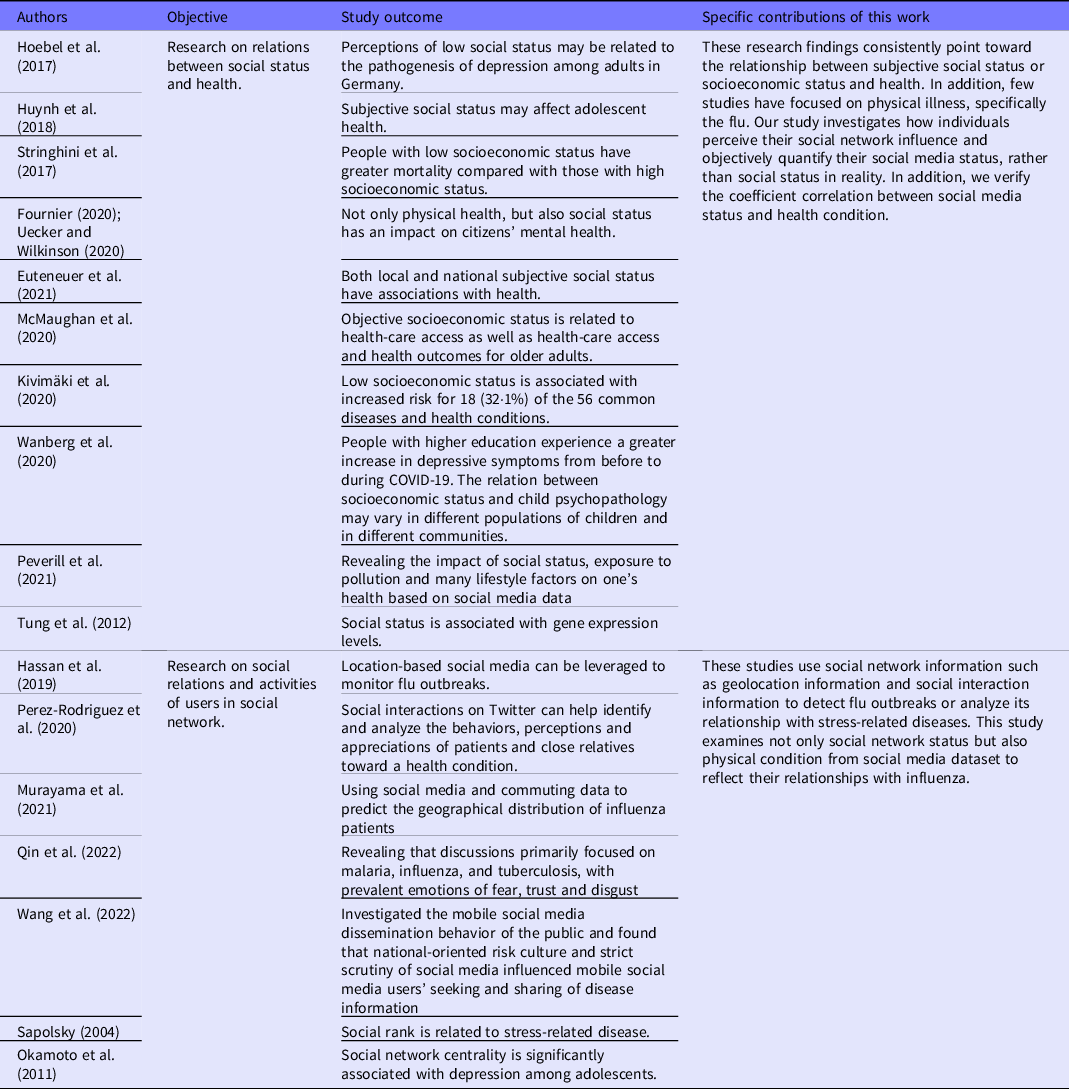
In addition, some research shows that social network data are also used to study social relations and activities of users in that social network. For example, data from social media can be used to reveal influenza transmission based on the users’ location and social ties. Reference Hassan Zadeh, Zolbanin and Sharda34 Perez-Rodriguez et al. (2020) used data from social media to build models, revealing the impact of social status, exposure to pollution, and many lifestyle factors on one’s health. Reference Perez-Rodríguez, Pérez-Pérez and Fdez-Riverola35 This research shows that the characteristics or behaviors of a user within a social network are likely to be relevant to their health, and different individuals or groups may have different health conditions. Murayama et al. (2021) proposed a method using social media and commuting data to predict the geographical distribution of influenza patients and validated the accuracy of the predictions against weekly influenza patient data from health authorities, serving as ground truth. Reference Murayama, Shimizu and Fujita36 Qin and Ronchieri (2022) analyzed a large dataset of tweets related to various pandemics and explored natural language processing techniques to extract insights from unstructured text comments, revealing that discussions primarily focused on malaria, influenza, and tuberculosis, with prevalent emotions of fear, trust (specifically related to HIV/AIDS), and disgust. Reference Qin and Ronchieri37 Wang et al. (2022) investigated the mobile social media dissemination behavior of the public and found that national-oriented risk culture and strict scrutiny of social media influenced mobile social media users’ seeking and sharing of disease information during public health emergencies. Reference Wang, Xiong and Wang38 However, most of the studies focus on the prediction of flu trends. There are relatively few influenza-related studies targeted at the differences among different groups in social networks. Social rank can influence the health of an individual, particularly with respect to stress-related disease, but the relationship between social status and infectious disease still needs more study and verification. Reference Sapolsky39 The research of Okamoto et al. (2011) supports a negative association between social network status, in-degree centrality, and depressive symptoms. Reference Okamoto, Johnson and Leventhal40 Further comparison with the latter 2 parts of the literature is presented in Table 1.
Comparison of previous research and proposed work

Methods
This section describes the methods we use to automatically identify influenza-related information (indicating that the user has caught influenza) authored by users and to quantify the susceptibility of people to influenza, the social network status, and the physical condition of users. First, we screen influenza-related data on the basis of Weibo messages. Then, for each selected unique user, we mine the total number of Weibo messages, the exact count of influenza-related Weibo, and the in-degree of nodes to obtain the measurement of the index. Finally, we explore the relationship between the social network status of users and their susceptibility to influenza and also study the relationship between the physical condition and susceptibility to influenza. We will walk through these steps in detail in the upcoming subsections.
Modeling the Detection of Influenza-Related Information
We built a model to apply to Chinese short text classification such as the contents of Weibo. We used 6 different classifiers to find a method that had the best performance. Machine learning consists of supervised (classification and regression) and unsupervised (clustering and generalization) learning but also semi-supervised and ensemble learning. Reference Chang and Chang41 The classifiers used in this study include k-nearest neighbor, decision tree, SVM, naïve Bayes (NB; multinomial model and Bernoulli model). These classifiers help us to distinguish between Weibo messages indicating that the user is suffering from influenza (label 1) and all other information (label 0).
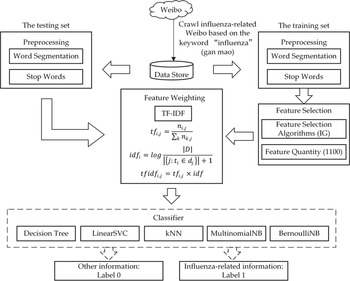
Before the classification, we outlined some steps to process these data. First, in terms of preprocessing, this study contains 2 approaches: the first 1 is Chinese word segmentation, and the second is removing stop words. The stop words used in this study are sourced from the stop words list released by the Natural Language Processing Laboratory at Harbin Institute of Technology. Second, we use information gain (IG) to extract the features that benefit classification. IG is an important index in the selection of features. A feature is important for bringing more information to the classification system. The most popular feature selection method is IG, which works well with texts and has often been used. Reference Lee and Lee42 Finally, according to the features, we complete the vectorization of texts by using TF-IDF. Reference Jones43 The TF-IDF algorithm is always used to weigh each word in the text according to how important it is, and it captures the relevancy among words, text documents, and particularities. Reference Aizawa44
Then, we use machine learning techniques to distinguish texts and filter useless texts. The entire process is shown in Figure 1.
Model of detection of influenza-related information.

Modeling Correlation: Social Network Characteristics and Susceptibility to Influenza
In this section, we quantify the social network characteristics of users, including social network status and physical condition, as well as the susceptibility to influenza. We quantify the individuals’ susceptibility to influenza using a ratio of the quantity of the user’s influenza-related Weibo messages divided by the user’s total number of Weibo messages. In a social network, users will share their health-related information, which can be used to infer health status and incidence rates for specific conditions or symptoms. Reference Santos and Matos45,Reference Shan, Yan and Wei46 First, through the classifier in the previous step, we obtain the Weibo messages that describe authors with influenza. Then, we mine all Weibo messages of these authors containing the keywords “influenza” (gan mao).
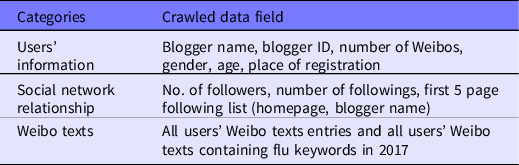
Due to the differences in social media platforms and language characteristics, the processing of Chinese text differs from other languages. First, Chinese words are typically represented at the character level, unlike English words separated by spaces. Therefore, in Chinese text processing, it is necessary to perform word segmentation, dividing continuous sequences of characters into meaningful words. Word segmentation is a critical step in Chinese text processing and plays an important role in subsequent text analysis and semantic computation. Second, in the context of Chinese expression, descriptions of influenza symptoms by patients may have certain colloquial features. This is because colloquial expressions are closer to everyday conversations and real-life language usage situations. Moreover, on social media platforms, users tend to use colloquial language styles to express their emotions and feelings. The degree of colloquial features used in Chinese Weibo texts may vary depending on individual differences and the characteristics of social media platforms. Therefore, when analyzing Chinese Weibo texts, this study combines feature extraction techniques and language models to capture and understand these colloquial expressions, accurately extracting and analyzing information related to influenza symptoms. Table 2 shows the raw crawled data information aggregated in user dimensions.
Raw crawled data field

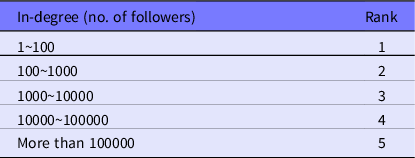
We use these data as inputs for the classifier to screen out valuable influenza-related data. We also need to count the number of influenza Weibo messages of each person. In addition, we obtain each individual’s total number of Weibo messages. Regarding social network status, this article differentiates these users by relying on the in-degree centrality. Centrality is a concept commonly used in social network analysis (SNA) and is an attribute of nodes (users in the network) that is used to quantify network locations of nodes. Reference Uddin, Hossain and Wigand47 Centrality is considered to be a structural attribute of social networks in this study and is, therefore, widely used as an indicator to measure the importance of nodes in the network. Reference Gomez, Gonzalez-Aranguena and Manuel48–Reference Lee, Lee and Oh50 Degree Centrality was formally proposed for the first time in the paper by Linton C. Freeman. Reference Freeman51 It is one of the basic measures, suggesting the sum of 1 node directly connected to other nodes and is divided into in-degree centrality and out-degree centrality when the connection is directional. In-degree centrality represents other nodes connecting to a particular node. Reference Carboni52 It always relates to studies of popularity. Reference Cadini, Zio, Petrescu, Setola and Geretshuber53 For the characteristics of social relations in Weibo, as a large and complex network, it is difficult to obtain centrality data. If building a small network, the results may be inaccurate due to the small sample size. Therefore, we consider the in-out degree concept in the complex network to measure the social network status. We regard individuals with more followers as people who have high social network status, while people who have low social network status are defined as individuals with fewer followers. As is shown in Table 3, there is a high standard deviation in followers, adversely affects subsequent correlation analysis. According to Likert scale, 5 ordered levels are often considered as the level of variable scales measurement, Reference Likert, Roslow and Murphy54 so we determine 5 social ranks to describe the position of users in Sina Weibo.
Descriptive statistics of followers

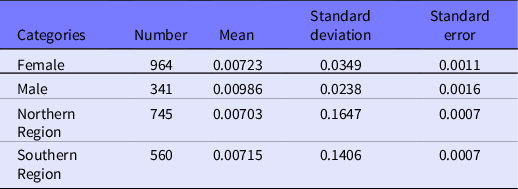
From Table 4, it can be observed that although gender and region do not have a significant impact on the frequency of updates, there is a notable difference in sample size between males and females. The sample size of females is 4 times larger than that of males, indicating that females are more likely to post influenza-related information when experiencing flu symptoms. Additionally, there is no significant difference in data volume between northern and southern regions, suggesting that regional factors may not play a prominent role in the frequency of updates related to influenza.
Descriptive statistics of gender and region of user susceptibility

Table 5 shows the distribution of users’ followers with different in-degree levels. The social ranks from 1 to 5 indicate the increase in in-degree. The user’s in-degree reflects the user’s social influence. Users’ in-degree is approximately long-tail distribution, which indicates that influential users in a social network are always in the minority. Reference Xiang55 If the number of followers is less than 100, the social rank is 1, and if the number of followers is between 100 and 1000, the social rank is 2. Table 5 provides details of the definition.
Division of social network status

After obtaining these indicators, we study the relationship between social network status and susceptibility to influenza using the rank correlation coefficient (Spearman). We use the Spearman correlation coefficient because it has less strict requirements on the data conditions as long as the observations of the 2 variables are paired rank ratings data, or rank data converted from continuous variable observation data. Reference Spearman56,Reference Heinen and Valdesogo57 The rank correlation coefficient is given by
 $${\rho _s} = 1 - {{6\sum {d_i^2} } \over {n\left( {{n^2} - 1} \right)}},$$
where
 ${{\rm{\rho }}_{\rm{s}}}$
is the Spearman rank relational coefficient,
 ${{\rm{d}}_{\rm{i}}}$
is the difference between
 ${x'_i}$
and
 ${y'_i}$
,
 ${x'_i}$
and
 ${y'_i}$
represent the position of the original data in a sorted sequence.
In addition, we also quantify the physical condition of users to measure its relationship with influenza susceptibility. First, before modeling, all the Weibo texts of target users experience preprocessing, word segmentation, and de-stopping words, etc. Second, the topic distribution and keywords are obtained by LDA topic model. Then we set 50 topics to output for LDA model, as each topic contains 10 keywords with probability. Finally, the topic related to physical condition are selected and summarized from the results of LDA. Meanwhile, 4 representative keywords under the topic are screened out and listed in Table 6.
Results of word clustering by Word2vec

Next, the Word2vec Reference Mikolov, Chen and Corrado58 model is adopted to carry out word clustering, finding the similar words of the existing 4 representative keywords under each topic. We choose the CBOW model and a 300-word vector dimension. In addition, words with frequency less than 2 are ignored. The training data of Word2vec is consistent with the corpus used in LDA training. After training, the top 10 words with the highest similarity of each given keyword are reserved. We remove the duplicated words from all of the similar words to obtain the final dictionary. The results of clustering similar words by Word2vec are shown in Table 6.
After expanding the keyword library, we match all the keywords in Weibo texts. Once the keywords of the corresponding topic appear in a text, it will be marked. Finally, we count the number of Weibo texts with corresponding keywords as the topic score of each target user and calculate the ratio of the topic score and the total number of Weibo texts to represent the variable of the topic preference. Because the variable under the topic of physical condition is continuous, we compute its Pearson correlation coefficient with the susceptibility to influenza. The Pearson correlation coefficient is given by,
 $${r_{X,Y}} = {{cov\left( {X,Y} \right)} \over {{\sigma _X}{\sigma _Y}}} = {{\sum\nolimits_{i = 1}^n {\left( {{X_i} - \bar X} \right)} \left( {{Y_i} - \bar Y} \right)} \over {\sqrt {\sum\nolimits_{i = 1}^n {{{\left( {{X_i} - \bar X} \right)}^2}} } \sqrt {\sum\nolimits_{i = 1}^n {{{\left( {{Y_i} - \bar Y} \right)}^2}} } }}$$
where
 ${r_{X,Y}}$
is the Pearson correlation coefficient,
 $cov\left( {X,Y} \right)$
is the covariance of variables
 $X$
and
 $Y$
,
 ${\sigma _X}$
and
 ${\sigma _Y}$
represent the standard deviation of
 $X$
and
 $Y$
, respectively.
In the following sections, the experiment and results on the basis of our models will be introduced in detail.
Results
This section describes the experiments. We follow the model set up in the previous sections to obtain the results.
This work is based on data gained from Sina Weibo, one of the most popular social media platforms in China. According to Sina’s first-quarter results of 2017, Sina Weibo now has more than 340 million active users worldwide and has surpassed Twitter. Sina Weibo is China’s largest microblogging service. Reference Xu, Wang and Dan59 Weibo allows users to post 140-character messages. Similar to Twitter, relationships between users on Twitter are not necessarily symmetric. Users can follow friends or interesting users without being followed back.
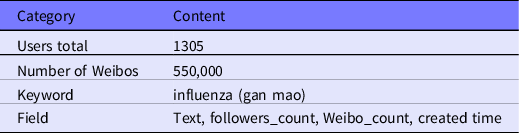
Using crawler software, we collect a sample of Weibo messages based on the keyword “influenza” (gan mao). We follow the principle of privacy protection, and all information obtained from crawler software is public information. We generate a random number behind each piece of Weibo data, rearrange it using random number sorting, and select 100+ pieces of data as the result of random sampling every month from January to December 2017. Finally, a total of 1305 unique users are used as samples for analysis (see Table 7). Next, we crawl all the public posts of the 1305 users, a total of 550,000 pieces of data generally. Because this work studies individuals’ susceptibility to influenza and is about the vulnerability of the users, we also have a second mining of all of the tagged user’s influenza-related Weibo messages.
Summary statistics of the data and collected field

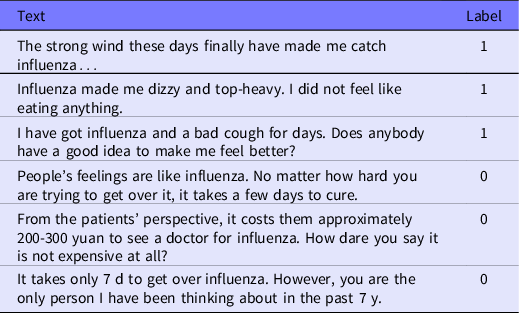
In the text classification stage, 1760 records selected randomly from all crawled Weibo messages are used as training samples and testing samples. The dataset was assigned to 8 humans to label. Before officially labeling, we conducted prelabeling training for the 8 people and provided them unified labeling rules. In the process of officially labeling, each member was required to label 220 records according to unified labeling rules without communication to intentionally make the marked category accurate. After labeling, these data are divided into influenza-related information and all other information. Table 8 shows the tagged Weibo text. In this table, we show 6 messages from 6 unique users on Sina Weibo. Label 1 represents that these texts accurately describe a user who suffers influenza. Conversely, Label 0 indicates that the texts do not reflect the user’s health. Next, we categorize 1320 records as the training set and the remaining records as the testing set. To compare and select the most appropriate classifier, we use 4 different kinds of classifiers, including NB, SVM, decision tree, and kNN. In this process, we also use IG to select a different number of features to determine the best combination of feature dimensions and classifiers. The indicators we applied to evaluate the experimental result of each classifier are accuracy, precision, recall, and F1-score. These 4 indicators are commonly used evaluation indicators for machine learning classification algorithms. Reference Conway, Doan and Kawazoe60 Accuracy is the proportion of true results (both true positives and true negatives) among the total number of cases examined, which means it is an important statistical measure of how well a binary classification test correctly identifies an item. Reference Metz61 The precision, recall, and F1-score, which are usually used together, are also other important indicators to measure classifier performance. The F1-score is a comprehensive consideration of precision and recall.
Tagged Weibo text

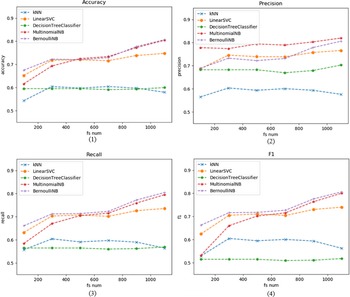
Figure 2 illustrates the results of detecting influenza-related information. The horizontal axis is the number of features (100-1100). The experiment started with selecting 100 features and ended with 1100 features. The vertical axis represents the accuracy, precision, recall, and F1-score, respectively. The machine learning methods used in this model are described in the rectangle in the upper left corner. Each line in Figure 2 represents a machine learning method.
Performance of different classifiers.

As shown in Figure 2(1), the accuracy of kNN and decision tree performance are both lower than 0.6. The performance of the 2 modes of NB is relatively good, but when the number of features is less than 600, the difference becomes obvious, and the Bernoulli NB performs stably. In terms of precision in Figure 2(2), we can see that the multinomial NB maintains the highest precision in the process. The Bernoulli NB performs better when the number of features increases, while the kNN and decision tree still underperform. With the increase in features, the accuracy and precision of kNN decline. Other classifiers meanwhile increase their performance as the number of features increases. From the perspective of the recall shown in Figure 2(3), the performance of NBs is still the most stable, and it is worth noting that when the number of features is less than 600, the performance of SVM (linear SVC) is better than that of multinomial NB, whose recall reaches 0.6-0.7. From the F1-score results in Figure 2(4), Bernoulli NB maintains the best performance.
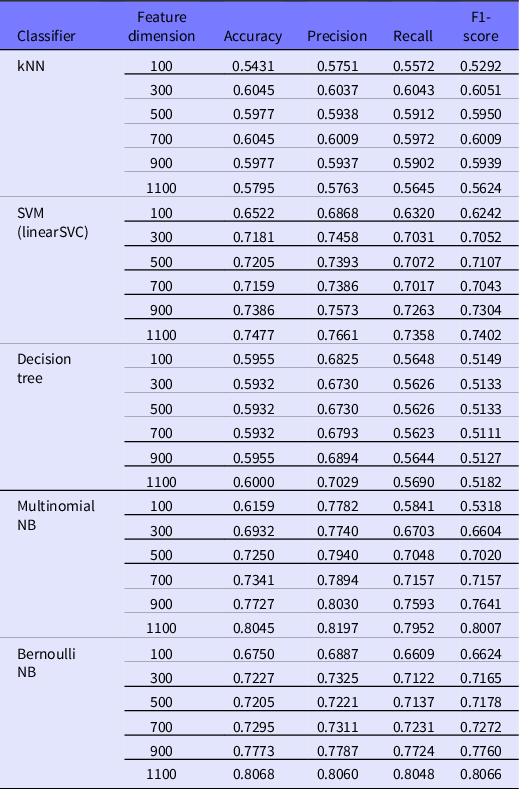
In summary, Bernoulli NB shows the best performance in the process, suggesting the NB has obvious advantages in this binary classification and a stable performance. Therefore, we choose 1100 features and use Bernoulli NB for classification. The model has the best performance. The accuracy reaches 80.68% and the F1-score reaches 80.66% on the testing set. The complete classifier performance statistics are shown in Table 9. To obtain the optimal result, the IG is used for feature selection, with a dimension of 1100, and Bernoulli NB is applied to classify all the Weibo messages.
Performance statistics comparison of different classifiers

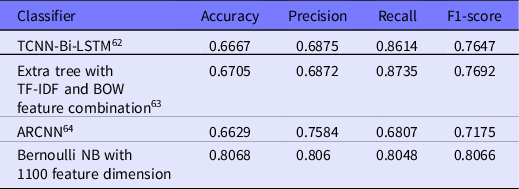
We also compare the best-performing machine learning model (ie, Bernoulli NB) in our study with several deep learning models from reference, Reference Aslan62–Reference Raj and Meel64 and the comparative results are presented in Table 10. It can be observed that, due to the limitation of data availability, the performance of the deep learning models did not surpass that of the Bernoulli NB.
Performance statistics comparison with deep learning classifiers

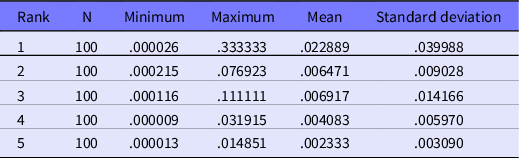
According to the above results, we use Bernoulli NB to classify all text, and we obtain the total number of influenza-related Weibo messages from each individual by using this classifier. As stated earlier in this article, we can express the individuals’ susceptibility to influenza by using this ratio. Regarding social network status, according to the method in the model, we divide these data into 5 social ranks. Then, we randomly select 100 records from every social rank for correlation analysis. Table 11 shows descriptive statistics of individuals’ susceptibility to influenza in each rank (1-5).
Descriptive statistics of susceptibility to influenza

Each rank contains 100 users. Rank 1 means the in-degree centrality of users between 1 and 100 and users of rank 5 have more than 100,000 followers. As we can see in Table 11, the mean of influenza susceptibility decreases with increasing rank. Although there are no obvious trends at ranks 2 and 3, this situation may be caused by extreme values determined from the maximum, minimum and standard deviation. However, it does not affect the overall trend.
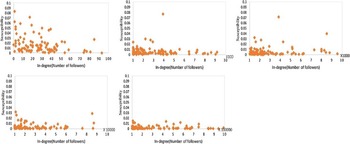
Figure 3 shows the association between the measure of individuals’ susceptibility to influenza and social network status. From the chart, we can see that groups that possess different numbers of followers in the social network have different results of the susceptibility to influenza. With the increasing quantity of followers (horizontal axes), individuals’ susceptibility to influenza decreases (vertical axes). The outcome is consistent with the results shown in Table 11. For example, in the group of individuals with 1-100 followers, we can infer that they are very vulnerable to infection. In addition, in the group of individuals with more than 100,000 followers, we can easily discover that they are less susceptible to influenza because these points are very concentrated and close to zero. Applying the rank correlation coefficient, we quantified the relationship between individuals’ susceptibility to influenza and social network status, and we found a moderate correlation and a significant negative correlation, with a correlation coefficient of −0.427 (P < 0.001).
Association between susceptibility and social network status.

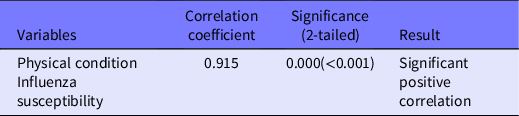
As for the physical condition topic identified from the Weibo texts, we carry out Pearson correlation coefficient to analyze. As shown in Table 12, when users focus on their physical condition, their susceptibility to influenza and corresponding topics show a significant positive correlation. It suggests that users who post more Weibo texts about physical condition may have a higher flu susceptibility. Through the observation of the keywords in the topic, the Weibo texts describing the physical condition are mostly related symptoms and sensitive emotions to the physical condition.
Pearson correlation coefficient between physical condition and influenza susceptibility

In general, regarding the 3 research questions addressed in this study, the following conclusions can be drawn. First, in identifying and classifying influenza-related tweets, the Bernoulli NB model achieved better classification performance with an accuracy of 0.8068. The proportion of a user’s influenza-related tweets can be used as an indicator to calculate influenza susceptibility. Second, the experimental results indicate a moderate negative correlation between social status and influenza susceptibility. This means that individuals with higher social centrality have a lower susceptibility to influenza. Third, there is a significant positive correlation between the user’s reported physical condition on social media and influenza susceptibility. These findings contribute to a better understanding of the relationship between social media, individual characteristics, and influenza susceptibility. The results highlight the potential of social media data in studying and predicting the spread of influenza and provide insights for public health interventions and prevention strategies.
Discussion
In this study, we choose Sina Weibo for our research. Sina Weibo is one of the most influential and popular social media platforms in China. According to the latest first quarter of 2017 results for Sina Weibo, as of March 31, the number of Sina Weibo monthly active users reached 340 million, meaning the platform has overtaken Twitter as the world’s largest independent social media company. In China, as one of the most popular social media platforms, Sina Weibo is also used for scientific research. Reference Shan, Zhao and Wei65 For example, Xu et al. (2019) trained a classifier to identify and detect rumors from a mixed set of true information and false information. Reference Xu, Wang and Dan59 Chen et al. (2020) found that sentiment influences the retweet patterns and retweet speed of social media. Reference Chen, Mao and Li66 However, disease-related research is relatively rare, and most of these studies are targeted for surveillance of infectious disease. Reference Woo, Cho and Shim67–Reference Yoo, Kim and Yang69 In addition, there is research revealing significant differences in the microblogging behavior on Sina Weibo and Twitter. Reference Ma, Yang and Wilson70 One significant difference lies in the language patterns used on Weibo and Twitter. While English is predominantly used on Twitter, Weibo is a Chinese microblogging platform where the majority of content is in Chinese. This language distinction has implications for text analysis and natural language processing techniques applied to social media data. For instance, the Chinese language relies on character-based representation, necessitating the use of segmentation techniques to identify meaningful words or phrases within a continuous stream of characters. User behavior also differs between Weibo and Twitter. Weibo users tend to engage in more active and frequent interactions, often using various multimedia formats such as images, videos, and emojis to convey their messages. On the other hand, Twitter users may focus more on concise and succinct expressions due to the platform’s character limit. These differences in user behavior influence the content and style of conversations, as well as the types of information shared on each platform. Furthermore, cultural influences play a significant role in shaping the dynamics of social media in Chinese contexts. Chinese culture values collectivism and group harmony, which can be reflected in the way users communicate and interact on Weibo. Users may emphasize consensus-building, social connections, and shared experiences, which in turn affect the topics discussed and the sentiment expressed on the platform. Understanding these cultural influences is crucial for interpreting social media data accurately and comprehensively. Therefore, Weibo data merit in-depth analysis to determine the link between disease and social network status.
Although previous studies have shown that people’s social status can affect their health, there is not much evidence of the relationship between social status in networks and influenza susceptibility, which needs to be further explored. In this study, we distinguish between individuals in the social network from the aspect of social network status and study the differences in susceptibility to influenza among different groups. Before this step, we obtain classification results by developing a Bernoulli NB classifier. This is a necessary precondition for further progress, as false labels will disturb the experimental results. Next, we showed a moderate negative correlation (R = −0.427; P < 0.001) between susceptibility to influenza and social network status through rank correlation analysis. This result indicates that people with higher social network status are more likely to have lower susceptibility to influenza. From this result, we can see that people who have low in-degree centrality in Sina Weibo (i.e, people with low social network status) may be more susceptible to influenza, although we cannot accurately explain this tendency through medicine. However, it has been proven in the previous literature that people with lower social rank are more prone to stress-induced illness. In addition, in real life, people with lower social status have less time and energy to take measures to care about their health. Through this experiment, we have also demonstrated that, to a certain degree, social status in the network also reflects social rank in real life. Furthermore, we conduct another experiment on the correlation between users’ physical condition and their susceptibility to influenza. Pearson correlation coefficient showed that there was a significant positive correlation (R = 0.915; P < 0.001) between them. It means that people who prefer to share their physical condition on social media tend to receive a higher susceptibility. In real life, human immunity and the disorder of metabolism are typical of people’s physical condition, and such characteristics are also reflected in the health-related information of social media.
This study explores the relationship between different network characteristics and influenza susceptibility by identifying infectious users in social networks and distinguishing them from different feature dimensions. Through this research, we can identify people who are susceptible to influenza and consider them key populations for early monitoring and control to avoid further spread of the epidemic. The experimental results show that individuals with low in-degree centrality are key targets for influenza monitoring, reminding and encouraging high-susceptibility populations to pay attention to their own health. Moreover, users who are already showing symptoms of diseases also have higher susceptibility to influenza. At the same time, this study explores a reasonable relationship between social network characteristics and influenza. This is an important step in identifying health-related factors from social networks, and it also provides a theoretical basis for public health surveillance. In addition, we find that social media data, as a “social sensor”, are a supplementary information source for disease-related research and have crucial research value.
The innovation of this study, compared with previous research, is mainly reflected in the following aspects. First, this study focuses on the relationship between individuals’ social media status and influenza susceptibility. Previous studies may have overlooked individual-level differences and susceptibility factors. This study aims to investigate the influence of individual-level differences in social networks on influenza susceptibility. This individual-focused approach provides us with a deeper understanding and helps uncover individual contributions to influenza transmission within social networks. Second, this study uses machine learning algorithms for text classification to ensure accurate identification and selection of Weibo posts describing users’ own illness conditions from randomly crawled Weibo texts. By avoiding “zombie users,” ie, inactive users, we can ensure the authenticity of the data and the users’ activeness. Third, this study quantifies influenza susceptibility using social media data. Unlike previous studies, we not only consider the number of influenza-related Weibo posts in quantifying susceptibility but also introduce ratios as a measure. The advantage of this approach is that it eliminates the influence of users’ posting frequency and habits on social networks. By comparing the number of influenza-related Weibo posts with the total number of posts made by users on social media, we can more accurately quantify individual influenza susceptibility.
The significance of the 3 research questions can be summarized as follows. The significance of Question 1 lies in the accurate identification of influenza-related information through machine learning algorithms applied to Weibo texts. This provides a reliable data foundation for further research on influenza transmission. By proposing a quantitative model for influenza susceptibility, it becomes possible to quantify users’ overall susceptibility to influenza and explore factors related to influenza transmission at the social network level. The contribution of this research question lies in providing an effective method for identifying influenza-related information and establishing a quantitative model for influenza susceptibility in social networks. The importance of Question 2 lies in evaluating users’ status and influence in social networks by using the in-degree metric from complex network theory and analyzing its correlation with influenza susceptibility. This helps us understand the impact of status and influence in social networks on influenza transmission. By validating the correlation coefficient between the in-degree metric and influenza susceptibility, further confirmation of the association between social network status and influenza can be obtained, providing new insights into the mechanisms of influenza transmission. The significance of Question 3 lies in the application of the LDA topic model to extract users’ physical condition information from Weibo texts and analyze its correlation with influenza susceptibility, which reveals the potential impact of health conditions on influenza transmission. This approach can help us explore users’ health conditions from a social media perspective, providing important reference for influenza prediction and intervention measures.
The potential value and applications of this research are multifaceted and impactful. First, studying the association between social network status and influenza susceptibility can help predict the spread of influenza within social networks. Key individuals or highly connected individuals within social networks may play crucial roles in the transmission of influenza. Understanding the relationship between social network status and influenza susceptibility can assist in identifying high-risk groups and targeted interventions, enabling better prediction and control of influenza transmission. Second, the findings from the research on social network status and influenza susceptibility can be used for health education and promotional activities. By understanding the characteristics and status of individuals with higher susceptibility within social networks, tailored health education measures and communication strategies can be developed. This can enhance awareness of influenza, strengthen preventive measures, and encourage individuals to adopt appropriate prevention and protection measures. Last, studying the relationship between social network status and influenza susceptibility can provide guidance for social media monitoring and information dissemination. Understanding the impact of social network status on the spread of influenza-related information can help design more effective information dissemination strategies, targeting individuals with different social statuses for directed communication and interventions. Additionally, leveraging social media platforms to provide real-time influenza information can facilitate better monitoring and response to influenza outbreaks.
In summary, studying the association between social network status and influenza susceptibility has implications for predicting and controlling influenza transmission within social networks, guiding health education and promotional activities, and improving social media monitoring and information dissemination strategies for influenza.
Conclusions
The H1N1 influenza pandemic occurred in 2009. By the end of 2009, at least 12,000 people had died because of the H1N1 influenza virus. Although we have a well-established monitoring system and vaccines to prevent and control the spread of this virus, the acceleration of population growth and urbanization has also introduced new factors in controlling the spread of influenza. The increase in population density and structural changes have greatly increased the probability of the transmission of infectious diseases in cities. Meanwhile, traditional influenza research is mainly based on traditional monitoring data. Most of the data come from hospitals and laboratories and are associated with high costs. Moreover, there is a lag in the collection of information. With the rapid development of social networks, people’s lifestyles and information sources have undergone great changes. Today’s social networks often have hundreds of millions of users interacting with each other and expressing themselves. Social networks are a new data source, and this development presents an important opportunity for influenza-related research and infection control.
Regarding the theoretical contributions, this article focuses on mining data from social networks. In recent years, access to public information on social networks has become very popular. There is also much research that proves that social network data are a reliable source of information, but most of it is foreign-related research. This research proves that Sina Weibo, as one of most popular social networks in China, also has great value in disease-related research. This experiment demonstrates a reasonable connection between social network status and influenza susceptibility, which is an important step in mining health-related factors from social networks. On this basis, we can put forward future studies in the field of disease. Our research is not just theoretical; it also has practical implications. In this study, we performed some disease-related work. Traditional health-related research is time-consuming and requires much human effort to collect data. Therefore, traditional methods are not conducive to timely disease surveillance and control. However, through social networks, we can easily and efficiently access users’ information and without requiring the active participation of individuals. Therefore, we cannot only improve the reliability of the collected data but also lower costs by reducing the intermediate steps. Through the results of this study, individuals of low social network status can be identified as the key targets of influenza surveillance, and we also provide a theoretical basis for the public. Moreover, these results contribute to encouraging individuals with high influenza susceptibility to pay attention to their health.
Data availability
The data presented in this study are available on request from the corresponding author.
Acknowledgments
The authors gratefully acknowledge the support of Beijing Key Laboratory of Emergency Support Simulation Technologies for City Operations. In addition, the authors thank the anonymous reviewers for insightful comments that helped us improve the quality of the study.
Author contributions
Conceptualization, Qi Yan and Siqing Shan; Data curation, Siqing Shan and Yiting Luo; Formal analysis, Qi Yan and Menghan Sun; Funding acquisition, Siqing Shan; Investigation, Qi Yan; Methodology, Qi Yan, Siqing Shan, Baishang Zhang and Menghan Sun; Project administration, Siqing Shan; Re-sources, Siqing Shan; Software, Qi Yan, Siqing Shan, Weize Sun and Yiting Luo; Supervision, Qi Yan and Siqing Shan; Validation, Qi Yan, Siqing Shan, Weize Sun and Menghan Sun; Visualization, Qi Yan, Baishang Zhang and Feng Zhao; Writing – original draft, Qi Yan and Menghan Sun; Writing – review & editing, Qi Yan, Siqing Shan, Baishang Zhang, Weize Sun, Menghan Sun, Feng Zhao and Xiaoshuang Guo.
Funding
This research was funded by National Natural Science Foundation of China, grant number 72071010 and by National Natural Science Foundation of China, grant number 71771010.
Competing interests
The authors declare no conflict of interest. The authors declare that we have no financial and personal relationships with other people or organizations that can inappropriately influence our work, there is no professional or other personal interest of any nature or kind in any product, service or company that could be construed as influencing the position presented in, or the review of, the manuscript entitled.
Ethical standards
This study was based on an analysis of social media data from Sina Weibo, which is a non-interventional study. We purchased the data collection service from Gooseeker. Gooseeker is an authorized API (Application Programming Interface) of Sina Weibo. The data does not involve private information such as personal name, gender, age, etc., and does not involve privacy and other related issues. All data can be used legally and does not require ethical approval.
Consent for publication
Not applicable.