Introduction
5G mobile communication technology is evolving to cater the need for high-quality communication among the ever-increasing number of mobile terminals. Huge wireless data traffic lead to the development of multi-element antenna systems with rising performance constraints such as interoperability, support for many frequency bands, and conformity to specific absorption rate (SAR) requirements [Reference Wang, Liu, Wang, Wei and Lu1, Reference Jemaludin, Al-Gburi, Elabd, Saeidi, Akbar, Ibrahim and Zakaria2]. The millimeter-wave and sub-6 GHz frequency bands are the backbone of 5G technology, and especially the sub-6 GHz range is crucial for long-distance communication [Reference Ishteyaq and Muzaffar3]. Microstrip antennas are still widely utilized because of their number of benefits, including affordability, lightweight design, versatility in shape, and compatibility with both monolithic and hybrid microwave circuits. Multi-input multi-output (MIMO) antennas, based on microstrip structure, have been established as the viable technology to meet the complex and conflicting requirements of the 5G applications [Reference Muttair, Shareef and Taher4].
Achieving sufficient isolation between elements is crucial for the MIMO antenna system, and different approaches, including defected ground structure (DGS), are effectively utilized to enhance the isolation and thereby shape the radiation characteristics [Reference Ibrahim, Ibrahim and Shairi5]. Though high radiation gain is sought to meet the coverage requirements, it is also important to ensure the radiation is within the safe absorption levels for human usage. SAR depicts the amount of electromagnetic radiation absorbed by the human tissue during the use of the mobile phone. The designed antenna should abide by the SAR restrictions specified by the international standards for safe usage [Reference Zhang Guo, Yu, Liu, Cheng, Yun Xue, Liu and Shi6].
Related literature
This section surveys the work reported in the literature employing DGS and characteristic mode analysis (CMA) in 5G microstrip sub-6 GHz band antennas.
Previous work in DGS
A rectangular antenna with an L-shaped defected ground operating in the frequency range of 4.8–5 GHz is reported to exhibit an envelope correlation coefficient (ECC) less than 0.31 and inter-element isolation of more than 18.2 dB [Reference Ouahabi, Dkiouak, Doae El Hadri and Charif7]. MIMO antenna covering the 5G N79 band utilizing DGS to achieve a mutual coupling of less than −18 dB and ECC of less than 0.24 is reported in [Reference Cheng and Zhengwei8]. An antenna composed of an M-shaped radiating element and DGS with operating frequency bands of 1.68–3.1 and 3.35–4.5 GHz is reported to exhibit an isolation greater than 22.5 dB and ECC lower than 0.016 [Reference Salamin, Zugari, Alibakhshikenari, See, Abd-Alhameed and Limiti9]. Another 4-port antenna employing diamond-shaped slots and a defective ground for the 5G-n79 band achieved a mutual coupling of less than −20 dB. ECC less than 0.01 and diversity gain (DG) of 10 dB are reported for this antenna [Reference Sharma and Kumar10]. MIMO antenna covering the band of 4.37–5.5 GHz with ECC less than 0.068 is reported in [Reference Cheng and Zhengwei11]. U-shaped DGS and T-shaped isolating element are employed in a MIMO antenna with inverted L-radiators to cover 5.15–5.925 GHz band [Reference Moses and Moses12]. More than 16.8 dB isolation and ECC value of 0.025 are reported for this antenna. Another inverted L-shaped antenna with DGS is proposed for the resonating 4.7–5.1 GHz range with 25 dB isolation and less than 0.01 ECC. SAR value not exceeding 0.96 W/Kg is reported for this antenna [Reference Ali, Ren, Bari, Bashir, Hashmi, Abbas Khan, Majid, Jan, Tareen and Anjum13].
A wideband MIMO antenna covering the frequency range of 3.1–5.2 GHz with isolation greater than 21.8 dB and ECC values less than 0.003 is reported in [Reference Nagalakshmaiah, Mahesh Kumar and Mukherjee14]. Another wideband antenna formed using open slot structure is reported to provide an isolation of 11.4 dB and ECC smaller than 0.26 for 3.3–6 GHz range [Reference Liu, Liu, Huang and Zhengwei15].
Pentagonal radiating elements with DGS resonating in the 4.4–5 GHz band is reported to provide an ECC of 0.035 [Reference Prithivirajan, Poongodi, R, Kamatchi and Anand16]. A wideband MIMO antenna employing H and I slots with operating band of 3.4–5.4 GHz is reported with isolation exceeding 14 dB and 0.01 ECC. DG is close to 10 dB [Reference Tamminaina and Manikonda17]. Antenna element with T-strips is designed to cover the two 5G bands, LTE 42 and LTE 46 in [Reference Thakur and Jaglan18]. An isolation of 14 dB and ECC less than 0.075 is reported. In [Reference Moses, Moses and Janapala19], a 4-port MIMO antenna system with a T-structure for the 3.4–3.6 GHz band with 17.5 dB isolation and an ECC less than 0.009 is reported. SAR of less than 1.23 W/Kg is obtained. A multiport antenna consisting of a combination of circular and triangular patches is reported in [Reference Srinubabu, Sinh, Addepalli, Louangvilay and Rajasekhar20] for 5G applications and shown to have an improved isolation of better than 20 dB by incorporating a T-shaped DGS. Multiport antenna with orthogonally positioned C-shaped elements with optimized spacing is reported in [Reference Srinubabu and Rajasekhar21] with radiation efficiency ranging from 74 to 86%. A compact MIMO antenna system with elements arranged along a circular surface interleaved with parasitic isolating structures is reported to provide an impedance bandwidth of 3.5–5.45 GHz, and isolation exceeding 17 dB [Reference Jiaping, Lefei, Qiangjuan and Liu22]. Koch fractal-based MIMO antenna with an impedance bandwidth of 1.23 GHz and radiation efficiency of 94% is proposed in [Reference Kumar, Dewan, Jain, Rawat, Zakaria and Al-Gburi23], for the operating band of 4.46–5.69 GHz. An antenna system with a central full circular patch surrounded by truncated circular patches resembling a flower structure, which provides an isolation of more than 20 dB, is reported in [Reference Yuteng, Aiting, Fang, Zhang and Zhang24].
Characteristic mode analysis
CMA provides insights into the radiation characteristics of an antenna in terms of the contributing modes. Coalescence of various modes results in unique surface current distribution patterns in an antenna, and CMA clearly indicates the relative significance of each of these modes at the desired frequency. CMA is utilized to identify the modes with less radiation toward the human body model in [Reference Zhang, Liu, Cheng, Liu, Shi and Kun25] to minimize the SAR. While satisfying the other performance requirements, the authors ensured selective excitation of these low SAR-yielding modes. A four-element antenna module covering 4.25–5.13 GHz band is structured, and feed points are fixed based on the findings from CMA in [Reference Tian and Zhengwei26]. Impact of decoupling passive components on the isolation performance of multiport antenna is analyzed using CMA in [Reference Qu, Kim, Jung and Liu27]. An antenna composed of half-wave and full-wave loops with enhanced isolation is developed using coupling components based on mode manipulation. CMA is employed to position the slots in order to lower the resonant frequency and manipulate inter-modal interaction in a multiport antenna in [Reference Mrini and Amar Touhami28]. The dimensions and positions of the slots are iteratively optimized by observing the surface current patterns, which aids in achieving an efficiency of 84.45%. CMA analysis is utilized to optimize the design of the radiating element in [Reference John, Vincent, Pathan, Shinde and Tanweer Ali29]. The surface current pattern is observed, and the shape of the antenna is iteratively modified based on the regions of high current concentration. This aids in reducing cross-polarization and improving radiation efficiency.
Highlights
This paper presents multi-slot MIMO antenna suitable for 5G mobile phone, which utilizes DGS for return loss improvement and bandwidth tuning. Even after optimizing every dimensional parameter in the single element, the performance of the MIMO antenna may not meet the needs if the elements are not positioned in the best possible way minimizing the mutual interactions. DGS helps in improving the isolation to some extent, and methods like additional parasitic decoupling elements, suppression of selective modes by feed-point optimization are used to achieve isolation values closer and beyond 20 dB. Without complex analysis, involved feeding mechanism, or additional elements, isolation of 30 dB is achieved in this design by exploiting the axial asymmetry of the elements to achieve overall impedance matching. The MIMO configurations with different orientations of the individual elements are explored by flipping them along the axis. Changes in the relative orientations of elements significantly alter the return loss characteristics, and the configuration that resulted in best overall return loss performance across all the ports is chosen for the MIMO antenna system. This analysis is vital in the 4-port antenna design, which ensures the required performance and efficiency.
The following are the key contributions of the proposed work:
• A novel MIMO antenna system suitable for 5G smartphones utilizing simple slots in patch plane and defective ground structure is designed.
• MIMO configurations with different orientations of the individual elements are explored for impedance matching, and the one resulted in the best overall return loss performance is chosen. This analysis is vital in the 4-port antenna design which ensures the required performance and efficiency.
• CMA and equivalent circuit analyses are carried out to derive insights into the radiation behavior of the antenna.
• SAR analysis is carried out to ensure the radiation safety of the antenna, and the designed antenna radiates well within the prescribed safe level for the entire band.
• Results obtained through measurements are very well in accordance with the results from simulation and circuit model.
The design of the single radiating element is presented in the following section, and its equivalent circuit analysis is discussed in the Equivalent circuit analysis section. The design of the multi-element antenna and its CMA are presented in the Multi-element antenna design section. The performance analysis of the proposed antenna, in terms of the relevant metrics, is discussed in the Result analysis section, followed by the concluding remarks of the paper.
Multi-slot antenna element design
FR4 substrate with a permittivity value of 4.4 is chosen for the antenna based on its low-loss characteristics in the desired frequency band and economic viability. Permittivity tolerance of 0.05 is ensured for the substrate board at 5 GHz. The multi-port antenna design started with the single-element design and optimization. Trace widths and spacing in the design are chosen to be larger than 1 mm to minimize the performance variations due to fabrication tolerances of the circuit printing process. Figure 1(a) shows the different stages in the evolution of the structure, and the return loss performance at different stages is shown in Fig. 1(b). A single antenna element based on an A-structure formed by a rectangular and L-shaped slot is designed for the band of 4–6 GHz with full ground plane. The initial rectangular patch is dimensioned to resonate within the 4–6 GHz band. The rectangular and L slots are introduced in the patch plane with the objective of widening the impedance bandwidth. Though the antenna resonated within the band, the impedance bandwidth achieved is still narrow and insufficient to cover the entire band. In order to bring down the reflection coefficient curve and widen the impedance bandwidth, defects are introduced in the ground plane. With the introduction of inverted J-shape defect, the return loss is significantly improved. The defect structure is modified to include a C-shaped slot to further widen the impedance bandwidth. Initial dimensions of the slots and defects are based on quarter and half guided wavelength within the band of interest. Nonetheless, parametric analysis is used to tune the dimensions of these slots for minimum return loss.
Design evolution. (a) Proposed single element. (b) Impact of the DGS on return loss.

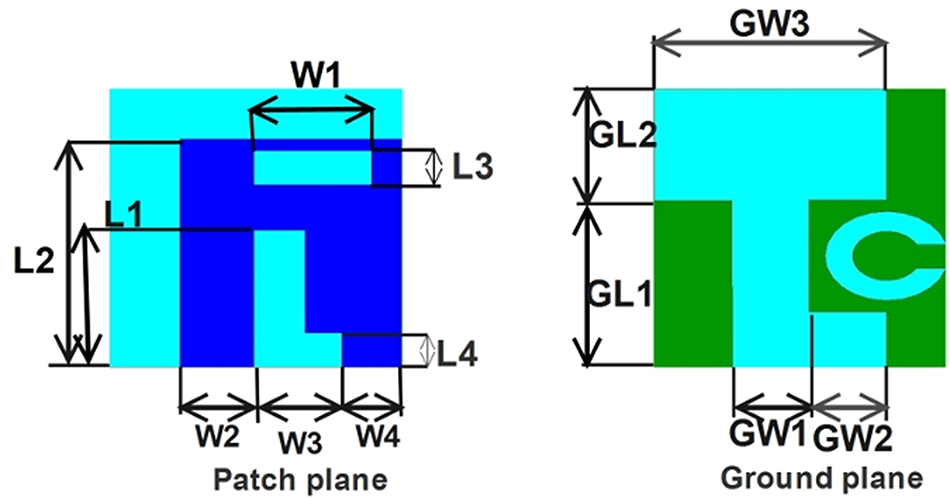
Figure 2 shows the patch and ground plane structures of the proposed single radiating element. At every stage, the dimensions are optimized through parametric analysis. Table 1 lists the values of all the design parameters optimized for the operating band of 4–6 GHz.
Patch and ground planes of parameterized antenna element.

Optimized parameter values

Equivalent circuit analysis
Equivalent circuit analysis provides insight into the function of the antenna and contribution of its components in achieving the required response characteristics. Figure 3(a) shows the equivalent circuit and its reflection coefficient response throughout the specified frequency band. Parallel LC sections capture the resonance behavior exhibited by the microstrip sections and slots. The parallel line segments separated by a gap in the main patch shape introduce additional capacitors. Thin line segments and changing line widths are modeled by inductors. Resistors represent the radiation, ohmic, and dielectric losses. Initial values of these components are computed using the fundamental equations pertaining to the bends, discontinuities, and patches [Reference Polat, Geyikoglu and Cavusoglu30]. However, the values are fine-tuned to match the response provided by the unique antenna structure under consideration.
Equivalent circuit. (a) Model of the radiating element. (b) Reflection coefficient characteristics.

It can be seen from Fig. 3(b) that the return loss obtained from the electromagnetic simulator and the equivalent circuit model are closely matching. Change in radiation behavior evolving at the different stages can be modeled by the inclusion of different impedance elements. Because of the complex interactive nature of the fields and wave behavior, tuning of the resistance and reactance values is essential at each stage. Various impedances constituting the model are given by Eqns. (1)–(6) and their interconnections are shown in Fig. 4.
 \begin{equation}{{\text{Z}}_{\text{1}}} = \frac{{{R_1}}}{{1 + j{R_1}\left( {\omega {c_1} - \frac{1}{{\omega L1}}} \right)}}\end{equation}
 \begin{equation}{{\text{Z}}_{\text{2}}} = j\left( {\omega {L_2} - \frac{1}{{\omega {C_2}}}} \right)\end{equation}
 \begin{equation}{{\text{Z}}_{\text{3}}} = \frac{{{R_3}}}{{1 + j{R_3}\left( {\omega {C_3} - \frac{1}{{\omega {L_3}}}} \right)}}\end{equation}
 \begin{equation}{{\text{Z}}_{\text{4}}} = \frac{{{R_4}}}{{1 + j{R_4}\left( {\omega {C_{4P}} - \frac{1}{{\omega {L_4}}}} \right)}} - \,\frac{j}{{\omega {C_{4s}}}}\end{equation}
 \begin{equation}{{\text{Z}}_{\text{5}}}{\text{ = }}\frac{{{R_5}}}{{1 + j{R_5}\left( {\omega {C_5} - \frac{1}{{\omega {L_5}}}} \right)}}\end{equation}
 \begin{equation}{Z_6} = \left( {j\frac{{\omega {L_6}}}{{1 - {\omega ^2}{L_{6P}}{C_{6P}}}}} \right)\left\| {\left( {j\left( {\omega {L_{6S}} - \frac{1}{{\omega {C_{6S}}}}} \right)} \right)} \right.\end{equation}
Stage-wise equivalent circuit and impedance plot of (a) stage 2, (b) stage 3, and (c) stage 4. (d) Reflection coefficient characteristics.

Figure 4(a) shows the equivalent impedance model and plot for the patch design with full-ground plane, which is referred as stage 2 in the evolution (refer Fig. 1). Z1, Z2, and Z3 represent the resonant behavior of this design. Z3 models the dominant radiating mode, whereas Z2 depicts the higher radiating modes and feed reactance. The parallel RLC circuit of Z1 is the dominating impedance within the operating frequency range and depicts the degenerative effect of multiple modes. This effect limits the return loss performance of the radiating element. The interplay between these impedances results in the reflection coefficient curve shown in Fig. 4(d). Z4 and Z5 are introduced in the equivalent impedance behavior due to the stage 3 DGS, as the defects in the ground plane modify the surface current distribution. Resonance at 4.3 and 5.4 GHz is observed in the corresponding impedance plot in Fig. 4(b). The resulting bandwidth-widening effect in the reflection coefficient response is observed in Fig. 4(d). C-shaped defect in the ground results in an equivalent Z6 to be introduced in stage 4, which makes the circuit to resonate at the center-frequency of the band. This can be inferred from Fig. 4(c), and the improved reflection coefficient curve is shown in Fig. 4(d).
Multi-element antenna design
The MIMO antenna system is developed using the optimized elements placed in appropriate positions and relative orientations. The substrate dimension is set to 150 × 75 × 1.6 mm3 based on the typical dimensions of a smartphone [Reference Jemaludin, Al-Gburi, Elabd, Saeidi, Akbar, Ibrahim and Zakaria2, Reference Moses and Moses12, Reference Thakur and Jaglan18]. Figure 5 shows the antenna dimensions and relative positioning of the antenna elements in the MIMO system.
MIMO antenna positioning and dimensions.

Exploiting structure asymmetry
In order to achieve the wide bandwidth of 40% with a compact-sized element, substrate height of 1.6 mm is chosen over 0.8 mm. The normalized height slightly exceeds the maximum threshold criterion for negligible surface waves particularly at the higher frequencies. Due to the onset of surface waves, interactions between elements will be increased leading to impedance mismatch effects, which will reduce the radiation efficiency [Reference Girish Kumar31]. To counteract this effect, the relative orientation of the radiating elements is chosen carefully after analyzing the extent of cross-coupling between them. Further, this provides an opportunity to exploit the asymmetry in the element’s structure to alter the extent of inter-element interaction and to achieve impedance matching.
In [Reference Iqbal, Abdulrazak, Celik, Ali and Kiani32], the authors explored the parallel positioning with and without flipping, and diagonal relative positioning of the two dielectric resonator radiating elements in order to meet the required circular polarization (CP)-bandwidth and isolation. Though the antenna differs from the presented work in terms of technique, type, and application, it is discussed here because of the similarity in the approach used. For this Dielectric Resonator Antenna (DRA), the flipping resulted in no significant performance difference, but the diagonal positioning resulted in appreciable improvement in impedance matching, CP-bandwidth and isolation performance. In this work, the antenna system consists of four radiating elements, where the relative parallel positioning of elements 1, 2 (3, 4), and diagonal positioning of 1,3 are inevitable. Also, the horizontal distance between the back-to-back elements is constrained by the smartphone board dimensions. In this work, different configurations are achieved by flipping the radiating plane elements along their long side.
Different MIMO designs are obtained by flipping the antenna elements in the patch plane. With one of the elements excited, the surface current distribution in all the elements is observed. The loading effect of the adjacent elements affects the impedance characteristics and in turn the return loss performance. The current distributions and return loss characteristics are shown for three sample cases in Fig. 6. Maximum reflection coefficient constraint of −10 dB is violated for one or more ports within the desired frequency range for all the cases except for the orientation shown in Fig. 6(c). From the figure, it can be noted that for Fig. 6(a) and (b) impedance mismatch exists for three and two ports, respectively. Let the arrangements with impedance mismatch at four, three, and two ports be referred as Cases a–c, respectively. Case d refers to the orientation arrangement shown in Fig. 6(c), which exhibits very good impedance matching at all four ports. In this case, the return loss lies below −10 dB throughout the band. This configuration exhibited least level of inter-element interaction among all the cases as well and hence chosen for the proposed antenna.
Surface current and return loss characteristics for different orientations.

Figure 6 Long description
Only one element is excited in all of these cases, and the orientation-dependent variations in coupled surface currents in the non-excited elements are visible from the figure. For each orientation case, the element-wise return loss characteristics are shown on the side, which reveals the differences in their impedance bandwidths.
Maximum return loss and mutual coupling values for the four cases are analyzed over the entire operating frequency band. The return loss is worst for Case a followed by Cases b and c. Case d exhibits better than 10 dB return loss throughout the band. All four cases exhibit acceptable mutual coupling values although Case d outperforms other cases and also provides more uniform value across the different ports.
Table 2 lists the relative return loss, mutual coupling, and impedance bandwidth performance obtained for the different positioning/orientation arrangements. The values are normalized with that of the best-performing Case d of the corresponding designs. The maximum reflection coefficient in dB is 2–10 times higher in Cases a–c in DRA. With reference to Case d of the proposed work, other three orientations resulted in nearly 2.3 times higher reflection coefficient value. The impedance bandwidth is improved by almost 50% in Case d compared with the other cases whereas the improvement in isolation is more than 1.5 times. Nonetheless, a significant difference in bandwidth and isolation is observed in the case of DRA [Reference Iqbal, Abdulrazak, Celik, Ali and Kiani32]. This is understandable, as the Case d of DRA is diagonal positioning against the parallel position and back-to-back series position cases, whereas the different cases in this work are differing only by left or right flip of the elements. The comparison is included to show the extent of improvement achievable by the method of relative orientation adjustment in these two different types of antenna systems.
Relative performance of different positioning schemes

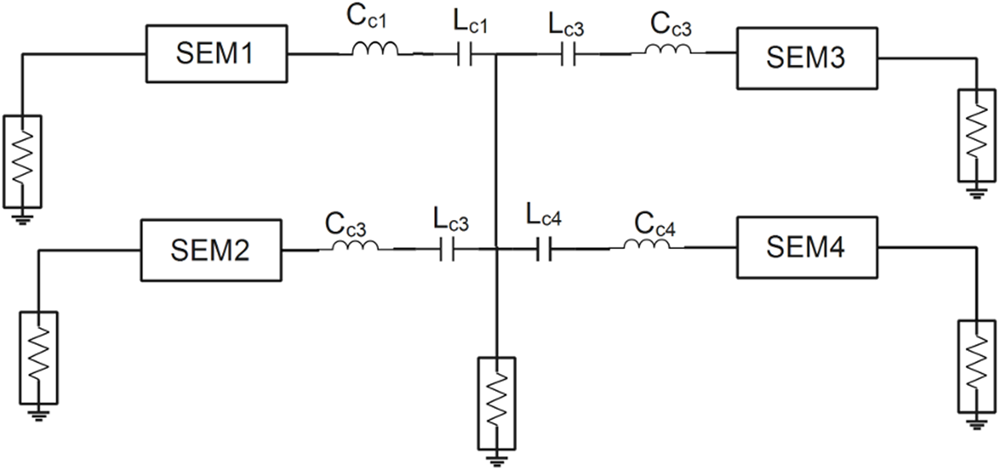
To get insight into the behavior of the different configurations, the single-element equivalent circuit is extended to represent the MIMO antenna system. Four single-element model (SEM) circuits with separate input terminals are combined at the common output terminal as shown in Fig. 7. A series LC section is included at the output ports of the single elements to represent the interaction between elements. The RLC parameter values are tuned from their nominal values to match the corresponding EM-simulated reflection coefficient responses. The responses are basically two types, one being the broadband (BB) with minimum and maximum reflection coefficient limits of −25 and −10 dB, respectively. The other type is narrow-band (NB) response with reflection coefficient values exceeding −30 dB at the center frequency but exceeding the −10 dB reference level at lower and higher ends of the band. However, there are minor variations between the particular instances of these responses. It has been observed that the corresponding parameter values differed by less than 5% between the four circuit sections in the case of similar reflection coefficient responses. Whereas, the parameters R1, R3, and R5 of the NB response differed significantly from that of the BB responses. Significant variation in resistances is accompanied by negligible alteration of capacitive or inductive parameters of the corresponding tuned circuits in the SEMs. Then, the constitutional relation [Reference Richards, Lo and Lee33] between Rmn and Cmn of a TMmn mode is given by eq. (7) indicates that the orientation changes alter the quality factor of selective modes.
 \begin{equation}{R_{mn}} = \frac{Q}{{{C_{mn}}\omega }}\end{equation}
Equivalent circuit model of the MIMO antenna.

Reflection coefficient curves and the corresponding Smith chart obtained from equivalent circuit model for a sample configuration are shown in Fig. 8(a) and (b), respectively. The R1 and R5 of the NB response cases are larger by 2–9 times compared to that of the BB curves. R3 value of BB response is nearly twice as that of NB response. Since these resistor parameters represent the power radiated in the space as well as surface waves in different modes, it can be inferred that the orientation flipping significantly alters the radiation behavior. This may be attributed to mode-specific changes in impedance matching behavior of the antenna elements caused by the orientation changes. Smith chart reveals smaller radius and BB impedance matching for ports 3 and 4, which corresponds to the BB type curves. Whereas, in the case of ports 1 and 2, matching is achieved only for a very narrow band around center frequency resulting in a much wider curve radius.
Sample of model-based. (a) Reflection coefficient curves. (b) Smith chart.

Figure 8 Long description
Panel A presents a line plot with the y-axis labeled Reflection Coefficient (dB) and the x-axis labeled Frequency (GHz). The x-axis runs from 4.0 to 6.0 with tick labels at 4.0, 4.2, 4.4, 4.6, 4.8, 5.0, 5.2, 5.4, 5.6, 5.8 and 6.0. The y-axis runs from 0 to minus 40 with tick labels at 0, minus 5, minus 10, minus 15, minus 20, minus 25, minus 30, minus 35 and minus 40. A legend lists four traces: S11, S22, S33 and S44. S11 starts near about minus 5 decibel at 4.0 gigahertz, decreases to around minus 15 decibel near about 4.7 to 4.8 gigahertz, rises toward about minus 10 decibel near about 5.0 gigahertz, then trends upward to around minus 8 to minus 10 decibel by 6.0 gigahertz. S22 starts near about minus 5 decibel at 4.0 gigahertz, decreases to around minus 12 to minus 15 decibel near about 4.6 to 4.8 gigahertz, shows a narrow deep notch at about 5.0 gigahertz reaching roughly minus 30 decibel, then rises to around minus 10 decibel by about 5.6 to 6.0 gigahertz. S33 starts near about minus 5 decibel at 4.0 gigahertz, decreases to around minus 10 to minus 15 decibel near about 4.7 to 4.9 gigahertz, shows a narrow deep notch at about 5.0 gigahertz reaching roughly minus 35 decibel, then rises to around minus 10 decibel by about 5.6 to 6.0 gigahertz. S44 starts near about minus 5 decibel at 4.0 gigahertz, dips to around minus 20 decibel near about 4.4 to 4.6 gigahertz, rises toward around minus 12 to minus 15 decibel near about 4.8 to 5.0 gigahertz, dips again to around minus 20 decibel near about 5.2 to 5.4 gigahertz, then rises to around minus 12 to minus 15 decibel by 6.0 gigahertz. Panel B presents a Smith chart with a circular grid and four colored loci corresponding to the same legend entries S11, S22, S33 and S44. The loci form multiple loops clustered around the central region of the chart, with several turns and crossings among the traces. No axis labels or numeric tick labels are shown on the Smith chart.
Characteristic mode analysis
CMA is a useful analytical tool to gain insight into the radiation behavior of a microstrip antenna. Modal significance (MS) represents the normalized magnitude of the mode currents and hence depends only on the dimensions and shape of the antenna structure and does not depend on excitation. The modes with significance value close to unity in the operating frequency band are significant, and for bandwidth calculations, MS of 0.707 is considered the reference level.
CMA analysis is conducted for patch plane and ground plane structures of the MIMO antenna separately. Figure 9(a) and (b) shows the MS and characteristic angle plots corresponding to the patch plane design. Narrowband resonance centered around 4.15 GHz with a bandwidth of 300 MHz is observed for the four most significant modes.
Mode analysis of patch plane. (a) Modal significance. (b) Characteristic angle curves.

Figure 10(a) shows the MS curves of the proposed DGS structure. From this figure, it can be observed that the first four contributing modes are all having MS value close to unity in the desired frequency range. The characteristic angle curves of modes 1–3 are resonating in the vicinity of 4 GHz, and mode 4 resonates at 3.1 GHz. All the curves corresponding to the contributing modes are gracing 180° after resonance for the entire operating range, which confirms the BB behavior introduced by the DGS. However, in the real antenna, factors such as the presence of substrate and feed-point matching characteristics greatly influence the impedance bandwidth.
Mode analysis of DGS plane. (a) Modal significance. (b) Characteristic angle curves.

Result analysis
The proposed 4-port MIMO antenna system is designed, analyzed using simulation, fabricated, and tested. Figure 11 shows the front and back view photographs of the fabricated antenna. The parameters measured are reflection coefficient, mutual coupling, and radiation pattern. ECC and DG are computed from the S-parameters obtained from simulation as well as measurements.
Front-plane view and back-plane view of the fabricated antenna prototype.

Figure 12 shows the antenna connected to the vector network analyzer for measuring mutual coupling. All the S-parameters are measured using this setup with appropriate port termination.
S-parameter measurement setup.

Reflection coefficient
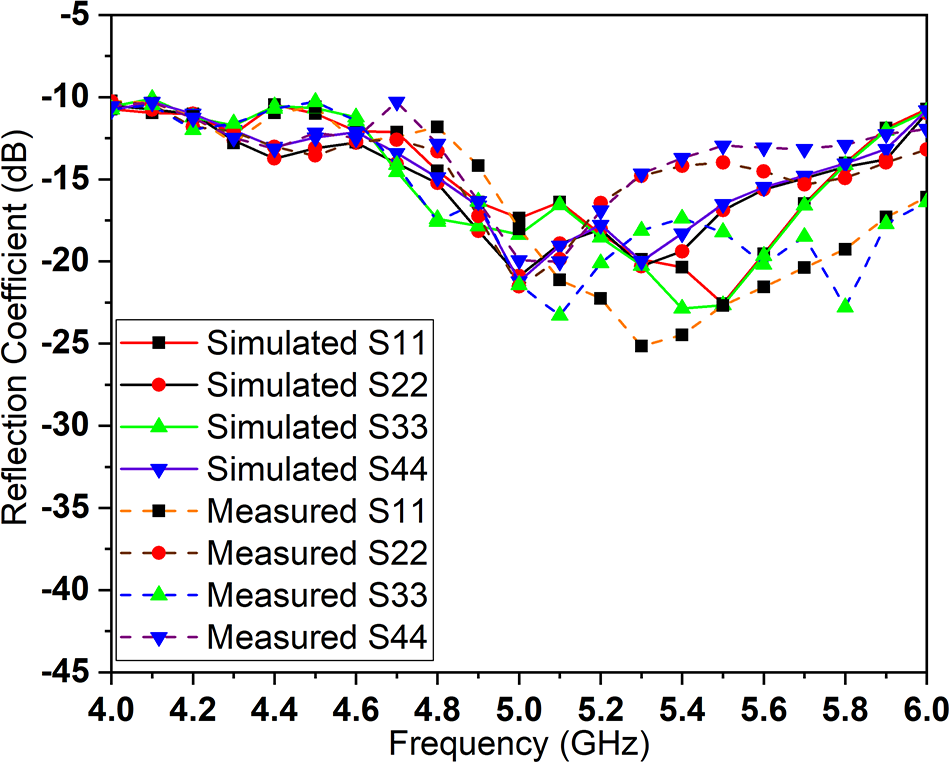
Figure 13(a) shows the average reflection coefficient of the four antenna elements for the four sample cases depicted in Fig. 5, whereas Fig. 13(b) highlights the worst performance condition in each case. The worst-case return loss of the chosen Case d is more than double that of other configurations. Figure 14 shows the reflection coefficient of the designed 4-port antenna. Reflection coefficient values obtained are well below the required −10 dB requirement, and the minimum value is less than −25 dB confirming the merit of the antenna. It can be further observed that the measured S11 parameter values closely follow the simulation results.
Case-wise reflection coefficient. (a) Average response. (b) Minimum return loss.

Comparison of measured and simulated reflection coefficient responses.

Figure 14 Long description
The multi-line graph compares simulated and measured reflection coefficients for S11, S22, S33 and S44. The x-axis represents frequency in gigahertz, ranging from 4.0 to 6.0 gigahertz. The y-axis represents reflection coefficient in decibels, ranging from negative 45 to negative 5 decibels. The graph includes eight lines: simulated S11, S22, S33 and S44 and measured S11, S22, S33 and S44. Each line is distinguished by different colors and markers. Simulated S11 shows a dip around 5.0 gigahertz, while measured S11 closely follows this trend. Simulated S22 and measured S22 show similar dips and peaks, with notable alignment around 5.5 gigahertz. Simulated S33 and measured S33 exhibit fluctuations, with measured S33 showing a deeper dip near 5.2 gigahertz. Simulated S44 and measured S44 also display similar trends, with measured S44 showing a peak around 4.8 gigahertz. The graph demonstrates the agreement between simulated and measured results across the frequency band, highlighting key minima and maxima points for each dataset.
Mutual coupling
Figure 15(a) and (b) shows the average mutual coupling and worst-case values of the different configurations considered. Overall mutual coupling performance of Case d is far better than others. The worst-case value of mutual coupling is reduced by 60–70% in Case d compared to other configurations. Mutual coupling between every pair of antenna elements obtained through simulation as well as measurement is plotted in Fig. 16. Measured mutual coupling varies from −30 to −55 dB in the entire band implying significant isolation between elements.
Case-wise mutual coupling performance. (a) Average response. (b) Minimum isolation.

Comparison of measured and simulated mutual coupling performance.

Figure 16 Long description
The plot contains multiple line series with point markers and a legend. The x-axis label is Frequency (gigahertz). The x-axis ranges from 4.0 to 6.0 with tick marks at 4.0, 4.2, 4.4, 4.6, 4.8, 5.0, 5.2, 5.4, 5.6, 5.8 and 6.0. The y-axis label is Mutual Coupling (decibel). The y-axis ranges from minus 80 to minus 30 with tick marks at minus 80, minus 75, minus 70, minus 65, minus 60, minus 55, minus 50, minus 45, minus 40, minus 35 and minus 30. Legend entries list eight series: Simulated S12, S21, S43, S34; Simulated S31, S13; Simulated S42, S24; Simulated S32, S23; Measured S12, S21, S43, S34; Measured S31, S13; Measured S42, S24; Measured S32, S23. Across the frequency range, most series lie between about minus 55 decibel and minus 30 decibel. One series with square markers drops well below the others, reaching roughly the minus 70 decibel region around the mid to upper part of the frequency range, then rises toward about the minus 60 decibel region near 6.0 gigahertz. Several other series show a shallow dip around roughly 4.8 to 5.2 gigahertz and then increase toward 6.0 gigahertz, approaching the minus 35 decibel to minus 30 decibel region at the high end.
Radiation pattern
The anechoic chamber with the radiation measurement setup used in the study is shown in Fig. 17. Radiation Pattern measurement is done by exciting one radiating element at a time while terminating the other ports with matched load. The measured and simulated results at 5 GHz corresponding to the co-polarization radiation pattern are shown in Fig. 18.
Setup used for radiation pattern measurement.

Radiation pattern of (a) Ant 1, (b) Ant 2, (c) Ant 3, and (d) Ant 4.

Figure 18 Long description
Radiation pattern of (a) Ant 1 (b) Ant 2 (c) Ant 3 (d) Ant 4. Each polar plot displays simulated and measured gain patterns for theta and phi components. The radial axis is in decibel, with markings at 0, minus 10, minus 20 and minus 30. The angular scale ranges from 0 to 360 degrees in 30-degree increments. The legend includes Simulated Gain Theta, Simulated Gain Phi, Measured Gain Theta and Measured Gain Phi. In each plot, the lines form multi-lobed patterns. Key observations include: Ant 1 shows a peak gain near 90 degrees with a deep null around 180 degrees. Ant 2 has a broader lobe pattern with less pronounced nulls. Ant 3 displays a similar pattern to Ant 1 but with a slight shift in peak direction. Ant 4 shows the most deviation between simulated and measured results, particularly in the phi component. These plots illustrate the performance and discrepancies in gain patterns for different antennas, providing insights into their directional characteristics and measurement accuracy.
Spiking and extension beyond the horizon are observed due to the presence of dielectric substrate, and curving of the lower side of the pattern occurs due to the finite ground plane. The radiation is found to be broadside, and the plot confirms suitability of the antenna for mobile phone applications. The cross-polarized patterns exhibited radiation gain values lower than the given patterns by 12–23 dB.
Radiation efficiency
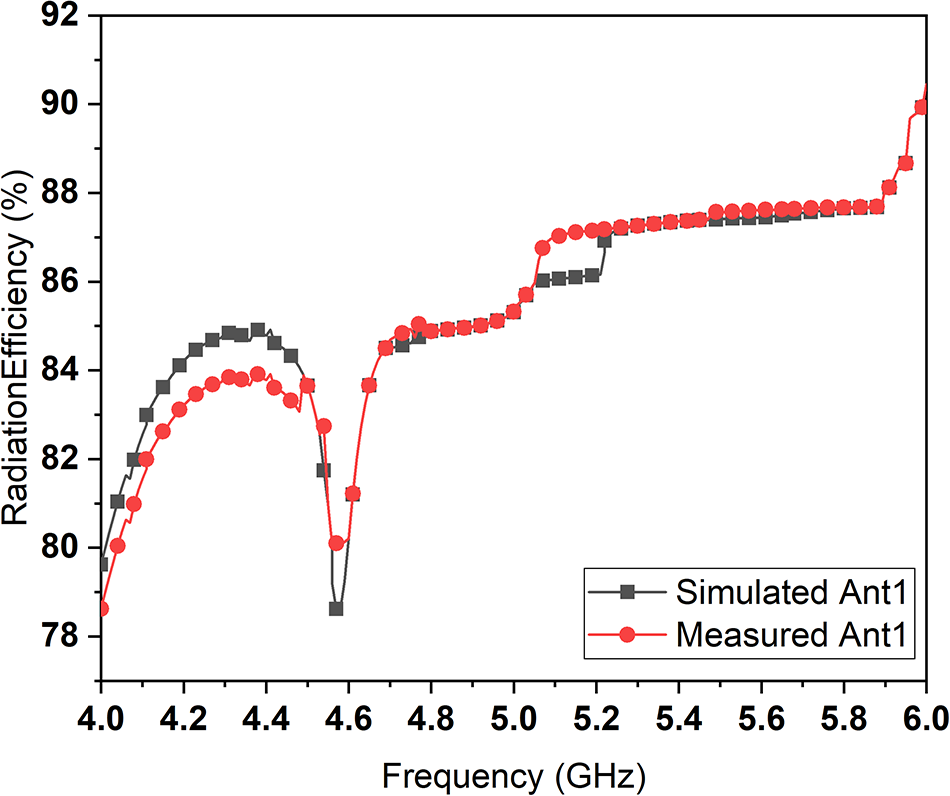
High radiation efficiency manifests as longer battery life in handheld devices and lower SAR as the radiation efficiency indicates the extent to which the source power is converted to radiative power. Overall radiation efficiency at different frequencies is plotted for the four configurations in Fig. 19(a), and the worst-case values are shown in Fig. 19(b). Though the average radiation efficiency stays above 80% in most portion of the operating band, it falls to less than 70% at certain frequencies in all cases except Case d. Minimum efficiency is 17–21% better in Case d compared to other cases. Radiation efficiency of the fabricated antenna system is presented in Fig. 20. It varied in the range of 79–90% over the entire band. It can be observed that the simulation- and measurement-based values are closely matching.
Case-wise radiation efficiency. (a) Average response. (b) Maximum radiation efficiency.

Comparison of measured and simulated radiation efficiency.

Peak gain
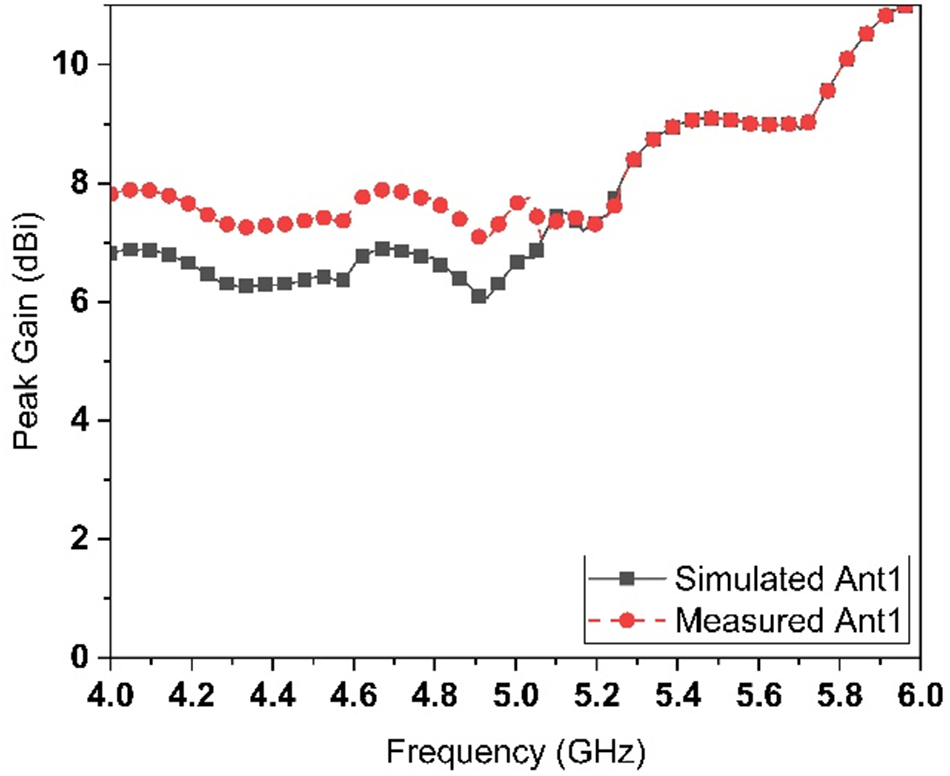
Typical peak gain values for mobile phone MIMO antenna varies from 4 to 10 dBi. Peak gain values greater than 8 dBi are considered as high gain in mobile phone applications. High peak gain ensures a stable signal-to-noise ratio even at cell edges, which is essential to maintain the high data rates. Figure 21(a) shows that the average peak gain levels are almost the same in all the cases. However, the worst-case efficiency is higher by 20–34% in Case d, as observed in Fig. 21(b). Figure 22 shows the measured and simulated peak gain of the antenna over the operating frequency range. Measured gain ranges between 7.8 and 11.0 dBi, and simulated peak gain of the antenna varied from 6.8 to 11.0 dBi. The increasing gain with increase in frequency can be attributed to the higher effective apertures with increase in frequency.
Case-wise peak gain. (a) Average response. (b) Maximum peak gain.

Comparison of measured and simulated peak gain.

MIMO performance metrics
The most vital parameters for evaluating the performance of a MIMO antenna are ECC and DG.
Envelope correlation coefficient
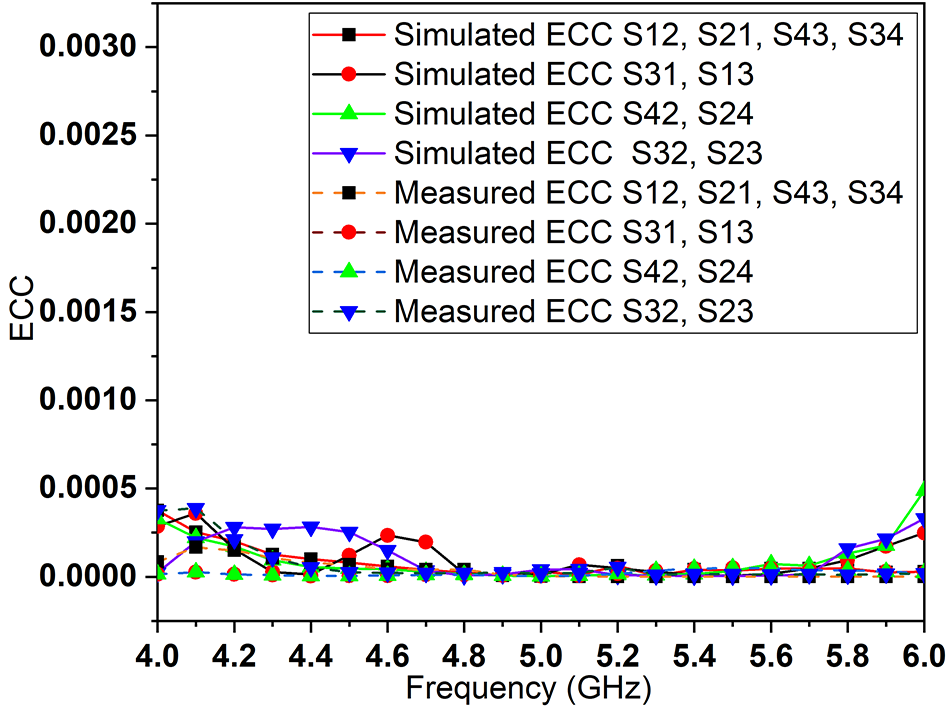
ECC captures the extent of correlation between two adjacently placed elements and can be computed from the S-parameters. Lower ECC indicates minimum coupling or dependency between the radiation patterns of the elements, which manifests as robustness against multi-path fading and increased data rate capacity. ECC range of <0.5 is required, and values less than 0.01 are considered to be good for mobile communication [Reference Malviya, Kumar and Kartikeyan34, Reference Sibille, Oestges and Zanella35]. However lower values of ECC are preferred as it signifies higher port-isolation between the elements. It can be observed that the average ECC is below 0.006 for all configurations from Fig. 23(a). However, the worst-case ECC values are much less than the average values, as shown in Fig. 23(b). Case d exhibits the worst-case ECC less by one or two orders of magnitude compared to other cases. From Fig. 24, it can be seen that for the designed antenna, the ECC is well below 0.0005 for the entire band under consideration.
Case-wise ECC. (a) Average response. (b) Minimum ECC.

Comparison of measured and simulated ECC performance.

Figure 24 Long description
The y-axis is labeled ECC, ranging from 0.0000 to 0.0030 with tick marks at 0.0005 intervals. The x-axis is labeled Frequency (GHz), ranging from 4.0 to 6.0 with tick marks at 0.2 intervals. A legend lists eight series: Simulated ECC S12, S21, S43, S34; Simulated ECC S31, S13; Simulated ECC S42, S24; Simulated ECC S32, S23; Measured ECC S12, S21, S43, S34; Measured ECC S31, S13; Measured ECC S42, S24; Measured ECC S32, S23. Across 4.0 to 6.0, all series are plotted with point markers connected by lines and remain close to 0.0000 for most of the range. Around 4.0 to about 4.6, several series show small values below 0.0005, with points clustered near the baseline. From about 4.6 through about 5.8, the plotted points for all series lie very near 0.0000. Near 6.0, multiple series rise upward, with the highest points still below 0.0010.
Diversity gain
DG measures the spatial diversity-induced improvement in signal-to-noise ratio provided by the MIMO antenna [Reference Malviya, Kumar and Kartikeyan34, Reference Sibille, Oestges and Zanella35]. This quantifies the signal quality enhancement achievable by combining the signals from different elements.
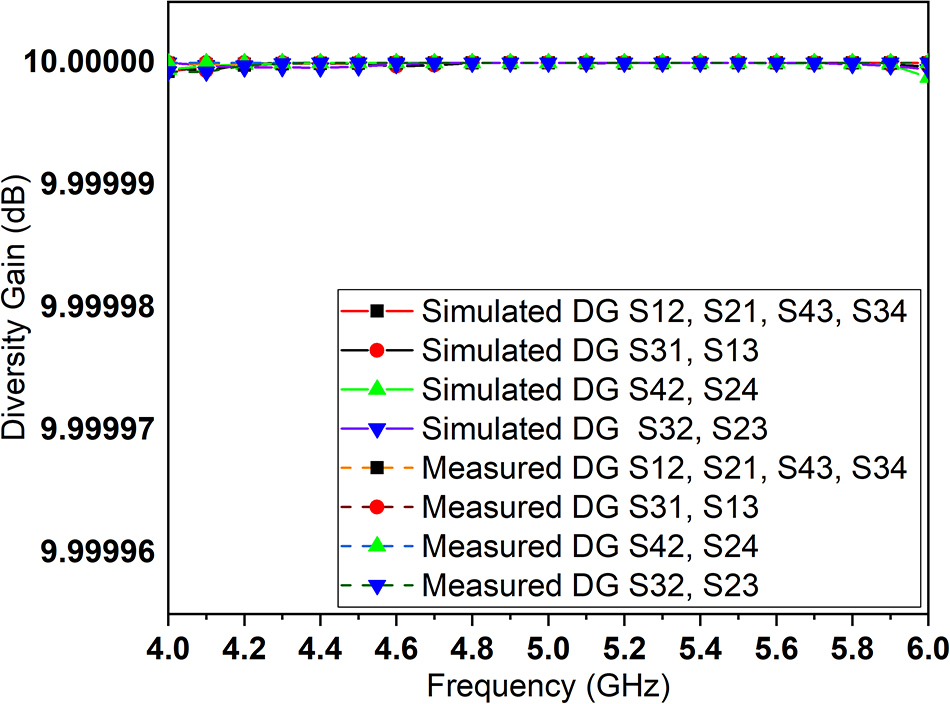
DG values are more than 9.9999 for all the cases irrespective of the element orientations. Figure 25 shows that the DG of the designed antenna approaches the ideal 10 dB value for almost the entire band, which confirms excellent diversity performance.
Diversity gain performance.

SAR analysis
SAR quantifies the radiated power absorbed by the human tissue and is an important factor to consider while designing mobile phone antennas. SAR computation is carried out adhering to the IEEE/IEC 62704-4 standard with 1 g averaging mass. SAR is observed for the human head model using the electromagnetic simulation tool for the case of all the antenna elements are excited and radiating, with the total input power set at 23 dBm. Simulation is conducted with the mobile phone antenna board positioned as shown in Fig. 26 at a distance of 3 mm from the face surface. It should be noted that the other structural components of the mobile phone, such as battery, display, and frame, are not included in the analysis. It can be observed from the figure that the worst-case SAR is 0.93, which is well within the prescribed safety limits.
SAR analysis.

Comparison of the proposed work in terms of key parameters with the other closely related works in the literature is presented in Table 3. All the designs compared are fabricated with the same substrate, with the same number of ports and meant for 5G sub-6 GHz applications. Performance of the proposed antenna is on par with or exceeds the designs with the highest performance in terms of all the metrics. It is worth noting that an improvement of more than 71% and more than 78% in isolation is achieved by the proposed antenna system when compared with the works reported in [Reference Thakur and Jaglan18] and [Reference Moses and Moses12], which are also meant for smartphone applications.
Performance comparison of the proposed antenna

Conclusion
A multi-slot quad-port 5G MIMO antenna system exploiting the asymmetry-induced impedance matching of elements is presented. The radiation behavior and the impact of DGS are analyzed using CMA. Relative orientation of the elements is chosen by assessing mutual interaction-induced impedance mismatch through surface current distribution and return loss responses. Isolation exceeding 30 dB and return loss in the range of 10 dB to 40 dB are obtained with 0.0005 ECC and 10 dB DG for the entire band considered. SAR value of 0.93 W/kg is observed, which is well within the prescribed safe radiation levels. The designed antenna is also fabricated, and the S-parameters and radiation pattern measurements are carried out. Results obtained from measurement closely matches with those obtained through electromagnetic simulation and model.
Data availability statement
The data that support the findings of this study are available within the manuscript.
Acknowledgements
The authors record their sincere gratitude to the Centre for Electronics System, Design, Calibration and Testing, Department of Electronics and Communication Engineering, National Institute of Technology, Tiruchirappalli, Tamil Nadu, India, for granting access to their laboratory facilities. The authors are grateful to Dr. Subramanian Venkatachalam, Department of Physics, Indian Institute of Technology Madras, Chennai, India, for granting access to his laboratory facilities.
Author contributions
M.R. and M.T. designed the research. M.R. conducted the research and drafted the paper. M.T. revised and finalized the paper.
Funding statement
No funding is received from any agency for the research reported in this article.
Competing interests
The authors have no competing interests to declare that are relevant to the content of this article.

M. Ranjitha is currently working as an Assistant Professor in the Department of Biomedical Engineering at Kings Engineering College, Irungattukottai, Chennai, India. She received her Bachelor’s and Master’s degrees from Pondicherry University, Puducherry, India, in 2017 and 2019, respectively. Currently, she is pursuing her Ph.D. degree in the Department of Electronics and Communication Engineering, Puducherry Technological University, Puducherry, India. Her research interests include MIMO antennas, 5G mobile terminals, and multiband antennas.

M. Thachayani is currently working as an Associate Professor in the Department of Electronics and Communication Engineering at Puducherry Technological University, Puducherry, India. She received her B.Tech and M.Tech degrees from Pondicherry University, Puducherry, India, in 2000 and 2002, respectively. She received her doctoral degree in the field of optical networks from Pondicherry University, Puducherry, India, in 2015. Her research interests include microwave devices, optical communication, and machine learning.