1. Introduction
Mixed convection, driven by both shear and buoyancy forces, occurs ubiquitously in nature and has widespread applications in industry (Caulfield Reference Caulfield2021). For example, this complex interaction is essential for understanding the behaviour of atmospheric currents, where stratification can be stable (warmer air above cooler layers), unstable (lower layers are heated and rising) or neutral (temperature gradient minimal affecting air movements) (Zhang, Tan & Zheng Reference Zhang, Tan and Zheng2023; Zhang Reference Zhang2024). During the day, unstable stratification can form large longitudinally aligned rollers (Brown Reference Brown1980; Young et al. Reference Young, Kristovich, Hjelmfelt and Foster2002; Dror et al. Reference Dror, Koren, Liu and Altaratz2023). These structures generate rows of cumulus clouds and create striped patterns on sand dunes (Hanna Reference Hanna1969; Andreotti et al. Reference Andreotti, Fourriere, Ould-Kaddour, Murray and Claudin2009; Kok et al. Reference Kok, Parteli, Michaels and Karam2012). At night, the atmospheric boundary layer is usually stably stratified, with temperature increasing with height, inhibiting vertical mixing and resulting in a more layered, less turbulent atmosphere (Nieuwstadt Reference Nieuwstadt1984). Another example is in nuclear engineering, where mixed convection is crucial for designing and operating Generation IV nuclear reactors, such as sodium-cooled and lead-cooled fast reactors. A key component of these reactors is the primary circuit, where heat generated from nuclear fission is transferred to a coolant before being converted to steam for electricity generation (Komen et al. Reference Komen, Mathur, Roelofs, Merzari and Tiselj2023). Paradigms for studying mixed convection include the Poiseuille–Rayleigh–Bénard (PRB) and the Couette–Rayleigh–Bénard (CRB) systems, which combine Poiseuille (or Couette) flow with Rayleigh–Bénard (RB) convective flow. Although extensive efforts have been devoted to studying shear-driven wall turbulence in Poiseuille flow (or Couette flow) systems (Marusic et al. Reference Marusic, McKeon, Monkewitz, Nagib, Smits and Sreenivasan2010; Smits, McKeon & Marusic Reference Smits, McKeon and Marusic2011; Jiménez Reference Jiménez2012; Graham & Floryan Reference Graham and Floryan2021; Marusic et al. Reference Marusic, Chandran, Rouhi, Fu, Wine, Holloway, Chung and Smits2021; Yao, Chen & Hussain Reference Yao, Chen and Hussain2022; Yao et al. Reference Yao, Chen and Hussain2022; Chen & Sreenivasan Reference Chen and Sreenivasan2023), and buoyancy-driven thermal turbulence in RB systems (Ahlers, Grossmann & Lohse Reference Ahlers, Grossmann and Lohse2009; Lohse & Xia Reference Lohse and Xia2010; Chilla, Evrard & Schulz Reference Chilla, Evrard and Schulz2012; Wang, Zhou & Sun Reference Wang, Zhou and Sun2020; Jiang et al. Reference Jiang, Zhu, Wang, Huisman and Sun2020; Xia et al. Reference Xia, Huang, Xie and Zhang2023; Lohse & Shishkina Reference Lohse and Shishkina2024; Lohse Reference Lohse2024), the interplay between horizontal shear and vertical buoyancy in mixed convection remains relatively less understood.
In turbulent channel flows with stable temperature stratification, fluid density increases with depth, and buoyancy forces act to return displaced fluid parcels to their original position, causing oscillations around the equilibrium point and forming internal gravity waves (Zonta, Sichani & Soldati Reference Zonta, Sichani and Soldati2022). In contrast, in turbulent channel flows with unstable temperature stratification, thermal plumes significantly influence momentum and heat transport from the wall (Komori et al. Reference Komori, Ueda, Ogino and Mizushina1982; Iida & Kasagi Reference Iida and Kasagi1997). When heat conduction in the bottom wall is coupled with fluid flow in the channel, the thermal properties and thickness of the conducting solid wall strongly affect the solid–fluid interfacial temperatures (Garai, Kleissl & Sarkar Reference Garai, Kleissl and Sarkar2014). Pirozzoli et al. (Reference Pirozzoli, Bernardini, Verzicco and Orlandi2017) and Blass et al. (Reference Blass, Zhu, Verzicco, Lohse and Stevens2020, Reference Blass, Tabak, Verzicco, Stevens and Lohse2021) found that at high friction Reynolds number (
 $Re_{\tau }$
, describing the shear strength) and high Rayleigh number (
 $Ra$
, describing the buoyancy strength) in both PRB and CRB systems, large-scale quasistreamwise roll structures form, occupying the entire channel height, a behaviour not observed in pure turbulent channel flow or pure turbulent RB convection. Using the direct numerical simulation (DNS) data of Pirozzoli et al. (Reference Pirozzoli, Bernardini, Verzicco and Orlandi2017), Madhusudanan et al. (Reference Madhusudanan, Illingworth, Marusic and Chung2022) developed a linearized Navier–Stokes-based model that accurately captures the trends of these quasistreamwise rolls, emphasizing the significant impact of the relative effect of shear and buoyancy (characterized by the Richardson number
 $Ri_b$
) on the predicted coherent structures. Meanwhile, Cossu (Reference Cossu2022) showed that the linear instability of turbulent mean flow to coherent perturbations is linked to the onset of large-scale rolls and predicted the critical Rayleigh number for their formation. Recently, Howland et al. (Reference Howland, Yerragolam, Verzicco and Lohse2024) studied a differentially heated vertical channel subject to a Poiseuille-like horizontal pressure gradient, which is relevant to industrial heat exchangers in applied thermal engineering.
In the exploration of turbulent flows driven by time-dependent forcing, such as atmospheric circulation driven by the Sun’s radiation causing daily warming and cooling cycles, efforts have been made to investigate temporally modulated turbulent RB convection. For example, Jin & Xia (Reference Jin and Xia2008) experimentally imposed periodic pulses of energy to drive the convective flow, achieving a 7 % increase in heat transfer efficiency as measured by the Nusselt number (
 $Nu$
). Niemela & Sreenivasan (Reference Niemela and Sreenivasan2008) experimentally assessed the flow structure under sinusoidal heating modulation at the lower boundary and discovered a core region with near-superconducting behaviour, where thermal waves propagate without attenuation. Due to experimental challenges in achieving a broad range of modulation frequencies, Yang et al. (Reference Yang, Chong, Wang, Verzicco, Shishkina and Lohse2020) performed DNS over four orders of magnitude of modulation frequencies and reported an appreciable enhancement of
 $Nu$
by up to 25 %. Using the concept of the Stokes thermal boundary layer, they explained the onset frequency of the
 $Nu$
enhancement and the optimal frequency at which
 $Nu$
is maximal. Later, Urban et al. (Reference Urban, Hanzelka, Králik, Musilová and Skrbek2022) used helium gas in cryogenic conditions to create convection cells that respond quickly to temperature changes, allowing them to achieve high modulation amplitudes and a wide range of frequencies. Their results confirmed the numerical predictions of Yang et al. (Reference Yang, Chong, Wang, Verzicco, Shishkina and Lohse2020) regarding the significant enhancement of
 $Nu$
. These advances in understanding temporally modulated buoyancy-driven natural convection lead to the question of how temporal modulation affects flow organization and heat transfer efficiency in mixed convection.
In this work, we aim to investigate the effects of temporal modulation on mixed convection in turbulent channels. Motivated by the studies of atmospheric currents in desert regions, we consider stable, unstable or neutral stratification conditions, achieved by temporally modulating the bottom wall temperature. Based on data from moderate-resolution imaging spectroradiometer observations (Sharifnezhadazizi et al. Reference Sharifnezhadazizi, Norouzi, Prakash, Beale and Khanbilvardi2019), we applied sinusoidal modulation to the bottom wall to mimic diurnal variations in land surface temperature. By analysing turbulent quantities over time within the modulation period, we can unravel the transient mechanisms and phase dynamics of the flow structure (Manna, Vacca & Verzicco Reference Manna, Vacca and Verzicco2015; Ebadi et al. Reference Ebadi, White, Pond and Dubief2019). The rest of this paper is organized as follows. In
 $\S$
2, we present numerical details for the DNS of mixed convection. In
 $\S$
3, we first describe the instantaneous flow and heat transfer features in the temporally modulated mixed convection channel, followed by an analysis of long-time-averaged statistics and phase-averaged statistics. The long-time-averaged quantity is calculated as
 $\overline {\mathbb {F}}(\mathbf {x})=\lim _{N_{{total}}\to \infty }[\sum \mathbb {F}(\mathbf {x},t)]/N_{{total}}$
, where
 $\mathbb {F}(\mathbf {x},t)$
is the instantaneous field and
 $N_{{total}}$
is the total snapshot number of the instantaneous field. The phase-averaged quantity
 $\langle \mathbb {F} (\mathbf {x} ) \rangle _{\phi }$
is calculated as
 $\langle \mathbb {F}(\mathbf {x})\rangle _{\phi }=\lim _{N_{{cycles}}\to \infty }[\sum \mathbb {F}(\mathbf {x},t_k)]/N_{{cycles}}$
, where
 $N_{{cycles}}$
is the number of cycles and
 $t_k$
are the times corresponding to the phase
 $\phi$
. In
 $\S$
4, the main findings of the present work are summarized.
2. Numerical method
2.1. Direct numerical simulation of thermal turbulence
In incompressible thermal convection, we employ the Boussinesq approximation to account for temperature as an active scalar that influences the velocity field through buoyancy effects in the vertical direction, assuming constant transport coefficients. The flow is also driven by a body force (or equivalently a mean pressure gradient) that accounts for shear effects in the horizontal direction. The equations governing fluid flow and heat transfer can be written as
 \begin{align} \nabla \cdot {{\boldsymbol {u}}} = 0, \end{align}
 \begin{align} \frac {\partial \mathbf {u}}{\partial t}+\mathbf {u}\cdot \nabla \mathbf {u}=-\frac 1{\rho _0}\nabla P+\nu \nabla ^2\mathbf {u}+f_b\hat {\mathbf {x}}+g\beta (T-T_0)\hat {\mathbf {y}}, \end{align}
 \begin{align} \frac {{\partial T}}{{\partial t}} + {{\boldsymbol {u}}} \cdot \nabla T = \alpha {\nabla ^2}T. \end{align}
Here,
 ${\boldsymbol {u}}$
is the fluid velocity and
 $P$
and
 $T$
are the pressure and temperature of the fluid, respectively. The coefficients
 $\beta$
,
 $\nu$
and
 $\alpha$
denote the thermal expansion coefficient, kinematic viscosity and thermal diffusivity, respectively. Reference state variables are indicated by subscript zeros. The vectors
 $\hat {\mathbf {x}}$
and
 $\hat {\mathbf {y}}$
are unit vectors in the streamwise and wall-normal directions, respectively. The term
 $g$
represents the gravitational acceleration in the wall-normal direction. The term
 $f_b$
represents a body force used to maintain a constant bulk flow rate in the streamwise direction. This forcing is spatially uniform but time-dependent, allowing precise control over the flow rate at each time step (Pirozzoli et al. Reference Pirozzoli, Bernardini, Verzicco and Orlandi2017). While a constant pressure gradient is commonly used to drive flow in channel simulations, in the presence of buoyancy forces, a constant pressure gradient can lead to variations in the bulk flow rate, as buoyancy may either enhance or oppose the mean flow depending on the temperature distribution. By maintaining a constant flow rate in mixed convection, we can use the mean flow strength as a control parameter, allowing us to effectively attribute changes in flow behaviour to specific factors such as thermal stratification or flow strength.
We introduce the non-dimensional variables
 \begin{align} {{\boldsymbol {x}}^*} & = {\boldsymbol {x}}/H,\;\;\;{t^*} = t/ ({H/u_b}) ,\;\;\;{\boldsymbol {u}}^* = {{\boldsymbol {u}}}/u_b, \nonumber\\ {P^*} & = P/({\rho _0}{u_b}^2),\;\;\;T^* = ({T} - {T_0})/{\Delta _T},\;\;\;{f_b}^* = f_b/({{u_b}^2/H}), \end{align}
where
 $u_b$
is the bulk velocity,
 $H$
denotes the channel height and
 $\Delta _T = T_{{hot}}-T_{{cold}}$
is the temperature difference between the heating and cooling walls. We can rewrite (2.1)–(2.3) in dimensionless form:
 \begin{align} \nabla \cdot {\boldsymbol {u}}^* = 0, \end{align}
 \begin{align} \frac {\partial \mathbf {u}^*}{\partial t^*}+\mathbf {u}^*\cdot \nabla \mathbf {u}^*=-\nabla P^*+\frac 1{Re_b}\nabla ^2\mathbf {u}^*+f_b^*\hat {\mathbf {x}}+\frac {Ra}{Re_b^2Pr}T^*\hat {\mathbf {y}}, \end{align}
 \begin{align} \frac {{\partial {T^*}}}{{\partial {t^*}}} + {{\boldsymbol {u}}^*} \cdot \nabla {T^*} = \frac {1}{{Re_b Pr}} {\nabla ^2}{T^*}. \end{align}
Here, the control dimensionless parameters include the bulk Reynolds number (
 $Re_{b}$
), Rayleigh number (
 $Ra$
) and Prandtl number (
 $Pr$
), which are defined as
 \begin{equation} Re_b = \frac {Hu_b}{\nu },\;\;\;Ra = \frac {{g\beta {\Delta _T}{H^3}}}{{\nu \alpha }},\;\;\;Pr = \frac {\nu }{\alpha }. \end{equation}
The global competition between shear and buoyancy effects can be quantified by the bulk Richardson number (
 $Ri_b$
) as
 $Ri_b=Ra/(Re_b^2 Pr)$
. The extreme cases of
 $Ri_b = 0$
represent purely shear driving and
 $Ri_b=\infty$
represents purely buoyancy driving. We adopt the finite volume method (FVM) implemented in the open-source OpenFOAM solver (Version 8) for DNS. Specifically, we use the transient buoyantPimpleFoam solver with the turbulence model turned off. Convective terms and viscous terms are discretized using a second-order central differencing scheme, while temporal terms are discretized using a second-order implicit backward differencing scheme based on three time levels. Pressure–velocity coupling is achieved with the pressure-implicit splitting of operators (PISO) algorithm, with PISO corrections set to four, following the settings by Komen et al. (Reference Komen, Shams, Camilo and Koren2014). For the momentum equation, we use a preconditioned biconjugate gradient method designed for asymmetric matrices, along with diagonal-based incomplete LU preconditioning. The pressure equation is solved using the geometric agglomerated algebraic multigrid method. Time advancement is controlled by adaptive time stepping, with the adaptive time step regulated by the cell-face Courant number, keeping the maximum cell-face Courant numbers below 0.5. More numerical details and validation of the OpenFOAM solver can be found in Komen et al. (Reference Komen, Shams, Camilo and Koren2014, Reference Komen, Camilo, Shams, Geurts and Koren2017) and Kooij et al. (Reference Kooij, Botchev, Frederix, Geurts, Horn, Lohse, van der Poel, Shishkina, Stevens and Verzicco2018). To verify our OpenFOAM results, we also conducted simulations at
 $Re_b \approx 3162$
,
 $Ra = 10^7$
and
 $Pr = 1$
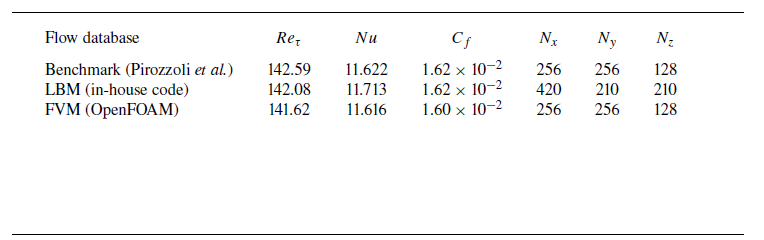
using an in-house solver based on the lattice Boltzmann method (LBM) (Xu, Shi & Zhao Reference Xu, Shi and Zhao2017; Xu & Li Reference Xu and Li2023; Xu & Li Reference Xu and Li2023). The results from both the open-source OpenFOAM solver and the in-house lattice Boltzmann solver were consistent, as discussed in appendix A.
2.2. Simulation settings
Schematic illustration of the temporally modulated mixed convection channel.

We explore the dynamics of mixed convection within a three-dimensional (3-D) channel of dimensions
 $L \times H \times W$
, as illustrated in figure 1. Here,
 $L$
is the length,
 $H$
is the height and
 $W$
is the width of the simulation domain,
 $x$
denotes the streamwise direction,
 $y$
denotes the wall-normal direction and
 $z$
denotes the spanwise direction. The computational domain size is chosen as
 $2\pi h \times 2h \times \pi h$
to ensure the spanwise domain size is close to the minimal spanwise size required to achieve developed turbulence in mixed convection simulations (Pirozzoli et al. Reference Pirozzoli, Bernardini, Verzicco and Orlandi2017). Here,
 $h=H/2$
is the half-height of the channel. Periodic boundary conditions for velocity and temperature are applied in the streamwise and spanwise directions to exploit statistical homogeneity. In the wall-normal direction, no-slip velocity boundary conditions are imposed on the top and bottom walls of the channel. The grid size distribution is symmetric about the midplane, with cell sizes increasing geometrically from the wall to the bulk using a geometric progression. Specifically, the cell size for the
 $i$
th grid
 $\Delta y_{i}$
can be defined as
 $\Delta y_{i} = \Delta y_{{wall}} q^{i-1}$
(for
 $i=1,2,\ldots ,M$
), where
 $\Delta y_{{wall}}$
is the starting cell size,
 $q$
is the common ratio of the geometric progression and
 $M$
is the number of cells in the half-channel. The expansion ratio
 $r$
of the cell size, defined as the ratio of the end cell size
 $\Delta y_{{bulk}}$
to the starting cell size
 $\Delta y_{{wall}}$
, is expressed as
 $r=\Delta y_{{bulk}} / \Delta y_{{wall}}$
. This gives
 $q=r^{1/(M-1)}$
and
 $\Delta y_{{wall}}=h(1-q)/(1-q^M)$
. We set
 $r=8$
for
 $Ra = 10^6$
and
 $r=5$
for
 $Ra = 10^7$
and
 $10^8$
in the simulations. We referenced the grid set-up used by Pirozzoli et al. (Reference Pirozzoli, Bernardini, Verzicco and Orlandi2017), which is based on the resolution requirements for pure buoyant flow (Shishkina et al. Reference Shishkina, Stevens, Grossmann and Lohse2010) and pure channel flow (Bernardini, Pirozzoli & Orlandi Reference Bernardini, Pirozzoli and Orlandi2014). We performed an a posteriori validation for all simulation cases, ensuring that the grid size in each coordinate direction is less than three Kolmogorov units in all cases.
For the temperature boundary condition, the top wall is maintained at a constant low temperature of
 $T_{{top}}=T_{{cold}}$
, while the bottom wall is subjected to a sinusoidal modulation
 $T_{{bottom}}=T_{{hot}}+A(T_{{hot}}-T_{{cold}})\sin (2\pi ft)$
. Here,
 $A$
is the modulation amplitude,
 $f$
is the modulation frequency and
 $t$
is time. We define the phase angle of the modulation as
 $\phi =2\pi ft$
, and this phase angle
 $\phi$
will be used to describe the temporal progression of the modulation. The modulation amplitude is fixed as
 $A = 2$
, resulting in a temperature difference
 $\Delta _T^*= (T_{{bottom}}-T_{{top}} )/ (T_{{hot}}-T_{{cold}} )=1+2\sin (2\pi ft )$
, covering the regimes of unstable stratification (
 $\Delta _{T} \gt 0$
), neutral stratification (
 $\Delta _{T}=0$
) and stable stratification (
 $\Delta _{T}\lt 0$
). Previously, Yang et al. (Reference Yang, Chong, Wang, Verzicco, Shishkina and Lohse2020) fixed the modulation amplitude as
 $A = 1$
in RB convection, which did not explore the stable stratification cases because
 $A = 1$
leads to
 $\Delta _{T}\geqslant 0$
. We adopt the buoyancy time scale
 $t_{f}=\sqrt {H/(g\beta \Delta _{T})}$
to non-dimensionalize the modulation period
 $T_{{period}}$
as
 $T_{{period}}^{*}=T_{{period}}/t_{f}$
(Yang et al. Reference Yang, Chong, Wang, Verzicco, Shishkina and Lohse2020). We set the dimensionless modulation frequency
 $f^{*}$
in the range
 $0.01\leqslant f^{*}=1/T_{{period}}^{*}=t_{f}/T_{{period}} \leqslant 1$
. Another approach is to adopt the bulk convective time scale
 $t_{b}=H/u_{b}$
to non-dimensionalize the modulation period as
 $T_{{period}}^{*}=T_{{period}}/t_{b}$
. In this case, the modulation frequency is given by
 $f^{*}_{b}=t_{b}/T_{{period}}=f^{*}t_{b}/t_{f}$
, leading to
 $f^{*}_{b}=\sqrt {Ri_{b}}f^{*}$
. Because the wall temperature modulation changes the buoyancy within the flow system, we will focus on discussing
 $f^{*}$
in the following analysis.
To determine the Rayleigh number, the time-averaged temperature difference
 $\langle {\Delta _T} \rangle _{t}=T_{{hot}}-T_{{cold}}$
is adopted as
 $Ra=g\beta \langle {\Delta _T} \rangle _{t} H^3/(\nu \alpha )$
, and the Rayleigh number is in the range of
 $10^6 \leqslant Ra \leqslant 10^8$
. We fix the Prandtl number as
 $Pr = 0.71$
for the working fluid of air. The bulk Reynolds number is
 $Re_b =10^{3.75} \approx 5623$
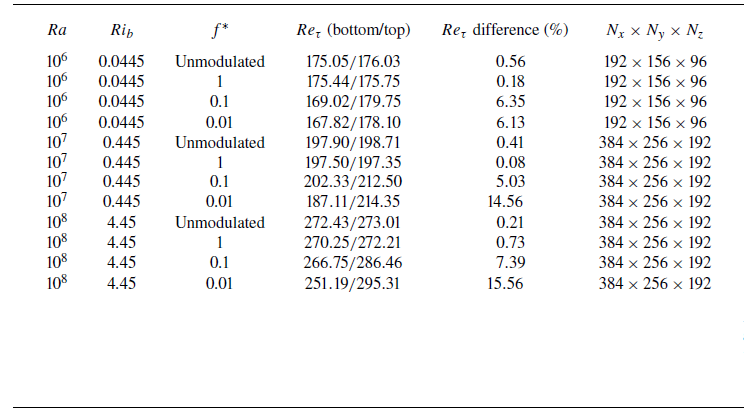
, and the corresponding friction Reynolds number
 $Re_{\tau }=u_{\tau }h/\nu$
is also provided in table 1, where
 $u_{\tau }=\sqrt {\langle {\tau _{w}}\rangle /\rho }$
is the friction velocity associated with the mean wall shear stress
 $\langle {\tau _{w}}\rangle$
. We are particularly interested in the mixed convection regime, such that the Richardson number is in the range of
 $0.0445 \leqslant Ri_b \leqslant 4.45$
. A list of the bulk flow parameters obtained from all the simulations conducted in this study is provided in table 1, and their relevance to atmospheric currents in desert regions is discussed in appendix B.
Numerical details of flow quantities. The columns from left to right indicate the following: Rayleigh number
 $Ra$
; bulk Richardson number
 $Ri_b$
; wall temperature modulation frequency
 $f^{*}$
; friction Reynolds number
 $Re_{\tau }$
at the bottom and top wall, respectively, and their relative differences due to asymmetric boundary conditions; grid number
 $N_x \times N_y \times N_z$
.

Typical instantaneous isosurfaces of the
 $Q$
-criterion,
 $Q^* = (\|{\boldsymbol{\Omega} }^*\|^2-\|\mathbf {S}^*\|^2 )/2 = 15$
coloured by the local temperature
 $T^*$
, at phase angle (a,b)
 $\phi = 0$
, (c,d)
 $\phi = \pi /2$
, (e,f)
 $\phi = \pi$
, (g,h)
 $\phi = 3\pi /2$
, with frequency (a,c,e,g)
 $f^* = 1$
, (b,d,f,h)
 $f^* = 0.01$
, for
 $Ra = 10^7$
and
 $Re_b \approx 5623$
.

3. Results and discussion
3.1. Instantaneous flow and heat transfer features
In figure 2, we show snapshots of isosurfaces of the
 $Q$
-criterion, coloured by the local temperature
 $T^*$
, and the corresponding video can be viewed in supplementary movie 1 available at https://doi.org/10.1017/jfm.2025.22. The
 $Q$
-criterion visualizes vortices where the magnitude of vorticity
 ${\boldsymbol{\Omega} }=[\nabla \mathbf {u}-(\nabla \mathbf {u})^T]/2$
exceeds the magnitude of the strain rate
 $\mathbf {S}=[\nabla \mathbf {u}+(\nabla \mathbf {u})^T]/2$
, making it an effective tool for illustrating vortical structures (Hunt, Wray & Moin Reference Hunt, Wray and Moin1988). At a higher modulation frequency of
 $f^* = 1$
(see figure 2
a,c,e,g), the vortex structures are concentrated near the wall and appear relatively unchanged across different phase angles. At a lower modulation frequency of
 $f^* = 0.01$
(see figure 2
b,d,f,h), the effect of temporal modulation on wall temperature is evident, and the vortex structure exhibits a pronounced temporal evolution. Specifically, an increased number of structures are identified at
 $\phi = \pi /2$
and
 $\phi = \pi$
, carried by hot fluids. An interesting observation is that when the wall temperature modulation leads to a stable condition (see figure 2
h), the vortices near the bottom wall almost disappear. The absence of vortex interaction implies that the turbulent flow near the bottom wall is significantly weakened, although vortices still emerge and turbulent flow remains active on the top wall. The slower modulation frequency allows for the development of diverse flow structures and temperature distributions at each phase, indicating the fluid’s ability to adapt to each state of the heating and cooling cycles. In contrast, rapid modulation does not give the fluid enough time to significantly rearrange its structure within one modulation cycle, resulting in a consistent pattern regardless of the phase angle.
Typical instantaneous velocity component
 $v^*$
at channel centre plane (
 $y = h$
) at phase angle (a,b)
 $\phi = 0$
, (c,d)
 $\phi = \pi /2$
, (e,f)
 $\phi = \pi$
, (g,h)
 $\phi = 3\pi /2$
, with frequency (a,c,e,g)
 $f^* = 1$
, (b,d,f,h)
 $f^* = 0.01$
, for
 $Ra = 10^7$
and
 $Re_b \approx 5623$
.

Typical instantaneous temperature
 $T^*$
in cross-stream plane at phase angle (a,b)
 $\phi = 0$
, (c,d)
 $\phi = \pi /2$
, (e,f)
 $\phi = \pi$
, (g,h)
 $\phi = 3\pi /2$
, with frequency (a,c,e,g)
 $f^* = 1$
, (b,d,f,h)
 $f^* = 0.01$
, for
 $Ra = 10^7$
and
 $Re_b \approx 5623$
.

We show the instantaneous velocity component
 $v^{*}$
at the channel centre plane (
 $y = h$
) in figure 3, corresponding to the instantaneous state presented in figure 2. In convective flow, rising fluids are warmer, and falling fluids are colder; thus, we do not show the corresponding temperature field
 $T^*$
at this plane. However, we have verified that the correlation coefficient between
 $v^*$
and
 $T^*$
is larger than 0.47. At a Rayleigh number of
 $Ra = 10^7$
and a bulk Reynolds number of
 $Re_b \approx 5623$
, with a fixed Prandtl number of
 $Pr = 0.71$
, the corresponding Richardson number is
 $Ri_{b} = 0.45$
. At this intermediate Richardson number, the shear-driven and buoyancy-driven turbulence production rates are nearly balanced. The flow exhibits rolls pointing in the streamwise direction, with a strong meandering behaviour due to the wavy instability of the rolls. This overall trend is similar to that reported by Pirozzoli et al. (Reference Pirozzoli, Bernardini, Verzicco and Orlandi2017). In addition, we found that at a higher modulation frequency of
 $f^* = 1$
(see figure 3
a,c,e,g), the pair of counter-rotating rolls within the flow domain remains relatively stable in strength. The stability of these rolls demonstrates the flow’s resilience against high-frequency thermal perturbations, suggesting an inherent inertia in the thermal field that resists rapid changes. However, at a lower modulation frequency of
 $f^* = 0.01$
(see figure 3
b,d,f,h), the strength of the roll varies with the phase angle. Specifically, the rolls are stronger during the heating phase (
 $T_{{bottom}}\gt T_{{hot}}$
); they are much weaker, or even disappear, during the cooling phase (
 $T_{{bottom}}\lt T_{{hot}}$
).
We show the temperature field
 $T^*$
in the cross-stream plane, which complements the velocity contours at the channel centre plane shown in figure 3, and the corresponding video can be viewed in supplementary movie 2. During the heating phase, we observe frequent hot plume emissions near the bottom wall, becoming more pronounced after the wall temperature cycle reaches its peak (see figure 4
e,f). In contrast, during the cooling phase (see figure 4
g,h), plume emissions from the bottom wall are absent due to stable stratification, resulting in the weakening of buoyancy forces. In this stable stratification, internal gravity waves separate the bottom cold part and the top hot part (Zonta et al. Reference Zonta, Sichani and Soldati2022). We also observe the effect of modulation frequency on temperature evolution. At a higher frequency of
 $f^* = 1$
, the upward- and downward-travelling plumes detaching from the boundary layers are almost unaffected by the phase angle, explaining the relatively stable pair of counter-rotating rolls found in figure 3(a,c,e,g). At a lower frequency of
 $f^* = 0.01$
, the slower frequency allows the temperature to respond to changes in the thermal boundaries and adapt to each state of the modulation cycle (see figure 4
b,d,f,h). During the heating phase, hot rising plumes deeply penetrate into the bulk region of the channel. During the cooling phase, a stably stratified layer forms near the bottom wall, acting as a thermal blanket. The overall behaviour mirrors the dynamics observed in atmospheric flow (Dupont & Patton Reference Dupont and Patton2022). After sunrise, the ground heats up, destabilizing atmospheric conditions and forming a mixed layer with a relatively uniform temperature profile due to turbulent mixing. After sunset, the ground cools down more rapidly than the air above it, forming a stable boundary layer close to the surface. This layer sits beneath the remnants of the daytime mixed layer, where turbulence gradually decays in the absence of additional production mechanisms.
Typical instantaneous vertical convective heat flux
 $v^* \delta T^*$
at phase angle (a,b)
 $\phi$
= 0, (c,d)
 $\phi$
=
 $\pi$
/2, (e,f)
 $\phi$
=
 $\pi$
, (g,h)
 $\phi$
= 3
 $\pi$
/2, with frequency (a,c,e,g)
 $f^* = 1$
, (b,d,f,h)
 $f^* = 0.01$
, for
 $Ra = 10^7$
and
 $Re_b \approx 5623$
.

To examine the influence of wall temperature modulation on local heat transfer properties, we show slices of vertical convective heat flux
 $v^*\delta T^*$
in figure 5, corresponding to the instantaneous state presented in figure 2. Here, the temperature fluctuation is defined as
 $\delta T^* = T^* - \langle T \rangle _{V,t}$
, and
 $\langle \cdots \rangle _{V,t}$
denotes the average over the whole channel and over the time. At a higher frequency of
 $f^* = 1$
(see figure 5
a,c,e,g), positive values of vertical heat flux predominantly appear within the channel, while negative values occur near both the top and bottom walls. This counter-gradient heat transfer is attributed to sweeps of hotter fluid towards the bottom wall and colder fluid towards the top wall. In contrast, at a lower frequency of
 $f^* = 0.01$
(see figure 5
b,d,f,h), there is a strong counter-gradient heat flux in the bulk region of the channel, driven by the bulk dynamics of rolls, similar to the mechanism in RB convection (Gasteuil et al. Reference Gasteuil, Shew, Gibert, Chillà, Castaing and Pinton2007; Huang & Zhou Reference Huang and Zhou2013). Detached plumes move with the streamwise-oriented roll, and after reaching the opposite wall, some plumes retain thermal energy and remain hotter or colder than their surroundings. They continue moving with the rolls, resulting in the falling of hot fluid or the rising of cold fluid, thus generating negative vertical heat flux.
We further show the instantaneous streamwise velocity component
 $u^*$
at a near-wall station of
 $y = 0.05 h$
in figure 6. At a higher modulation frequency of
 $f^* = 1$
(see figure 6
a,c,e,g), near-wall streaks are observed even in the presence of strong buoyancy. These streaks are often associated with vigorous momentum transfer and robust turbulence production. However, at a lower modulation frequency of
 $f^* = 0.01$
(see figure 6
b,d,f,h), during the cooling phase, which leads to stable stratification of the fluid, the near-wall burst-sweep process is completely disrupted (see figure 6
h). This disruption ceases turbulence production and shows tendencies of relaminarization near the bottom wall. During the heating phase, which leads to unstable stratification, the near-wall streaks appear again.
Typical instantaneous velocity component
 $u^*$
at near-wall station (
 $y = 0.05 h$
) at phase angle (a,b)
 $\phi = 0$
, (c,d)
 $\phi = \pi /2$
, (e,f)
 $\phi = \pi$
, (g,h)
 $\phi = 3\pi /2$
, with frequency (a,c,e,g)
 $f^* = 1$
, (b,d,f,h)
 $f^* = 0.01$
, for
 $Ra = 10^7$
and
 $Re_b \approx 5623$
.

(a–c) The second most energetic POD modes, visualizations of isosurfaces of vertical velocity
 $v$
(red colour represents
 $v\gt 0$
and blue colour represents
 $v\lt 0$
), and (d–f) the cross-correlation functions between bottom wall temperature
 $T_{{bottom}}(t)$
and POD mode amplitudes
 $a_2(t)$
as a function of dimensionless lag time
 $\tau /T_{{period}}$
, at modulation frequency of (a,d)
 $f^* = 1$
, (b,e)
 $f^* = 0.1$
, (c,f)
 $f^* = 0.01$
, for
 $Ra = 10^7$
and
 $Re_b \approx 5623$
.

To extract the large-scale coherent flow structures, we perform proper orthogonal decomposition (POD) on the turbulent dataset (Berkooz, Holmes & Lumley Reference Berkooz, Holmes and Lumley1993). The POD has been widely employed to study the dynamics of large-scale circulation in convection cells (Podvin & Sergent Reference Podvin and Sergent2015; Castillo-Castellanos et al. Reference Castillo-Castellanos, Sergent, Podvin and Rossi2019; Soucasse et al. Reference Soucasse, Podvin, Rivière and Soufiani2019; Xu, Chen & Xi Reference Xu, Chen and Xi2021). Specifically, the spatiotemporal flow velocity field
 $\mathbf {u}(\textbf {x}, t)$
is decomposed into a superposition of empirical orthogonal eigenfunctions
 $\mathbf {\phi }_i(\mathbf {x})$
and their scalar amplitudes
 $a_i(t)$
as
 \begin{equation} \mathbf {u}(\mathbf {x},t)=\sum _{i=1}^\infty a_i(t) \mathbf {\phi }_i(\mathbf {x}). \end{equation}
Here,
 $\mathbf {u}(\mathbf {x},t)=[u(\mathbf {x},t), v(\mathbf {x},t), w(\mathbf {x},t)]^T$
represents the vector field with components
 $u$
,
 $v$
and
 $w$
,
 $\mathbf {\phi }_{i}(\mathbf {x})=[\phi _{i}^{u}(\mathbf {x}), \phi _{i}^{v}(\mathbf {x}), \phi _{i}^{w}(\mathbf {x})]^T$
represents the spatial eigenfunctions (i.e. the POD modes) and
 $a_{i}(t)$
are the temporal coefficients representing the time-dependent amplitudes of the corresponding modes. We used at least 900 snapshots to adequately capture the flow structure, ensuring the dominant modes are representative. At parameters of
 $Ra = 10^7$
and
 $Re_b \approx 5623$
(i.e. the corresponding
 $Ri_{b}=0.445$
), we have that the most energetic POD mode corresponds to the streamwise unidirectional shear flow with parallel streamlines pointing along the
 $x$
direction. Then, in figure 7(a–c), we present the second most energetic POD modes, which are essentially the dominant mode for the fluctuation velocity field. Regardless of the temporal modulation frequency of the bottom wall temperature, streamwise-oriented rolls that fill the whole channel height are observed. We also examined the time series of mode amplitudes
 $a_i(t)$
and studied the relationship between wall temperature
 $T_{{bottom}} (t )=T_{{hot}}+2(T_{{hot}}-T_{{cold}})\sin (2\pi ft)$
and the second POD mode amplitude
 $a_2(t)$
by calculating their cross-correlation functions as
 \begin{equation} R_{T_{{bottom}},a_2}\left (\tau \right )=\frac {\left \langle \left [T_{{bottom}}\left (t+\tau \right )-\left \langle T_{{bottom}}\right \rangle \right ]\left [ a_2(t)-\left \langle a_2 \right \rangle \right ]\right \rangle }{\sigma _{T_{{bottom}}}\sigma _{a_2}}, \end{equation}
where
 $\sigma _{T_{{bottom}}}$
and
 $\sigma _{a_2}$
are the standard deviation of
 $T_{{bottom}}$
and
 $a_2$
, respectively. As shown in figure 7(d–f), at higher modulation frequency of
 $f^* = 1$
and
 $f^* = 0.1$
,
 $T_{{bottom}}$
are uncorrelated with
 $a_2$
, indicating that the large-scale rolls are not influenced by changes in wall temperature. However, at a lower modulation frequency of
 $f^* = 0.01$
, we observe a strong correlation between
 $T_{{bottom}}$
and
 $a_2$
, implying that the strength of the large-scale rolls is significantly affected by temperature modulation on the wall. These large-scale rolls are a recognized structural characteristic of atmospheric boundary layers, present in scenarios with mean streamwise flow and exhibiting overall streamwise helical patterns. These patterns are responsible for transporting warmer air towards the capping inversion and cooler air towards the ground (Jayaraman & Brasseur Reference Jayaraman and Brasseur2021).
We then computed the energy content of the
 $i$
th POD mode
 $\lambda _i$
. In figure 8, we show the spectra of
 $\lambda _i$
, where each value of
 $\lambda _i$
is normalized by the total energy
 $\sum \lambda _{i}$
. At
 $Ra = 10^{7}$
, the energy content of the first POD mode
 $\lambda _1$
dominates, accounting for over 95 % of the total energy and representing the mean flow (streamwise unidirectional shear flow). The energy content of the second and third POD modes
 $\lambda _2$
and
 $\lambda _3$
each contributes approximately 0.1 %–0.6 % of the total energy. At a higher Rayleigh number of
 $Ra=10^8$
, with the same bulk Reynolds number of
 $Re_b \approx 5623$
, the energy contained in the first mode reduces to approximately 80 % due to the enhanced effect of buoyancy, while the second and third modes each contribute around 2 % of the total energy. These results indicate that both the second and third modes play a role in capturing the flow dynamics.
The energy contained in each mode, for (a)
 $Ra = 10^{7}$
and (b)
 $Ra = 10^{8}$
.

Due to the periodicity in the wall boundary conditions, the streamwise-oriented rolls are non-stationary and continually move along the spanwise direction. To illustrate this, we quantitatively describe the movement of the rolls by tracking their centre. Because the axes of these rolls align with the streamwise direction and do not exhibit the complex motion seen in RB convection (Vogt et al. Reference Vogt, Horn, Grannan and Aurnou2018; Li et al. Reference Li, Chen, Xu and Xi2022; Teimurazov et al. Reference Teimurazov, Singh, Su, Eckert, Shishkina and Vogt2023), we can track their edges by identifying locations where the vertical velocity component is minimal or maximal. The centre of each roll is then determined by calculating the arithmetic mean of these points. The POD analysis reveals that not only the second most energetic POD modes but also higher POD modes can represent these rolls. For example, at
 $Ra = 10^7$
,
 $Re_b \approx 5623$
and
 $f^* = 0.1$
, both the second and third POD modes correspond to streamwise-oriented rolls, albeit offset along the spanwise direction. Thus, we use both the second and third POD modes to recover the streamwise-oriented roll at
 $f^* = 0.1$
. Figure 9(a) shows the instantaneous recovered flow field at
 $x = L/2$
, representing a pair of counter-rotating streamwise-oriented rolls. Here, we mark the edges and centre of one roll to demonstrate the effectiveness of our approach in tracking the roll motion. When the roll centre exits one side of the domain, we account for the domain’s periodicity by wrapping its position to the opposite side, resulting in a continuous trajectory. In figure 9(b), we plot the time series of the centre of this roll along the spanwise direction. The results suggest that the streamwise-oriented roll moves along the spanwise direction, occasionally appearing to exit from one side of the domain and re-enter from the other.
(a) Typical instantaneous flow field recovered using the second and third POD modes at
 $Ra=10^{7}$
,
 $Re_{b} \approx 5623$
and
 $f^*=0.1$
. The contour represents the vertical velocity component, and the arrow represents the velocity field of recovered velocity components. The magenta diamonds mark the edges of the rolls and the blue circles mark the roll centre. (b) The time series of the position of the roll centre.

A smaller domain may restrict the formation of large structures due to the imposed periodic boundary conditions and limited spatial extent (Stevens et al. Reference Stevens, Hartmann, Verzicco and Lohse2024); thus we conducted additional simulations in a larger domain (
 $4\pi h \times 2h \times 2 \pi h$
). In this expanded domain, at
 $Ra=10^7$
and
 $Re_b \approx 5623$
(i.e. the corresponding
 $Ri_b=0.445$
), we observed two pairs of counter-rotating straight rolls (see figure 10
a), which align with expectations based on domain scaling. In other words, doubling the horizontal extent resulted in two roll pairs, compared with one pair in the smaller domain. We then examined the second POD modes in this large domain at
 $Ra=10^8$
and
 $Re_b \approx 5623$
(i.e. the corresponding
 $Ri_b=4.45$
). As shown in figure 10(b), the isosurfaces reveal variations in the vertical velocity, with alternating regions of upward (positive) and downward (negative) flow. The higher Rayleigh number induces stronger buoyancy forces and increased thermal driving, which leads to the breakdown of coherent rolls into smaller, more chaotic structures. While these structures remain somewhat aligned in the streamwise direction, they appear increasingly fragmented, indicating a transition towards a more convection-dominated state. Accordingly, we refer to these structures at
 $Ra = 10^8$
as fragmented streamwise-oriented rolls.
The second POD mode in a domain size of
 $4\pi h \times 2 h \times 2 \pi h$
, visualizations of isosurfaces of vertical velocity (red colour represents
 $v\gt 0$
and blue colour represents
 $v\lt 0$
) at (a)
 $Ra = 10^{7}$
, (b)
 $Ra = 10^{8}$
, with
 $f^* = 0.1$
.

3.2. Long-time-averaged statistics
(a) Friction coefficient, (b) values of
 $C_f/C_{f0}-1$
, (c) Nusselt number and (d) values of
 $Nu/Nu_0-1$
, as functions of
 $f^*$
for various
 $Ra$
. Here,
 $C_{f0}$
and
 $Nu_0$
are the friction coefficient and Nusselt numbers without wall temperature modulation, respectively.

To study changes induced on the mean flow and temperature by the wall temperature modulation, we now focus on the long-time-averaged statistics. In figure 11, we present statistics of aerodynamic drag and heat transfer as a function of modulation frequency for various Rayleigh numbers, which is a topic of interest in meteorology and engineering (Yerragolam et al. Reference Yerragolam, Verzicco, Lohse and Stevens2022, Reference Yerragolam, Howland, Stevens, Verzicco, Shishkina and Lohse2024). In figure 11(a), we examine the aerodynamic drag in terms of friction coefficients (
 $C_f$
) at the bottom wall, which is calculated as
 $C_f=2\langle \tau _w \rangle /(\rho u_b^2)$
. The increased drag due to the emission of plumes in thermal field is consistent with that reported by Scagliarini et al. (Reference Scagliarini, Einarsson, Gylfason and Toschi2015), Pirozzoli et al. (Reference Pirozzoli, Bernardini, Verzicco and Orlandi2017) and Howland et al. (Reference Howland, Yerragolam, Verzicco and Lohse2024). With wall temperature modulation, we observe that aerodynamic drag is not very sensitive to the wall temperature modulation frequency. Figure 11(b) further visualizes the relative changes of
 $C_f$
with wall temperature modulation, showing that the variation in
 $C_f$
is less than 15 %. In figure 11(c), we examine the heat transfer efficiency in terms of the Nusselt number (
 $Nu$
), which is calculated as
 $Nu=\sqrt {RaPr/Ri_{b}} \langle v^* T^* \rangle _{V,t}+1$
. The
 $Nu$
at the highest modulation frequency is the same as that without wall temperature modulation. With the decrease in modulation frequency, we observe enhanced heat transfer efficiency for all Rayleigh numbers. Previously, in pure RB convection, Yang et al. (Reference Yang, Chong, Wang, Verzicco, Shishkina and Lohse2020) reported a regime where the modulation is too fast to affect
 $Nu$
, a regime where
 $Nu$
increases with decreasing
 $f^*$
and a regime where
 $Nu$
decreases with further decreasing
 $f^*$
. Our results in mixed PRB convection cover the first two regimes reported in pure RB convection, yet we did not further explore slower frequency due to the high computational cost in the 3-D simulation. Figure 11(d) further visualizes that among the three Rayleigh numbers,
 $Ra = 10^8$
results in the largest magnitude of heat transfer efficiency, up to 96 %. At high Rayleigh numbers, convective patterns are more vigorous, and wall temperature modulation has a more disruptive effect. Higher frequencies likely cause more frequent disturbances in the boundary layers, reducing heat transfer efficiency by breaking up coherent thermal plumes.
Mean profiles of (a–c) streamwise velocity and (d–f) temperature (a,d) along the whole channel height, (b,e) along the bottom half-height and (c,f) along the top half-height, for
 $Ra = 10^7$
and
 $Re_b \approx 5623$
.

In figure 12, we show the mean profiles for streamwise velocity and temperature across the channel height to illustrate the effects of wall temperature modulation on the mean flow. We denote the mean velocity and mean temperature by an overbar, and the fluctuating quantities by a prime; thus we have
 $u=\overline {u}+u'$
and
 $T=\overline {T}+T'$
. Consistent with our observations on flow organization, these mean profiles are similar between scenarios without wall temperature modulation and those with the highest modulation frequency (
 $f^* = 1$
). For the mean streamwise velocity profile, it is symmetric about the midplane
 $y = h$
at the highest frequency of
 $f^* = 1$
; however, slight asymmetry is observed at lower frequencies of
 $f^* = 0.1$
and 0.01 (see figure 12
a). This asymmetry is also evident from table 1, which shows the relative differences in friction Reynolds numbers. To highlight the modulation effect in the near-wall regions, we replot the velocity data using wall scaling in figures 12(b) and 12(c). Here, the superscript ’+’ indicates normalization using the kinematic viscosity
 $\nu$
and the friction velocity
 $u_{\tau }$
in wall units. The distances from the walls are then given by
 $y^+=yu_{\tau }/\nu$
. We can see that at lower frequencies, the average streamwise velocity
 $\overline {u}^{+}=\overline {u}/u_{\tau }$
decreases near the bottom wall (see figure 12
b) and increases near the top wall (see figure 12
c). As for the mean temperature profile, at
 $f^* = 1$
, the temperature decreases monotonically from the bottom wall, stabilizing at a constant value of the arithmetic mean temperature
 $T^* = 0.5$
in the bulk region, and is antisymmetric about the midplane (see figure 12
d). This pattern recovers the canonical RB convection profile. However, at
 $f^* = 0.1$
and 0.01, deviations from the profiles without wall modulation are evident. The temperature first decreases and then increases near the bottom wall, until it reaches a plateau in the bulk region. Similar to findings in RB convection (Yang et al. Reference Yang, Chong, Wang, Verzicco, Shishkina and Lohse2020), our results suggest that at lower modulation frequencies, the bulk temperature increases compared with cases without wall temperature modulation. We also replot the temperature data using wall scaling, as shown in figures 12(e) and 12(
 $f$
). For a straightforward comparison between the heating and cooling sides, we calculate the average temperature as
 $\overline {T}^{+}= |\overline {T}-\langle T_{{wall}}\rangle |/T_{\tau }$
. Here,
 $\langle T_{{wall}}\rangle$
is the mean temperature at either the bottom wall or top wall, and the friction temperature
 $T_{\tau } = Q/u_{\tau }$
is used to normalize the average temperature, where
 $Q$
is total vertical heat flux, calculated as
 $Q = (\alpha \Delta _{T}/H) Nu$
. At
 $f^* = 0.1$
and 0.01, we observe a peak in the
 $\overline {T}^{+}$
profile at
 $y^+ \approx 17$
(see figure 12
e) due to the formation of thermal Stokes layers by the oscillatory wall temperature (Yang et al. Reference Yang, Chong, Wang, Verzicco, Shishkina and Lohse2020); however, such a peak is absent at a higher frequency of
 $f^* = 1$
, as well as near the top wall where the wall temperature is constant (see figure 12
 $f$
).
To examine the influence of wall temperature modulation on turbulence quantities, in figure 13, we present the root-mean-square (r.m.s.) fluctuation of velocity components and temperature along the lower half-height of the channel. The peak of the r.m.s. streamwise velocity profile consistently occurs at
 $y^+\approx 15$
(see figure 13
a), where turbulent eddies are most active, similar to observations in turbulent channel flow without convection (Moser, Kim & Mansour Reference Moser, Kim and Mansour1999). The wall-normal velocity fluctuation increases throughout the half-channel height due to wall temperature modulation, becoming comparable to or even larger than the streamwise component (see figure 13
b). These fluctuations, sensitive to buoyancy effects, suggest that lower-frequency thermal modulations enhance buoyancy-driven turbulence. The spanwise velocity fluctuation also increases in the near-wall region with wall temperature modulation (see figure 13
c). This increase in wall-normal and spanwise velocity fluctuation implies that fluid columns rising from the bottom wall activate cross-stream eddies near the wall. As for the r.m.s. of the temperature (see figure 13
d), lower-frequency wall temperature modulations (
 $f^* = 0.01$
) yield higher peaks in temperature fluctuations near the wall, indicating a more unstable thermal boundary layer with larger eddies under slower temperature modulation. In contrast, higher frequencies (
 $f^* = 1$
) appear to stabilize the thermal boundary layer, leading to less pronounced temperature fluctuations.
The r.m.s. fluctuation of (a) streamwise velocity, (b) wall-normal velocity, (c) spanwise velocity and (d) temperature along the bottom half-height of the channel, for
 $Ra = 10^7$
and
 $Re_b \approx 5623$
.

Profile of (a) total shear stress, (b) percentage of Reynolds stress to the total shear stress, (c) convective term component
 $\overline{v}^*\partial \overline{u}^*/\partial y^{*}$
and (d) convective term component
 $ \overline{w}^*\partial\overline{u}^*/\partial z^{*}$
along the channel half-height, for
 $Ra = 10^7$
and
 $Re_b \approx 5623$
.

Wall temperature modulation also influences the wall-normal behaviour of momentum flux. Because the mean flow is predominantly in the axial direction for our investigated flow parameters, we plot the distribution of shear stress
 $\tau (y)=\rho \nu {\rm d}\overline {u}/{\rm d}y-\overline {u^{\prime }v^{\prime }}$
in terms of dimensionless function
 $\tau ^* / \tau _w^*$
across the lower-half of the channel height (from
 $y=0$
to
 $y=h$
) in figure 14(a), where
 $\tau _w^*$
is the dimensionless wall shear stress. In figure 14(b), we further show the contribution of Reynolds stress
 $-\overline {u^{\prime *}v^{\prime *}}$
to the total shear stress
 $\tau ^*$
. At a higher frequency of
 $f^* = 1$
, the total shear stress exhibits a nonlinear distribution, whereas at lower frequencies of
 $f^* = 0.1$
and
 $f^* = 0.01$
, it decreases linearly along the channel’s half-height. The linear distribution of
 $\tau ^*/\tau _w^*$
at lower frequencies resembles the shear stress profile observed in a pure turbulent channel without convection. To further explain the deviation from linear total shear stress at higher frequencies, we examine the mean-momentum equation along the streamwise direction within the mixed convection channel:
 \begin{align} \overline {u}^*\frac {\partial \bar {u}^*}{\partial x^*} +\overline {v}^*\frac {\partial \bar {u}^*}{\partial y^*} +\overline {w}^*\frac {\partial \bar {u}^*}{\partial z^*} & =-\frac {\partial \overline {P}^*}{\partial x^*} +\frac {1}{Re_{b}} \left (\frac {\partial ^2\overline {u}^*}{\partial x^{*2}} +\frac {\partial ^2\overline {u}^*}{\partial y^{*2}} +\frac {\partial ^2\overline {u}^*}{\partial z^{*2}}\right )\nonumber \\ & \quad -\left (\frac {\partial \overline {u^{\prime *}u^{\prime *}}}{\partial x^*} +\frac {\partial \overline {u^{\prime *}v^{\prime *}}}{\partial y^*} +\frac {\partial \overline {u^{\prime *}w^{\prime *}}}{\partial z^*}\right ) +\overline {f_b}^* . \end{align}
Here, the terms for
 $\partial (\cdot )/\partial x^*$
and
 $ \partial ^2(\cdot )/\partial x^{*2}$
are near zero in the fully developed region, where velocity statistics no longer vary with the streamwise direction, as confirmed by our DNS results. Due to the detachment of thermal plumes from the wall and their horizontal spreading, the homogeneous condition along the spanwise direction may be violated, making the terms
 $ \partial (\cdot )/\partial z^*$
and
 $ \partial ^2(\cdot )/\partial z^{*2}$
non-zero near the wall. However, we numerically verified (not shown here for simplicity) that the magnitudes of
 $(1/Re_b)\partial ^2\overline {u}^*/\partial z^{*2}$
and
 $\partial \overline {u^{\prime *}w^{\prime *}}/\partial z^*$
are three orders smaller than the other terms, so they can be neglected. Thus, (3.3) can be rewritten as
 \begin{equation} \frac {\partial }{\partial y^*}\left (\frac {1}{Re_b}\frac {\partial \overline {u}^*}{\partial y^*}-\overline {u^{\prime *}v^{\prime *}}\right ) =\overline {v}^*\frac {\partial \overline {u}^*}{\partial y^*}+\overline {w}^*\frac {\partial \overline {u}^*}{\partial z^*}-\overline {f_b}^* \ \ \Rightarrow \ \ \frac {{\rm d}\tau ^*}{{\rm d}y^*}=\overline {v}^*\frac {\partial \overline {u}^*}{\partial y^*}+\overline {w}^*\frac {\partial \overline {u}^*}{\partial z^*}-\overline {f_b}^* .\end{equation}
At a higher frequency of
 $f^* = 1$
, the convection effects are more pronounced for the mean flow, resulting in finite values for the components
 $\overline {v}^*\partial \overline {u}^*/\partial y^*$
and
 $ \overline {w}^*\partial \overline {u}^*/\partial z^*$
, as shown in figures 14(c) and 14(d). At lower frequencies of
 $f^* = 0.1$
and
 $0.01$
, the convection effects are substantially reduced for the mean flow, making
 $ \overline {v}^*\partial \overline {u}^*/\partial y^*$
and
 $\overline {w}^*\partial \overline {u}^*/\partial z^*$
close to zero, restoring conditions similar to those for a pure turbulent channel. This reduced convection for the mean flow is mainly attributed to the formation of a stably stratified layer near the bottom wall, which acts as a thermal blanket, effectively suppressing buoyancy forces.
Profiles of (a,b) flux Richardson number and (c,d) turbulent Prandtl number, along (a,c) the bottom half-channel and (b,d) the top half-channel, respectively, for
 $Ra = 10^7$
and
 $Re_b \approx 5623$
.

We quantify the local relative dynamic importance of buoyancy compared with friction using the flux Richardson number, which is calculated as (Pirozzoli et al. Reference Pirozzoli, Bernardini, Verzicco and Orlandi2017)
 \begin{equation} Ri_f=\frac {-\beta g\overline {\nu ^{\prime }T^{\prime }}}{\overline {u^{\prime }\nu ^{\prime }}{\rm d}\bar {u}/{\rm d}y}. \end{equation}
In figures 15(a) and 15(b), we plot
 $Ri_f$
along the bottom and top halves of the channel height, respectively. Regardless of the wall modulation frequency, the near-wall region (
 $y \leqslant 0.2h$
) is dominated by shear. However, as we move farther away from the wall, convection begins to emerge and eventually dominates in the bulk region. We also quantify the ratio of turbulent momentum to thermal diffusivity via the turbulent Prandtl number
 $Pr_t$
, which is frequently used in modelling turbulent heat transfer. For simple shear flows, the Reynolds analogy suggests that
 $Pr_t$
is of the order of unity (Kays Reference Kays1994). Using DNS results, we can calculate
 $Pr_t$
as
 \begin{equation} Pr_t=\frac {\nu _t}{\alpha _t}=\frac {\overline {u'v'}}{\overline {v'T'}}\frac {{\rm d}\overline {T}/{\rm d}y}{{\rm d}\overline {u}/{\rm d}y}. \end{equation}
Here,
 $\nu _t$
is turbulent viscosity and
 $\alpha _t$
is the thermal eddy diffusivity. On the bottom side (see figure 15
c), at a high frequency of
 $f^* = 1$
and the unmodulated case,
 $Pr_t$
is close to unity in the near-wall region; however, at lower modulation frequencies,
 $Pr_t$
deviates from unity significantly because the temperature is more efficiently transported compared with momentum. On the top side (see figure 15
d),
 $Pr_t$
approximates unity near the wall, yet it exhibits a large variation in the bulk region. These features of the
 $Pr_t$
distribution present challenges in turbulence modelling, where a constant value is often assumed.
3.3. Phase-averaged statistics
Phase-averaged streamwise velocity profiles
 $\langle u^{+}(y^{+})\rangle _\phi$
along the bottom half-height for
 $Ra = 10^7$
and
 $Re_b \approx 5623$
. For the case without wall temperature modulation, we present the long-time-averaged profiles to guide the eye.

Because the wall temperature modulation inherently induces unsteady flow and temperature evolution, we now focus on the phase-averaged statistics. We present the variability of the physical quantities during different phases of the flow cycle and how they are affected by the wall temperature modulation. In the following, we denote with angle brackets
 $ \langle \cdot \rangle$
all quantities that have been phase-averaged. We first calculate the phase-averaged streamwise velocity
 $\langle u^{+}(\mathbf {x})\rangle _\phi$
and plot its profile
 $\langle u^{+}(y^{+})\rangle _\phi = [\int _0^{L}\int _0^{W}\langle u^{+} (\mathbf {x} )\rangle _\phi {\rm d}z{\rm d}x ]/ (LW )$
along the bottom-half of the channel height, as shown in figure 16. At a high frequency of
 $f^* = 1$
, the flow maintains a velocity profile consistent with that under constant wall temperature. However, at a lower frequency of
 $f^* = 0.01$
, the velocity profiles deviate from those without wall temperature modulation, particularly in the near-wall region where the thermal boundary layer causes variations in the velocity gradients. An interesting observation is that during the cooling phase (e.g. at a phase angle of
 $\phi = 5\pi /4, 3\pi /2, 7\pi /4$
), the streamwise velocity near the wall significantly decreases. This occurs because the turbulence intensity near the bottom wall is greatly weakened by the cooling. As a result, the reduced turbulence results in lower surface drag on the fluid above, leading to an acceleration of the flow and a higher plateau away from the wall compared with the constant wall temperature condition. This trend aligns with the dynamics of the nocturnal low-level jet in atmospheric flow. At night, surface cooling creates stable conditions and temperature inversions, which suppress turbulence near the ground. This suppression reduces surface drag and allows for the formation of nocturnal jets characterized by higher wind speeds above the cooled surface layer. Understanding the behaviour of nocturnal jets is crucial for sandstorms, air pollution, wind energy utilization and aviation safety (Liu et al. Reference Liu, He, Wang and Zhang2014).
Space-phase diagrams of turbulent kinetic energy (TKE) along the bottom half-height for
 $Ra = 10^7$
and
 $Re_b \approx 5623$
: (a)
 $f^* = 1$
and (b)
 $f^* = 0.01$
.

The behaviour of velocity distribution can be further understood by studying the phase-averaged TKE as
 $k^+=\langle {u_i^{\prime +}u_i^{\prime +}}\rangle _{\phi }/2$
. Here, the subscript
 $i$
is a dummy index, and the superscript (
 $^\prime$
) denotes the fluctuation part of an instantaneous flow variable. In figure 17, we show the space-phase diagram of turbulence intensities. At a high frequency of
 $f^* = 1$
(see figure 17
a), we can infer that the perturbation is relatively intense in the region
 $10 \leqslant y^+\leqslant 40$
across different phases, and such consistent TKE leads to phase-averaged velocity profiles that are insensitive to phase variations. At a low frequency of
 $f^* = 0.01$
(see figure 17
b), there is phase-dependent variation in TKE diagrams, and turbulence intensity is strengthened and reduced alternately in one cycle. During heating phases, the flow behaves as unstable stratification, and TKE exhibits significant peaks in the range of
 $ y^+ \geqslant 10$
; during cooling phases, the flow behaves similarly to stable stratification, TKE decreases to almost zero and turbulence intensities are suppressed. Such reduced TKE results in lower velocity close to the wall and higher velocity aloft, as previously observed in figure 16. We examine the phase-averaged TKE equation of incompressible mixed convection, which is written as
 \begin{equation} \begin{aligned} \frac {\partial k^+}{\partial t^+} + \langle u_j^+ \rangle _\phi \partial _{j^+} k^+ &= \underbrace {-\langle u_i^{\prime +} u_j^{\prime +} \rangle _\phi \partial _{j^+} \langle u_i^+ \rangle _\phi }_{\langle P \rangle } \\ &\quad \underbrace {- \partial _{j^+}\langle P^{\prime +} u_j^{\prime +} \rangle _\phi }_{\langle \Pi \rangle } \underbrace {- \frac {1}{2}\partial _{j^+} \langle u_i^{\prime +} u_i^{\prime +} u_j^{\prime +} \rangle _\phi }_{\langle T \rangle } + \underbrace {\partial _{j^+}\partial _{j^+} k^+}_{\langle D \rangle } \\ &\quad \underbrace {- \langle (\partial _{j^+} u_i^{\prime +})^2 \rangle _\phi }_{\langle \varepsilon \rangle } + \underbrace {\frac {Ra}{Pr(2Re_\tau )^3}\langle T^{\prime *} v^{\prime +} \rangle _\phi }_{\langle B \rangle }. \end{aligned} \end{equation}
In the above, the terms
 $\langle P \rangle$
and
 $\langle B \rangle$
represent the production by shear and buoyancy, respectively; the terms
 $\langle \Pi \rangle$
,
 $\langle T \rangle$
and
 $\langle D \rangle$
represent turbulent diffusion by pressure–velocity fluctuations, velocity fluctuations and viscous diffusion, respectively; and the term
 $\langle \varepsilon \rangle$
represents dissipation. In figure 18, we show the TKE budgets for
 $Ra = 10^7$
,
 $Re_b \approx 5623$
and
 $f^* = 0.01$
. The shear-induced and buoyancy-induced TKE productions are strongly influenced by the wall temperature modulation in both amplitude and peak position. Specifically, during the heating phase (e.g. at a phase angle of
 $\phi = \pi /4, \pi /2, 3\pi /4$
), the TKE production is dominated by shear in the near-wall region, while it is dominated by buoyancy in the bulk region. During the cooling phase (e.g. at a phase angle of
 $\phi = 5\pi /4, 3\pi /2, 7\pi /4$
), the TKE productions are all near zero along the whole channel height. For other terms of the budget, including the velocity–pressure gradient, the viscous diffusion and the turbulent transport, the in-cycle variation is also evident during the heating phase in the near-wall region but shows minor variation during the cooling phase (see the insets in figure 18).
Phase-averaged TKE budgets along the bottom half-height for
 $Ra = 10^7$
,
 $Re_b \approx 5623$
and
 $f^* = 0.01$
.

We then analyse the phase-averaged temperature
 $ \langle T^* (\mathbf {x} ) \rangle _{\phi }$
, and plot its profile
 $ \langle T^*(y^*)\rangle_\phi = [\int _0^{L}\int _0^{W} \langle T^* (\mathbf {x} ) \rangle _\phi {\rm d}z{\rm d}x ]/ (LW )$
along the bottom half-channel height, as shown in figure 19. At a high frequency of
 $f^* = 1$
, the temperature profiles deviate from those without wall temperature modulation only in the region of
 $y \lt 0.1h$
. Farther away from the wall, the influence of the modulation is limited. At a lower frequency of
 $f^* = 0.01$
, both the near-wall and bulk temperatures are influenced by the modulation. During the heating phase (e.g. at a phase angle of
 $\phi = \pi /4, \pi /2, 3\pi /4$
), the temperature decreases upward in the boundary layer, resulting in an unstably stratified flow. During the cooling phase (e.g. at a phase angle of
 $\phi = 5\pi /4, 3\pi /2, 7\pi /4$
), the temperature increases upward in the boundary layer, forming a statistically stable boundary layer. This stabilization suppresses turbulence and reduces mixing, leading to the formation of a residual layer above the stable boundary layer that retains the thermal stratification from the previous cycle. In meteorology, this residual layer is analogous to the one that retains the adiabatic lapse rate from the previous day, as described by Stull (Reference Stull2015).
Phase-averaged temperature profiles
 $\left\langle T^*(y^*)\right\rangle_\phi$
along the bottom half-channel height for
 $Ra = 10^7$
and
 $Re_b \approx 5623$
.

Heat accumulates within the boundary layer during the heating phase and is lost during the cooling phase, making temperature profiles dependent on the accumulated heating or cooling. In figure 20, we plot the phase-averaged dimensionless heat flux, represented by the Nusselt number at the bottom wall as
 $Nu_{{bottom}}=-\langle \partial T^* / \partial y^* \rangle _{{bottom}, t}$
. Here,
 $\langle \cdots \rangle _{{bottom}, t}$
denotes the ensemble average over the bottom wall and over the time. At a high frequency of
 $f^* = 1$
(see figure 20
a), the phase-averaged
 $Nu_{{bottom}}$
exhibits substantial oscillation amplitude. This occurs because high modulation frequency causes rapid changes in thermal conditions, temporarily enhancing convective heat transfer. However, significant peaks and valleys may require robust control mechanisms to manage these rapid changes without causing fatigue due to thermal stress, thereby adding complexity to the system device components in applied thermal engineering applications. As the modulation frequency decreases (see figures 20
b and 20
c), the oscillation amplitude of
 $Nu_{{bottom}}$
decreases, indicating more stable heat transfer with smaller deviations from the baseline. This is ideal for applications requiring consistent thermal management without significant fluctuations. On the other hand, the long-time-averaged values of Nusselt numbers generally increase as the modulation frequency decreases:
 $Nu$
is 11.58 at
 $f^* = 1$
while
 $Nu$
is 20.36 at
 $f^* = 0.01$
(marked by the dashed lines in figure 20). These results suggest that the average
 $Nu$
might not fully capture the extreme fluctuations, which are critical for predicting and optimizing heat transfer in various engineering applications.
Phase-averaged dimensionless heat flux in terms of Nusselt number at the bottom wall at (a)
 $f^* = 1$
, (b)
 $f^* = 0.1$
and (c)
 $f^* = 0.01$
, for
 $Ra = 10^7$
and
 $Re_b \approx 5623$
. The dashed lines represent long-time-averaged values of
 $Nu$
at various modulation frequencies.

In addition, we observe the asymmetry in the Nusselt number
 $Nu_{{bottom}}$
during the heating and cooling phases at low modulation frequencies. At low frequencies (e.g.
 $f^* = 0.01$
), the system experiences extended periods of heating and cooling, allowing distinct thermal and flow structures to develop in each phase. The fluid’s thermal inertia causes a delayed response in heat transfer: while the heating phase rapidly amplifies convection, the cooling phase is moderated by the residual thermal energy in the fluid. Specifically, during the heating phase, as the bottom wall temperature increases and buoyancy forces enhance, the upward convective currents accelerate rapidly. The increasing temperature gradient thins the thermal boundary layer, reducing thermal resistance and enhancing heat transfer efficiency. As a result,
 $Nu_{{bottom}}$
rises quickly, forming higher but narrower peaks above the average value. During the cooling phase, as the bottom wall temperature decreases and buoyancy forces weaken, the established convective motions persist due to the fluid’s inertia. The decreasing temperature gradient thickens the thermal boundary layer, increasing thermal resistance and slowing down heat transfer. This results in a more gradual reduction in
 $Nu_{{bottom}}$
, producing lower but wider regions below the average value.
Comparison of oscillatory temperature from analytical and numerical solutions, at (a)
 $f^* = 1$
, (b)
 $f^* = 0.1$
and (c)
 $f^* = 0.01$
, for
 $Ra = 10^7$
and
 $Re_b \approx 5623$
. The grey dashed lines show the depth where the oscillating temperature’s amplitude drops to 1 % of its maximum value, and the black dash–dotted lines show the thermal boundary layer thickness.

Finally, we differentiate between the oscillatory flow induced by wall temperature modulation and the fluctuating fields. To that end, we adopt the phase decomposition method, which has been widely applied in the investigation of turbulent flows subjected to periodic forcing, such as channel turbulence or turbulent boundary layers with oscillating walls (Choi Reference Choi2002; Ricco et al. Reference Ricco, Ottonelli, Hasegawa and Quadrio2012; Ebadi et al. Reference Ebadi, White, Pond and Dubief2019), oscillatory or pulsating pipe flows (Manna et al. Reference Manna, Vacca and Verzicco2015; Jelly et al. Reference Jelly, Chin, Illingworth, Monty, Marusic and Ooi2020) and oscillatory thermal turbulence (Wu et al. Reference Wu, Dong, Wang and Zhou2021, Reference Wu, Wang and Zhou2022). The key idea of the phase decomposition method is to split the instantaneous field
 $\mathbb {F}{ (\mathbf {x},t )}$
into the long-time-averaged quantity
 $\overline {\mathbb {F}}(\mathbf {x})$
, the oscillatory quantity
 $ \tilde {\mathbb {F}}{ (\mathbf {x},t_n )}$
and the turbulent fluctuation
 $\mathbb {F}^{\prime }(\mathbf {x},t)$
, which is written as
 \begin{equation} \mathbb {F}(\mathbf {x},t)=\overline {\mathbb {F}}(\mathbf {x})+\overset {\sim }{\operatorname *{\mathbb {F}}}(\mathbf {x},t_n)+\mathbb {F}^{\prime }(\mathbf {x},t) .\end{equation}
Here, the oscillatory quantity is calculated as
 $\widetilde {\mathbb {F}}(\mathbf {x},t_n)= \langle \mathbb {F}(\mathbf {x}) \rangle _\phi -\overline {\mathbb {F}}(\mathbf {x})$
. We divide the oscillating period
 $T_{{period}}$
into
 $M$
evenly spaced intervals, and
 $t_n=(n-1)T_{{period}}/M$
is the time corresponding to the phase angle of
 $\phi _n=2(n-1)\pi /M$
. Previously, Yang et al. (Reference Yang, Chong, Wang, Verzicco, Shishkina and Lohse2020) investigated the thermal Stokes problem in pure RB convection, where the temperature oscillated in modulated pure RB convection. The oscillatory temperature can be obtained analytically as
 $ \tilde {T}(y,t_n)=A{\rm e}^{-y^*/\lambda _s^*}\sin (\phi _n-y^*/\lambda _s^*)$
, with the Stokes thermal boundary layer thickness being
 $\lambda _s^*=\pi ^{-1/2}f^{*-1/2}Ra^{-1/4}Pr^{-1/4}$
. Here, the term
 $A{\rm e}^{-y^*/\lambda _s^*}$
indicates that the effect of the oscillating boundary temperature decays exponentially with distance from the boundary, while the term
 $\sin (\phi _n-y^*/\lambda _s^*)$
indicates a phase lag of
 $y^*/\lambda _s^*$
in the temperature oscillation as we move away from the boundary.
We compare the analytical and numerical solutions of oscillatory temperature in mixed PRB convection, as shown in figure 21. A good agreement is observed at a high frequency of
 $f^* = 1$
(see figure 21
a); however, deviations occur at lower frequencies of
 $f^* = 0.1$
and 0.01 (see figures 21
b and 21
c). These discrepancies may be attributed to two factors. First, the penetration depth of the temperature disturbance induced by the oscillating wall temperature is inversely proportional to the modulation frequency. Consequently, at lower frequencies, the temperature disturbance penetrates deeper into the flow, potentially exceeding the thermal boundary layer thickness. Within the thermal boundary, we can assume a heat conduction profile for the temperature, which aligns with the analytical model (Yang et al. Reference Yang, Chong, Wang, Verzicco, Shishkina and Lohse2020). Outside the thermal boundary, the effects of convection become significant, causing deviations from the analytical predictions. In figure 21, we mark the depth where the oscillating temperature’s amplitude drops to 1 % of its maximum value (approximately equal to 4.6
 $\lambda _s^*$
), as well as the thermal boundary layer thickness (determined from the peak positions of the r.m.s. temperature profile). The results show that at a higher frequency of
 $f^* = 1$
, the oscillating temperature penetration depth is of the same order of magnitude as the thermal boundary layer thickness. However, at a lower frequency of
 $f^* = 0.01$
, the penetration depth is an order of magnitude thicker than the thermal boundary layer thickness.
Moreover, our simulations included an imposed pressure gradient (achieved via an equivalent body force), which introduces mean shear that affects the velocity field throughout the fluid domain, including within the thermal boundary layer. This shear enhances convective transport parallel to the wall, modifying the temperature profile. A critical factor here is the ratio of the thermal diffusion time scale to the convective time scale induced by the mean shear. We denote the thermal diffusion time scale
 $t_{{diff}}$
as the characteristic time it takes for heat to diffuse across the penetration depth
 $\lambda _s$
, with
 $t_{{diff}} \propto \lambda _s^2 / \alpha$
(where
 $\alpha$
is the thermal diffusivity). We also denote the convective time scale
 $t_{{conv}}$
as the characteristic time it takes for fluid particles to be advected by the mean shear across the penetration depth, with
 $t_{{conv}} \propto \lambda _s / U$
(where
 $U$
is the characteristic velocity of the Poiseuille flow near the wall). Comparing these time scales, we have the ratio
 $t_{{diff}} / t_{{conv}}\propto f^{*-1/2}$
. As the modulation frequency
 $f^*$
decreases, the thermal diffusion time scale
 $t_{{diff}}$
becomes larger compared with the convective time scale
 $t_{{conv}}$
, indicating that convection becomes more significant within the penetration depth. This increased significance of convection, driven by the mean shear, contributes to the discrepancies between the analytical and simulation results.
4. Conclusion
In this work, we have performed DNS of mixed convection in turbulent PRB channels with sinusoidal wall temperature modulation. High-frequency wall temperature oscillations resulted in a relatively unchanged flow structure, while low-frequency oscillations caused the flow structures to adapt over time, forming stable stratified layers during the cooling phase. Using the POD method, we identified the most energetic mode as a dominant streamwise unidirectional shear flow. Regardless of modulation frequency, streamwise-oriented large-scale rolls appeared as higher POD modes. Streamwise-oriented rolls were strongly correlated with wall temperature variations at lower frequencies, indicating a significant influence on roll strength. We also tracked the movements of roll centres, showing that large-scale rolls exhibit non-stationary behaviour influenced by the periodic boundary conditions of the computational domain. In addition, vertical convective heat flux analysis revealed counter-gradient heat transfer driven by thermal plumes at high frequencies and by bulk roll dynamics at low frequencies.
We then explored the impact of wall temperature modulation on long-time-averaged statistics of mean flow and temperature. The friction coefficient showed less than a 15 % variation with modulation frequency. In contrast, the Nusselt number increased as the frequency decreased, particularly at higher Rayleigh numbers, with an increase up to 96 %. High-frequency modulation minimally affected the mean profiles of streamwise velocity and temperature. However, lower frequencies increased the velocity near the top wall and decreased it near the bottom wall, and the temperature profile deviated from that of canonical RB convection. Total shear stress varied nonlinearly at high frequencies but linearly at lower frequencies, resembling the behaviour of a pure turbulent channel without convection. This difference arises because high-frequency modulation enhances convective effects near the wall, while lower frequencies reduce these effects by forming a stable stratified layer.
Finally, we analysed phase-averaged statistics to understand variability during different phases of the flow cycle. At high modulation frequency, the phase-averaged streamwise velocity profile remained stable. However, at low frequencies, the velocity decreased near the wall and increased away from it due to weakened turbulence. The TKE profiles were consistently high near the wall at high frequency, but they were lower during the cooling phases at low frequency. The TKE budget analysis revealed that shear dominated TKE production near the wall during heating, while buoyancy dominated in the bulk region; both TKE productions were nearly zero during cooling. High modulation frequency confined temperature deviations to the region near the wall, whereas lower frequency affected temperatures both near the wall and in the bulk region. During heating, temperature decreased upward in the boundary layer, leading to unstable stratification. During cooling, temperature increased upward, creating a stable boundary layer that suppressed turbulence and formed a residual layer. Phase-averaged Nusselt numbers showed substantial oscillation amplitude at high frequency due to rapid thermal changes, while oscillations decreased with lower frequency, leading to more stable and efficient heat transfer.
Overall, our study highlights the complex interplay between wall temperature modulation frequency and flow dynamics in mixed convection, providing insights relevant to meteorology and heat transfer engineering applications. However, we acknowledge that the limited spanwise domain size may inhibit the development of the largest coherent structures and alter the flow morphology compared with larger domains representative of atmospheric flows. Furthermore, the limited range of flow parameters restricts our ability to fully mimic the extreme flow conditions in atmospheric currents. Therefore, caution should be exercised when generalizing these results to larger-scale flows, such as those in the atmospheric boundary layer. Future studies with larger computational domains and higher Rayleigh and Reynolds numbers could provide additional insights into scale-dependent behaviours and further validate the applicability of our conclusions to real-world atmospheric flows.
Supplementary movies
Supplementary movies are available at https://doi.org/10.1017/jfm.2025.22.
Funding
This work was supported by the National Natural Science Foundation of China (NSFC) through grants nos. 12272311, 12125204, 12388101; the Young Elite Scientists Sponsorship Program by CAST (2023QNRC001); and the 111 project of China (project no. B17037).
Declaration of interests
The authors report no conflict of interest.
Appendix A. Cross-validation of solvers against benchmark data
Here, we validate the consistency of results among the benchmark data from Pirozzoli et al. (Reference Pirozzoli, Bernardini, Verzicco and Orlandi2017), our in-house solver based on the LBM and the OpenFOAM solver based on the FVM. As shown in figure 22, we compare flow quantities including the mean profiles of temperature and streamwise velocity, as well as the r.m.s. fluctuations of temperature, streamwise velocity, wall-normal velocity and spanwise velocity along the bottom half-height of the channel. The results demonstrate good agreement between all three datasets, confirming the accuracy and reliability of our simulation results. Furthermore, table 2 provides a detailed quantitative comparison of flow quantities. The numerical comparison shows minimal deviations, with discrepancies remaining within acceptable ranges for turbulent simulations, further reinforcing the consistency of the results.
Quantitative comparison of flow quantities among benchmark, LBM and FVM solvers. The columns from left to right indicate the following: flow database; friction Reynolds number (
 $Re_{\tau }$
); Nusselt number (
 $Nu$
); skin friction coefficient (
 $C_{f}$
); grid number in the streamwise, wall-normal and spanwise directions (
 $N_{x}$
,
 $N_{y}$
,
 $N_{z}$
).

Comparison of data from Pirozzoli et al. (Reference Pirozzoli, Bernardini, Verzicco and Orlandi2017) as benchmark, our in-house code based on LBM and OpenFOAM code based on FVM. Mean profiles of (a) temperature and (b) streamwise velocity, mean-square fluctuation of (c) temperature, (d) streamwise velocity, (e) wall-normal velocity and (f) spanwise velocity along the bottom half-height of the channel for
 $Re_{b} \approx 3162$
,
 $Ra = 10^{7}$
and
 $Pr = 1$
.

Appendix B. Parameter estimation for desert atmospheric currents
We consider typical desert atmospheric conditions, where the characteristic height
 $H$
is approximately 1000 m, representing the atmospheric boundary layer height. For air at a mean temperature
 $T_{{mean}} = 300\,\rm K$
, the thermal expansion coefficient is
 $\beta = 3.36 \times 10^{-3}\,\rm K^-{^1} $
, the kinematic viscosity is
 $\nu =1.57 \times 10^{-5}\,\rm m^2\,\rm s^-{^1}$
and the thermal diffusivity is
 $\alpha = 2.22 \times 10^{-5}\,\rm m^2\,s{^-}{^1}$
. The temperature difference across the atmospheric boundary layer can be
 $\Delta _T \approx 20\,\rm K$
or more. The gravitational acceleration is
 $g = 9.8\rm\ m\,s^-{^2} $
.
-
(i) Modulation amplitude. In desert regions, surface temperatures fluctuate significantly due to strong solar heating during the day and rapid radiative cooling at night, leading to both unstable and stable stratification over 24 hours. To mimic this, we vary the bottom wall temperature as
 $T_{{bottom}} = T_{{hot}} + A (T_{{hot}} - T_{{cold}}) \sin (2\pi ft)$
, representing a sinusoidal variation around
$T_{{hot}} = [(T_{{bottom}})_{min } + (T_{{bottom}})_{max }] / 2$
. Data from moderate-resolution imaging spectroradiometer observations (Sharifnezhadazizi et al. Reference Sharifnezhadazizi, Norouzi, Prakash, Beale and Khanbilvardi2019) indicate that land surface temperatures in the Sahara Desert range between
$(T_{{bottom}})_{min } = 280\,\rm K$
and
$(T_{{bottom}})_{max } = 310\,\rm K$
, suggesting an average bottom wall temperature of
$T_{{hot}} = 295\,\rm K$
. Above the atmospheric boundary layer, diurnal cycles are absent, so the top wall temperature is fixed as
$T_{{top}} = T_{{cold}}$
. Assuming a lapse rate-adjusted temperature at the top boundary, we estimate
$T_{{top}} = T_{{cold}} \approx T_{{hot}} - 6.5\,\rm K\,km^-{^1}$
$\times$
$1\,\rm km\approx 288.5\,\rm K$
. Thus,
$A = [ (T_{{bottom}})_{\max } - T_{{hot}} ] / (T_{{hot}} - T_{{cold}}) \approx 2.3$
, closely matching our chosen value of
$A=2$
.
-
(ii) Modulation frequency. The diurnal frequency associated with the day–night cycle is relatively low. On Earth, a 24-hour diurnal period corresponds to a frequency of approximately
$f_{{diurnal}} = 1 / (24 \times 3600 \ \text {s}) \approx 1.16 \times 10^{-5}\,\rm Hz$
. To relate this to our dimensionless frequency
$f^*$
, we estimate the free-fall time scale as
$t_f=\sqrt {H/(g \beta \Delta _T)} \approx 39\,\rm s$
, yielding a dimensionless diurnal frequency of
$f^* = f_{{diurnal}} t_{f} \approx 4.5 \times 10^{-4}$
. This value is two orders of magnitude smaller than the lower limit of our study (i.e.
$f^* = 0.01$
). Exploring lower frequencies would require significantly more computational resources to ensure the convergence of phase-averaged statistics over extended simulation times. -
(iii) Prandtl number. The Prandtl number characterizes the thermophysical properties of a fluid and is defined as
$Pr=\nu /\alpha$
. It quantifies the ratio of viscous diffusion to thermal diffusivity. For air, we have
$Pr \approx 0.71$
, which closely matches our settings. -
(iv) Rayleigh number. The Rayleigh number characterizes the intensity of convection in a fluid system and is defined as
$Ra=g\beta \Delta _T H^3/(\nu \alpha )$
. It quantifies the balance between buoyancy-driven forces and diffusive transport (viscous and thermal diffusion). For typical desert atmospheric conditions, we have
$Ra \approx 2 \times 10^{18}$
. -
(v) Friction Reynolds number. The friction Reynolds number characterizes turbulent shear near the wall and is defined as
$Re_\tau =u_\tau H/ \nu$
. To estimate the friction velocity
$u_\tau$
, we use the logarithmic wind profile
$U(z)=u_\tau / \kappa \ln (z/z_0)$
, where
$\kappa \approx 0.4$
is the von Kármán constant and
$z_0$
is the roughness length. For desert surfaces, we estimate
$z_0=0.01\,\rm m$
. During sandstorms, wind speeds reach 13.9 m s–1 or higher (i.e. Level 7 on the Beaufort scale, measured at
$z = 10\,\rm m$
), resulting in a friction velocity of
$u_\tau \approx 0.8\,\rm m\,s^-{^1}$
, giving
$Re_\tau \approx 5 \times 10^7$
. -
(vi) Bulk Reynolds number. The bulk Reynolds number represents the ratio of inertial forces to viscous forces in the flow, considering the average motion of the fluid across the entire flow domain, and is defined as
$Re_b=u_b H/\nu$
. Using the logarithmic wind profile, we obtain the mean bulk velocity
$u_b$
as
$ (\int _{z_0}^{H}U(z){\rm d}z)/H \approx u_{\tau }/\kappa [\ln (H)-1-\ln (z_{0}) ] \approx 21\,\rm m\,s^-{^1}$
, leading to
$Re_b \approx 1 \times 10^9$
. The corresponding bulk Richardson number is
$Ri_b=Ra/(Re_b^2 Pr) \sim O(1)$
, suggesting that global buoyancy and shear effects are comparable.


These high Rayleigh and Reynolds numbers align with the expected intense turbulence and large-scale atmospheric motions, indicating an extreme flow condition. There remains a significant gap between current computational capabilities and the requirements for DNS or large-eddy simulation of sheared thermal turbulence under such extreme parameters.