1. INTRODUCTION
A well-conceived problem is thought to be one key to the effective development of a successful design concept. When a problem is poorly conceived, efforts to execute and deploy the project may be in vain. Buxton (Reference Buxton2007) calls this distinction “getting the right design” versus “getting the design right.” For many years, user-centered design has been recognized as an approach that focuses on the needs of end users to guide the design of products, services, and systems (Gould & Lewis, Reference Gould and Lewis1985; Norman & Draper, Reference Norman and Draper1986; Griffin & Hauser, Reference Griffin and Hauser1993). Designers may think of user-centered design as a strategy primarily for creating design requirements. In reality, designers should consider both the problem definition and solution generation simultaneously as they work on a design problem (Cross, Reference Cross2007). The motivation of the teaching methodology in this research is to encourage designers to formulate a more nuanced view of users to ensure that design problems are posed appropriately so that real design needs may be addressed. This view of users focuses on deeply understanding those for whom products are being designed by exploring the underlying motivations of a user, rather than merely “the process of writing the requirements document” (Young, Reference Young2008a, Reference Young2008b). For situations where new design opportunities are sought, this approach may help in uncovering new, latent problems.
User-centered design may also offer benefits for overall design team effectiveness. Researchers who study team effectiveness posit that a clear understanding of a team's goals is critical for effective team performance (Katzenbach & Smith, Reference Katzenbach and Smith1993). By establishing a shared set of team goals, teams “develop direction, momentum, and commitment.” Hey et al. (Reference Hey, Yu and Agogino2008), describes the different paths that design teams can take in developing a shared frame with users. The process of better defining problems and requirements may lead to more thoughtful, shared team goals. In this way, user-centered design approaches may help teams formulate these requirements and goals, thereby helping them perform more effectively.
User-centered design has been incorporated in many university design curricula in product, software, and user interaction design. The focus tends to be on teaching specific user-centered techniques and strategies so that they may be applied to design experiences both in and out of the classroom. The studies conducted in this paper take this approach further by carefully evaluating student use of these techniques to formulate a better understanding of their design process. However, little assessment of user-centered design methods used in design projects exists. This paper examines the role of a user-centered design approach in both design process and outcome in a semester-long, graduate-level course on product design and development, and considers the following questions:
1. Is there a link between the quantity and nature of interactions with users and the design outcome? One approach to measuring user-centered design is through the quantity of interactions between designer and user. These interactions may take various forms, such as surveys, interviews, or observations. It is hypothesized that teams interact more frequently with the user may increase the likelihood that they understand their needs and therefore have a better chance at creating a good product.
2. Is there a link between the quantity and nature of interactions with users and team effectiveness? It is hypothesized that teams who spend more time with users have a more complete understanding of the problem given to them. Teams with a better sense of their requirements may work more effectively together.
3. What is the nature of the relationship between team effectiveness and design outcome? In general, team effectiveness is not necessarily linked to stronger performance outcomes (Katzenbach & Smith, Reference Katzenbach and Smith1993; Hackman, Reference Hackman, Tindell, Heath, Edwards, Posavac, Byrant, Myers, Suarez-Balcazar and Henderson-King1998). However, specific aspects of team effectiveness might play a role in how well a product is assessed by reviewers in the end.
The terms “designer” and “engineer” can have multiple meanings, some of which overlap. For clarity, throughout this paper, the students in the course will also be referred to as designers even though their backgrounds are diverse.
2. BACKGROUND
2.1. Needfinding
At the core of user-centered design is the notion of needfinding, which utilizes various means to determine what it is that users need or desire. For product design projects, “the presence of a genuine need” can be essential to success as it can “provide guidance during the design process and criteria for judging the success or failure” at the end (Faste, Reference Faste1987).
McKim described needfinding four decades ago (Reference McKim1972) as a “qualitative research approach to studying people to identify their unmet needs” in order to “help designers get closer to their end users” (Sheppard et al., Reference Sheppard, Jenison, Agogino, Brereton, Bocciarelli, Dally, Demel, Dym, Evans and Faste1997; Patnaik & Becker, Reference Patnaik and Becker1999). Uncovering the needs of others requires the difficult task of gaining empathy with people. First, designers must accurately perceive and recognize those needs to the best of their abilities (Sanders, Reference Sanders1992). Second, people may or may not express their needs explicitly or accurately. One cannot always trust that what a user says matches with what the user is really thinking or whether the user is aware at all of his or her true inclinations. Designers need to be in tune at all levels while they try to gather relevant information from people. Sanders (1992) talks about the levels of need expression: observable, explicit, tacit, and latent.
• Observable needs can be seen by the research from observations.
• Explicit needs can be expressed verbally by the user.
• Tacit needs are known to the user but cannot be expressed verbally.
• Latent needs are subconscious, possibly unknown and inexpressible by the user.
One of the pioneers of user-centered design recently noted, however, that perhaps many of the products that are created are actually filling “necessary holes” and “essential voids” (Norman, Reference Norman2008). Needfinding is a messy, complex process that if not done carefully, can be a waste of resources but if done properly, can be fruitful for designers.
2.2. User-centered design methods
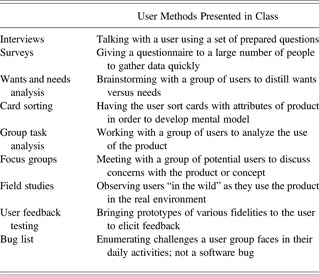
There are a variety of methods to use when interacting with relevant stakeholders for the given product or system (see Table 1; Courage & Baxter, Reference Courage and Baxter2005). For instance, surveys are an expedient way to obtain an aggregate response from many people to discover trends on a subject. It may be difficult, however, to determine the rationale behind a large number of responses to a set of questions. Interviews and observations can provide rich data and insights from spending time with individuals. The resources required, however, can outweigh the potential benefit in these more in-depth methods. Lead users are often used as a representation of the target market because their current strong needs may be a forecasting of future needs for all (von Hippel, Reference von Hippel1986; Urban & von Hippel, Reference Urban and von Hippel1988; Lin & Seepersad, Reference Lin and Seepersad2007). There may be limitations, however, to how representative a small sample of advanced users may be of the full potential user population and to the resources it takes to carefully execute the personal interactions well. Many other methods and protocols exist to guide user-centered design process, whether in industry or in the classroom (Beyer & Holtzblatt, Reference Beyer and Holtzblatt1997; Laurel, Reference Laurel2003; Sanders, Reference Sanders2008; Ulrich & Eppinger, Reference Ulrich and Eppinger2008).
User methods presented in class

2.3. User-centered design applied
Techniques for the identification of customer needs and their translation into functional requirements are widely taught in product design and development curricula (Otto & Wood, Reference Otto and Wood2000; Ulrich & Eppinger, Reference Ulrich and Eppinger2008; Ullman, Reference Ullman2009). Based on the lessons learned from alumni of New Product Development classes at UC Berkeley over several years, Hey et al. (Reference Hey, Pelt, Agogino and Beckman2007) showed that students value the importance of “gathering and analysis of customer and user needs.” Goodman et al. (Reference Goodman, Clarke, Langdon, Clarkson and Stephanidis2007) examined why designers would prefer certain user needs over others. It is important to determine not only whether a method is effective but also why a designer would choose to employ a particular technique. In the software industry, Vrendenburg et al. (Reference Vredenburg, Mao, Smith and Carey2002) considered the practice of user-centered design processes to characterize how methods are used. Yang (Reference Yang2007) surveyed designers and engineers to understand the methodologies they used in practice, and found that the majority of respondents considered needfinding useful.
Although there has been much research in what user-centered design is, its importance, and how practitioners use it, there is little work on measuring the quality and quantity of user analysis and their links to outcome and on team performance.
3. METHODS
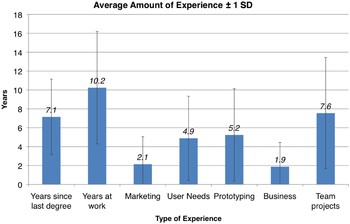
The study undertaken in this research was based on a product design and development class of 72 midcareer professionals as part of their graduate program in Systems Design and Management at MIT. Eighteen teams of three to five students each had one semester to identify an unmet, compelling need and develop a demonstrable prototype of a novel product that addressed this need. Teams were given a budget of $800 to spend on materials and manufacturing. Students had backgrounds in engineering and science and had worked in industry for several years in areas such as defense contracting, military, and software. Figure 1 shows the average time students spent in industry, time since last degree, and years of experience in particular aspects of the product development process.
The average amount of experience for each student. [A color version of this figure can be viewed online at journals.cambridge.org/aie]

Milestones, or “stages,” were set throughout the 3-month semester to simulate deadlines in the real world:
1. Determine potential market/user groups.
2. Select a market/user group.
3. Assess customer and user needs.
4. Propose three concept ideas.
5. Select a concept.
6. Implement the concept and present a business plan.
Lectures covered pertinent information on the product development process, and in particular, instructed students on the basics of user-focused methods described in Table 1. Examples of projects included a reusable container for transporting specialty beverages and tools for improving the home woodworking experience. Several teams have continued to seek patents and further commercial development of their projects beyond the course.
Data from surveys on user interactions, team effectiveness, and reviewer rankings were collected through a combination of forms and surveys administered to the teams and reviewers. The data are described in the following sections. The relationships between data sets were assessed using Spearman correlation for nonparametric populations, because most data were non-Gaussian. These were deemed statistically significant at p < 0.05.
3.1. User interaction reports: Design action
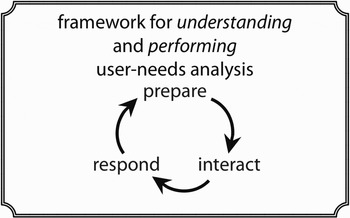
To facilitate and track teams' interactions with users, teams were asked to complete a brief form about each interaction with potential users and customers throughout the semester. An “interaction” was loosely defined as any information-gathering experience with one or more users, such as an interview, survey, or focus group. This form accounted for the number of people interacted with, time spent doing so, and the nature and details of the interaction. These forms draw on Schön's (Reference Schön1983) idea of reflection in action. Practitioners must think about what they are doing to truly learn from their experiences. This framework is composed of a three-stage cycle in Figure 2:
• Prepare (thoughtful action in asking): “What do I want to get out of this interaction?”
• Interact (being in the moment): “How do I best listen to my correspondent(s), both in their actions and speech?”
• Respond (thoughtful reflection): “Now what do I do with this information that I have found?”
The framework for user-needs analysis.

Teams were first asked to prepare before the interaction with the user by stopping and thinking about what they wanted to learn from the interaction. Next, teams were asked to document their interaction. Finally, they summarized their findings from the meeting, whether they wanted to meet with the user again, and how their overall strategy had changed. Teams submitted reports and presented the latest findings at each milestone. The text of the user interaction is the following:
Preparation
• Why did you decide to meet this person or group of people?
• How did you get connected with them?
• How much time and what did you do to prepare for this interaction?
Interaction
• Who did you meet?
• Where did you meet?
• When did you meet?
• How long was the meeting?
• What was the nature of the meeting? Include supplemental materials as needed.
Response
• What is the takeaway message from this interaction?
• Are you planning to meet with them again? Explain.
• Were there any unexpected findings from this interaction?
• How does this affect the decision making process for your team?
3.2. Team effectiveness survey
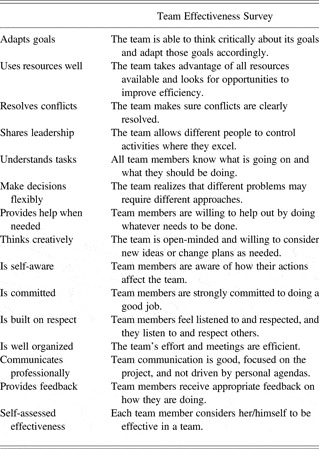
To assess each team's performance, students completed team effectiveness evaluations four times in the semester. A 10-question team effectiveness questionnaire adapted from Alexander (Alexander, Reference Alexander, Goodstein and Pfeiffer1985; Webne-Behrman, Reference Webne-Behrman1998; Distiller & Thatcher, Reference Distiller and Thatcher2002; see Table 2) along with several other questions to assess team performance adapted from a questionnaire developed by Professor David Wallace for a senior capstone design course at MIT. The questionnaire considers both social and task dimensions of teamwork. The aggregate survey results for each team were shared with the team itself with individual identities removed. Teams could then gain a sense of their overall effectiveness as judged by its own members.
Team effectiveness survey

3.3. Reviewer ratings: Design outcome
One standard for assessment of a consumer product is its performance in the marketplace, but this is difficult to evaluate in the context of the academic classroom. Instead, reviewer ratings were used as a proxy for the design outcome.
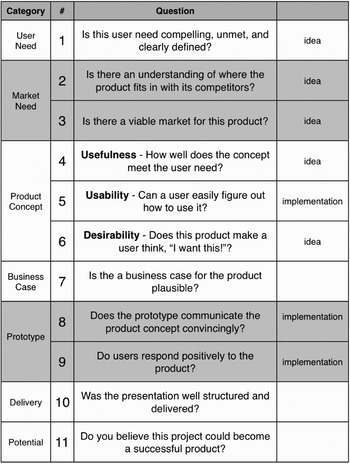
Each project was assessed by an external review panel of six designers and engineers. This review panel consisted of professionals with experience in consumer product and system design. The panel watched 15-min live presentations by each team on their project and gave feedback via a review form (Fig. 3 for short version). Ratings were on a scale of 1 to 5: 1 meant that the reviewer thought not really in response to the question and a 5 indicated absolutely. The presentations included a description of the user need, a demonstration of the product itself, and an assessment of market viability. At the end of the presentations, the top ranked team was awarded $1000. It should be noted that the teams' class grades were dependent on their performance throughout the term, primarily focused on their design process. Thus, the ratings they received by the reviewers were not part of their final semester grades.
The reviewer rating criteria.

Products may be considered from a number of perspectives. The goal was to encourage reviewers to assess the products on a range of qualities, from user need to market and business considerations to its desirability. The review form consisted of questions designed to evaluate the following:
• whether the product concept was anchored in the mandate of the class (products must meet a compelling, unmet need),
• the team's understanding of the potential market and business potential,
• the concept based on Sanders' (Reference Sanders1992) three perspectives on products (useful, usable, desirable),
• how well the teams implemented and executed the prototype based on their concept, and
• the teams' presentation of their work.
4. RESULTS
4.1. User interaction and reviewer ratings
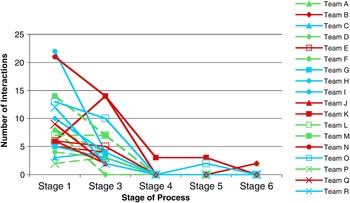
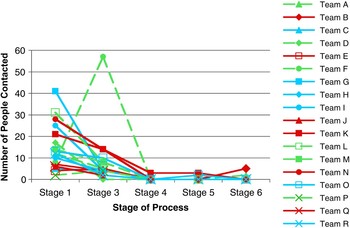
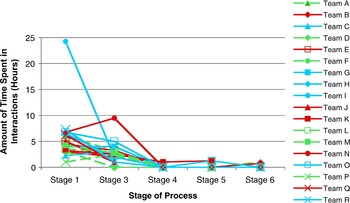
Figures 4–6 show the quantity of user interactions by each team at each stage of the class. Stage 2 is omitted because that milestone was dedicated only to market research. The figures show the number of interactions, people, and the amount of time each team spent in their user interactions over the course of the project. The number of forms submitted represents interactions over time. The number of people represents people over time from each interaction.
The number of interactions (user interaction forms submitted) versus the time (stages of the process). [A color version of this figure can be viewed online at journals.cambridge.org/aie]

The number of people (from all interactions) versus the time (stages of the process). [A color version of this figure can be viewed online at journals.cambridge.org/aie]

The amount of time spent in interactions versus the time (stages of the process). [A color version of this figure can be viewed online at journals.cambridge.org/aie]

In Figures 4–6, the darkest (red, online only) solid lines indicate teams that were in the top third of the reviewer rankings (teams B, E, J, K, N, and Q), the lighter (blue, online only) solid lines indicate teams that were reviewed in the middle third (teams C, G, H, I, O, and R), and the dashed lines denote teams that were reviewed in the bottom third (teams A, D, F, L, M, and P).
It was expected that the proportion of interactions would be highest at the beginning of the project, when teams are starting to identify user groups and needs, and then gradually taper off until a concept is selected. It was also hoped that there would be a slight increase in the amount of user interaction later on as teams tried to get user feedback on their developing prototypes. Figures 4–6 show this is the case, with one exception at the end of stage 2 when no user interaction takes place. At the end of stage 2, teams generated three concepts and would presumably be focused not on users but on coming up with possible product ideas. After stage 2, teams do return to talking with users, possibly to get feedback on their concepts before selecting a final concept to pursue in stage 3.
In Figure 4, it can be seen that one team each of the top and middle thirds (teams I and N) had a noticeably higher (>20) number of interactions with users during stage 1 when compared to the remaining 16 teams who are more closely clustered together (<15 interactions). More notably, in stage 5, the only activity takes place among teams in the top and middle thirds (teams K and O), although there is no activity by teams in the bottom third. These two teams had medium to higher activity earlier in the project. In stage 6, there was activity by both a top third and a bottom third team (teams A and B), although these two teams tended to have a lower number of interactions in the earlier stages of the project.
These figures also show a few outlier teams that illustrate that it can be relatively easy to boost the quantity of user interaction, although not necessarily the quality of it. Figure 5 shows a spike in number of people interacted with during stage 3 for team F. This team surveyed 55 respondents, far more than other teams. Figure 6 shows team I spending almost three times as much time with users as any other team. Three of the interactions for team I were interviews that occurred over the course of series of long meetings that totaled 10 out of 25 h for stage 1 for team I. Patterns similar to those for Figures 4 and 5 were found in Figure 6.
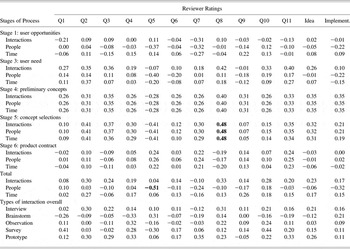
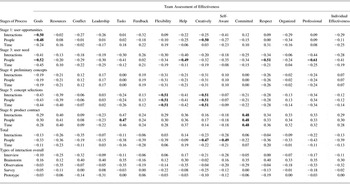
Table 3 shows the Spearman correlations between outcome and user interaction. Reviewers' judgment of teams' prototypes (Q8) had a significant positive correlation (0.48) in stage 5. Only two teams contributed any user interaction reports at this stage, including the second most highly reviewed team. Qualitative analysis for these two teams who spent time going back repeatedly to the same user(s) during the latter stages suggests that perhaps in certain contexts, it may be valuable to establish and maintain a dialogue with user(s) to gain feedback. In other words, the same users who provide context for needs may also provide valuable validation of the design concepts that address those needs.
Correlation between user interaction and outcome

Note: Q1, user need; Q2, competitors; Q3, viability; Q4, usefulness; Q5, usability; Q6, desirability; Q7, business case; Q8, prototype; Q9, user response; Q10, presentation delivery; Q11, potential.
We also observed that many of the correlations are negative (although generally not significantly so), which suggests that more interaction with users tends to correlate with poorer ratings. This unexpected result may suggest a few possible reasons. First, quality rather than quantity of the interaction is important in some situations. Second, any group of users may have widely divergent opinions, which are difficult for design teams to distill into a single framework for a design concept. This effect may be exacerbated by larger numbers of users. Interaction with users appears to play some role, but not a dominating one. Deeper understanding of the data requires a closer look at the details of these interactions.
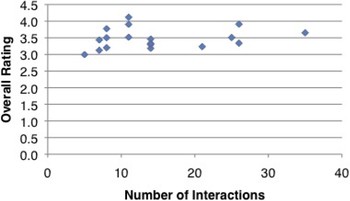
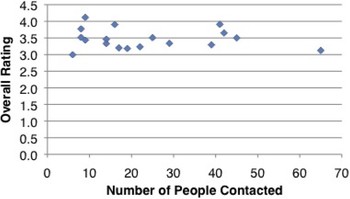
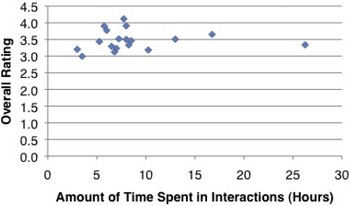
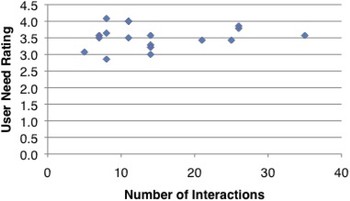
Figures 7–10 plot the measures of design outcome via the average reviewer rating across all questions for a given team against measures of user interaction. In addition, the user need reviewer rating (Q1) is plotted against interactions. On a given figure, each point represents a team. All four figures show that there is no correlation between the quantity of user interaction (interactions, people, time) and the design outcome.
The design outcome (overall rating, scale = 1 to 5) versus the number of interactions (user interaction forms submitted). [A color version of this figure can be viewed online at journals.cambridge.org/aie]

The design outcome (overall rating, scale = 1 to 5) versus the number of people from all interactions. [A color version of this figure can be viewed online at journals.cambridge.org/aie]

The design outcome (overall rating, scale = 1 to 5) versus the amount of time spent in interactions. [A color version of this figure can be viewed online at journals.cambridge.org/aie]

The user need (rating for “does this meet a compelling need?”, scale = 1 to 5) versus the amount of time spent in interactions. [A color version of this figure can be viewed online at journals.cambridge.org/aie]

4.2. User interaction and team effectiveness
Table 4 shows the Spearman correlations between interactions with users and each of the team effectiveness questions. The statistically significant correlations are in bold. In stage 5, there is a significant negative correlation between flexibility in decision making and user interactions. This stage is concurrent with selecting a concept to pursue and may reflect overall team anxiety about making a choice. In stage 6, there is a significant positive correlation with being committed to the team and project. This occurs after the concept is selected, and may indicate that teams have committed to their choices. It is also observed that in Tables 3 and 4 there are significant correlations in the middle to late stages for the relationships between user interaction with outcome and user interaction with team effectiveness. In this particular dataset, this suggests that user interaction at the beginning of a project played less of a role than user interaction later on. At the start of a project, user interaction tends to focus on gathering needs and defining requirements, but at the end of the project the emphasis shifts to user testing and evaluation of concepts. The implication is that the user testing aspect of user-centered design is critical.
Correlation between user interaction and team effectiveness

4.3. Team effectiveness and reviewer ratings
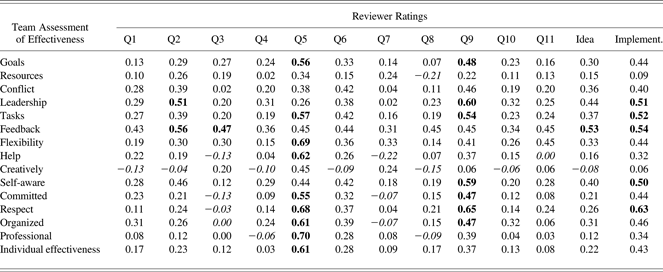
Table 5 shows the Spearman correlations between reviewer ratings with users and each of the team effectiveness questions. The table shows that several measures of team effectiveness have significant correlations with the implementation of the product, but only one, provides feedback, is correlated with generating good quality concepts. A dichotomy between idea and implementation is made to understand the tension that often occurs in the construction of a product. In the early stages, it is important to spend adequate time scoping the problem. Designers must, however, at some point start creating the artifacts to meet deadlines. Fabrication of a design concept can be a more challenging task than designers anticipate because it requires a great deal of integration of physical components. Only teams who work together well will be able to execute well. Note that teams that provide feedback and share leadership tends to understand the market better, suggesting the importance of collaborative teamwork.
Correlation between team effectiveness and outcome
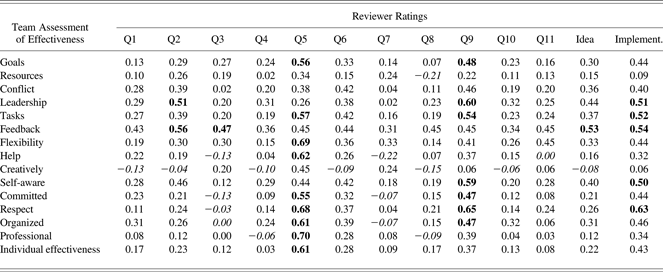
Note: Q1, user need; Q2, competitors; Q3, viability; Q4, usefulness; Q5, usability; Q6, desirability; Q7, business case; Q8, prototype; Q9, user response; Q10, presentation delivery; Q11, potential.
There is a significant correlation between how reviewers perceived usability, “Can a user easily figure out how to use it?,” and many of the team effectiveness categories. Because building skills and expertise were varied across all the teams, the final prototypes were at different levels of finish. A prototype that is more developed is more likely to be perceived as usable. Those teams that were able to reach a critical stage in the development of their prototype perhaps had more team cohesion, as represented by the higher values from the team reviews.
4.4. Reviewer ratings
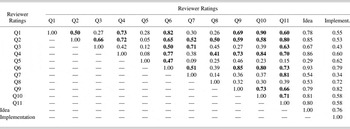
Multiple criteria were used to assess the products, and these criteria ranged from market considerations to product desirability. To better understand if any specific criteria might be a leading predictor of an overall reviewer evaluation, correlations among all the criteria were calculated. Table 6 shows correlation coefficients Rs among each of the review questions listed in Figure 4. Coefficients in bold are statistically significant (p < 0.05). Many correlations were found among the questions. In particular, it can be seen that projects with the highest ratings for desirability (Q6) and an understanding of how they fit in with their competitors (Q2) tend to have higher scores for other questions as well, suggesting that these two aspects were leading indicators of a product's assessment by reviewers. In other words, teams that tended to be rated well on these two questions tended to perform well overall. “Desirability” may be thought of as an underlying, generic user need in the sense that it makes the user “want” the product, but it is not an explicit, specific user need in the traditional sense. An understanding of the competitive landscape is somewhat more relevant to user needs because it demonstrates an understanding of the marketplace and, presumably, how existing products address user needs.
Self-correlation between reviewer ratings

Note: Q1, user need; Q2, competitors; Q3, viability; Q4, usefulness; Q5, usability; Q6, desirability; Q7, business case; Q8, prototype; Q9, user response; Q10, presentation delivery; Q11, potential.
The individual reviewer questions were divided into idea and implementation when applicable. The first relates the quality of the product idea in Q1–4 and Q6. The second category focuses on the implementation of that concept, including the physical embodiment and fit and finish of the final prototype in Q5, Q8, and Q9. The ratings for questions in each of these two categories were averaged, and correlated and listed as idea and implementation in the far right columns and bottom two rows of the table. Projects rated as highly desirable (Q6) were also very highly correlated with both idea (0.93) and implementation (0.79). An understanding where a product fits in with competitors (Q2) also demonstrated strong correlation with idea (0.85), although not with implementation (0.53), and not as high as for Q6. This analysis shows that desirability of a product may be important in how a product is perceived by external reviewers. The way that reviewers see the product may bias the ratings they put down.
The two questions most directly identified with user-centered design were user need (Q1) and usability (Q5). User need (Q1) showed several statistically significant correlations with other reviewer questions. Usability (Q5) showed only one statistically significant correlation. One possible reason for this lack of correlation is that usability is often a quality that is apparent in products that are noticeably more refined than prototypes developed in the class. Given the time and resource constraints of the course, most teams were able to present prototypes that could demonstrate basic functionality typical of a preliminary design rather than a full working prototype with a higher degree of finish. In addition, it is difficult to assess usability without interacting with a functional prototype.
Another possible explanation may be due to the way in which the products were presented to reviewers. The product presentations were generally formulated along the lines of an investor pitch, which may have little to do with the way a product might be used in a real-world application. If the mindset of reviewers is to see the presentations as elevator pitches, the questions dealing with the idea would then be rated better than those questions dealing with implementation.
5. CONCLUSIONS
1. Is there a link between the quantity and nature of interactions with users and reviewer ratings? Results of this study show that more interaction with users does not correlate with better outcome. Sheer quantity of interaction may not be as important as one might think, although quality of interaction might be more important. Findings also suggest that later stage interaction with users may be critical, in particular, getting feedback on specific concepts from the same user(s) over a period of time. By getting feedback from the same users as a design evolves, designers can form a richer understanding of users' needs and validate design directions. In effect, the process can become more of a codesign process in which the user is a more active participant.
2. Is there a link between the quantity and nature of interactions with users and team effectiveness? Interaction with users is linked to flexibility in decision making and commitment to the team only in the middle stages of design. This may be due to the anxiety of selecting a concept and renewed team commitment that occurs after a selection has been made. In this context, user feedback becomes a strategy for validating team decision making.
3. What is the nature of the relationship between team effectiveness and reviewer ratings? Findings suggest that aspects of team effectiveness are linked to the implementation of a concept. This may be because of the way the building of prototypes forces the integration of components and, by extension, the team members who construct those components.
5.1. Limitations
This study has several potential limitations that may affect results. First, all surveys and questionnaires given to design teams relied on self-reporting and assumed that individuals were able to give accurate responses, although in reality, people may under- or overestimate. Second, every effort was made to encourage teams to engage with users in a thoughtful manner to benefit their projects. The risk is that teams would submit user interaction reports simply to fulfill a requirement. However, a review of all the user interaction reports suggest this is not the case, and that teams took their reporting duties seriously. Third, a continuing challenge of design research is a consistent, viable measure of design success. Reviewer ratings are a common, although not perfect approach. Fourth, many of the relationships between datasets were found through correlation, and it is important to recall that this is not the same as causation. Fifth, these findings were based on a classroom design task. Conclusions for real-world design environments should be made with caution as they involved different designers, design goals, and overall contexts.
5.2. Reflections from the researchers
The following is a list of qualitative reflections of this study. It is hoped that these conclusions and reflections can serve as starting points for future research, whether it relates to experimental design or the teaching of user-centered methods in product design and development courses.
5.2.1. Requirements versus real interest
In the classroom, students may view the use of methods as “just another assignment,” regardless of their expertise level. Some students were more worried about the details of the assignment rather than finding an understanding of the tasks given to them. Students may also care only about their grade and not believe that these methods can be useful. Educators should try to structure courses to motivate students to try the methods on their own. If there is no insistence from the instructors, however, then the students might not try the new methods at all.
5.2.2. Methods for design
Students may think that the instructors imply that there is a “right” and “wrong” way to approach designing products and systems for people. The user-centered approach taught in the study is meant for situations where designers want to seek out new opportunities for design and may not have any preconceived notion of the concept they want to pursue. In showing data from studies such as this, students can see that you cannot just blindly follow instructions put forth in class. Methods and procedures can provide a solid first step to the process. They can also see the variety of products and instances in which certain methods will and will not work. The students, however, must be in tune with what they learn along each step of the process and be prepared to adapt.
5.2.3. Documenting and quantifying the process
Although the very documentation of the design process, such as the user interaction forms, may impede progress on the project itself, it is beneficial to have a record of the design activities and decisions. Good record keeping can help teams manage all the information they have gathered. Students and researchers alike can look back on the processes and perhaps see where things may have broken down. What if a team had a good concept early on but ended up choosing a different idea to follow? What if there was something in the implementation of the concept that prevented the prototype from being successful? Maintaining an archive of their work can answer these questions.
6. FUTURE WORK
6.1. Richer data through intercollegiate studies
A number of higher learning institutions teach user-centered design methods in engineering and design courses. Future work should compare and contrast data regarding types of design methods, quality, and quantity of user interaction, team effectiveness, and design outcome measurement with some of these universities to form a more comprehensive view of how to best teach the material. How does product design culture vary at different universities both in the same country and around the world?
6.2. Assessing qualitative aspects of user-centered design
The conclusions in this paper were drawn largely from measurable data, such as ratings, gathered from teams and reviewers. Clearly, the quality of user-centered design practice must play a key role as well. The challenge is gathering such data on a suitable scale while still remaining tractable to analyze. Future work should consider how to thoughtfully assess the qualitative aspects of user-centered design. To what extent can value be placed in subjective, qualitative assessments of designer action, and outcome?
6.3. Partnership with industry
The literature in user-centered design tends to emphasize individual cases in which methods are applied. Future work should formulate a strategy for assessing user-centered methods on a larger, more quantitative scale within the context of industry. Do the experiences in the classroom prepare students at all for what they may encounter in actual practice? What can we do as educators to improve that preparation?
ACKNOWLEDGMENTS
The work described in this paper was partially supported by the National Science Foundation under Award DMI-0547629. The authors thank the King Fahd University of Petroleum and Minerals in Dhahran, Saudi Arabia, for the partial funding of the research reported in this paper through the Center for Clean Water and Clean Energy at MIT and King Fahd University of Petroleum and Minerals. This work also received partial support from an A. Neil Pappalardo Fellowship. The opinions, findings, conclusions, and recommendations expressed are those of the authors and do not necessarily reflect the views of the sponsors.
Justin Lai is a PhD student in the Department of Mechanical Engineering at MIT. His research interests are on how people design products, focusing on aspects related to user needs and creativity. He has taught and coordinated various design related classes and programs for students in the MIT community, hoping to inspire students to think about and practice design in the context of their immediate surroundings.
Tomonori Honda is a Postdoctoral Associate in the Department of Mechanical Engineering at MIT. He received his PhD and MS in mechanical engineering from the California Institute of Technology under an Edward E. Zukoski Fellowship. Dr. Honda's doctoral research proposed a new approach to the design of systems known as grayscale reliability to quantify partial system failures. In addition, he has conducted research in formal engineering design methods including the synthesis of a truss design, the automation of design rationale capture, and the design optimization of a decentralized design environment.
Maria Yang is the Robert N. Noyce Career Development Assistant Professor of mechanical engineering and engineering systems. She earned her BS in mechanical engineering from MIT and her MS and PhD from Stanford University's Department of Mechanical Engineering. She is the 2006 recipient of an NSF Faculty Early Career Development (CAREER) award. Her industrial experience includes serving as the Director of Design at Reactivity, a Silicon Valley software company that is now part of Cisco Systems. Dr. Yang's research interest is in the process of designing products and systems, particularly in the early phases of the design cycle. Her recent work explores various forms of design information in representing the design process and their role in design outcome.