INTRODUCTION
Major depressive disorder (MDD) is a common and disabling illness with serious consequences for personal and public life (Murray & Lopez, Reference Murray and Lopez1997). In many individuals it may take a chronic course, characterized by remissions and recurrences (Keller et al. Reference Keller, Shapiro, Lavori and Wolfe1982, Reference Keller, Lavori, Mueller, Endicott, Coryell, Hirschfeld and Shea1992; Maj et al. Reference Maj, Veltro, Pirozzi, Lobrace and Magliano1992; Mueller et al. Reference Mueller, Keller, Leon, Solomon, Shea, Coryell and Endicott1996, Reference Mueller, Leon, Keller, Solomon, Endicott, Coryell, Warshaw and Maser1999; Solomon et al. Reference Solomon, Keller, Leon, Mueller, Shea, Warshaw, Maser, Coryell and Endicott1997; de Graaf et al. Reference de Graaf, Bijl, Ravelli, Smit and Vollebergh2002; Spijker et al. Reference Spijker, de Graaf, Bijl, Beekman, Ormel and Nolen2002, Reference Spijker, de Graaf, Bijl, Beekman, Ormel and Nolen2004).
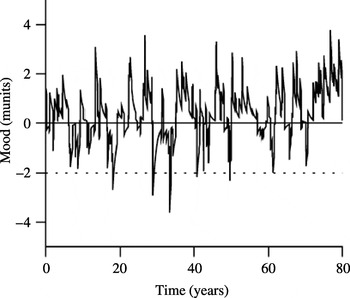
We have shown (van der Werf et al. Reference van der Werf, Kaptein, de Jonge, Spijker, de Graaf and Korf2006) that the time course of MDD may be modelled in terms of a random-mood model. In brief, mood is measured on a linear scale. The units need not be specified but for convenience we refer to them as munits. Mood is assumed to result as a response to stressor signals, which are as yet left unspecified but may be viewed as life events. These stressor signals, or stimuli, occur randomly in time. They can be either positive or negative and their magnitudes are random. Each individual has a different sensitivity to mood stimuli that is reflected in the model's susceptibility parameter, Z, which determines how strongly mood follows the imposed stimulus pattern. Between stimuli, mood is assumed to tend exponentially to zero with a relaxation time, T, which determines how long afterwards the stimulus is felt and how slowly or rapidly it dies out. Aside from this intermittent pattern of stimuli, there are daily mood fluctuations that do not change the essential features of the model. Fig. 1 presents an impression of mood fluctuations as they might occur over a typical lifespan of 80 years. An MDD episode is taken as the time that mood stays below an adopted depression level (broken line in the figure), provided that, in line with the DSM inclusion criteria (APA, 1987), that time is at least 2 weeks.
Mood curve, generated with the random-mood model, as it could be for an arbitrary individual from the general population. The parameters are those for the full NEMESIS cohort: D=120 days, <T>=365 days, Z=1, and depression line=−2 munits (broken line).

There has been a tendency over the past decade to interpret individual self-recorded mood sequences in terms of chaos theory, which would suggest that the time development of mood might be deterministic (Gottschalk et al. Reference Gottschalk, Bauer and Whybrow1995, Reference Gottschalk, Bauer and Whybrow1998; Heiby et al. Reference Heiby, Pagano, Blaine, Nelson and Heath2003). The random-mood model takes an opposite point of view and has been shown to be capable of reproducing the same mood-sequence characteristics (van der Werf et al. Reference van der Werf, Kaptein, de Jonge, Spijker, de Graaf and Korf2006). Its parameters, Z and T, may be looked upon as characteristic of individual subjects or groups of subjects.
In the present work we attempt to adapt the random-mood model as a tool of analysis and address the following questions:
(1) Does this model also work for subgroups, defined along the lines of several known determinants for depression?
(2) Is it possible to relate the model's parameters, Z and T, to quantities that are easily identified in daily life and/or in clinical practice?
(3) How do contrasting subgroups differ in their values for these parameters?
The data studied are newly originated MDD episodes in a random sample of the Dutch population from the Netherlands Mental Health Survey and Incidence Study (NEMESIS; de Graaf et al. Reference de Graaf, Bijl, Ravelli, Smit and Vollebergh2002; Spijker et al. Reference Spijker, de Graaf, Bijl, Beekman, Ormel and Nolen2002, Reference Spijker, de Graaf, Bijl, Beekman, Ormel and Nolen2004). Within the follow-up time of 2 years, about 80% of these subjects recover, their depressive fraction decreasing exponentially with a mean duration of approximately 4 months. After the initial 4 months, the full cohort's recovery rate slows down drastically (see also Keller et al. Reference Keller, Lavori, Mueller, Endicott, Coryell, Hirschfeld and Shea1992). In our data, this later recovery rate was slow enough to make it practical to model the long-lasting fraction (≈20%) as constant over the follow-up time. Without suggesting that these subjects could never recover, we call this for ease of reference the chronic fraction.
We examined subgroups based on several known determinants or risk factors, such as co-morbidity with other psychiatric and somatic disorders (Keitner et al. Reference Keitner, Ryan, Miller, Kohn and Epstein1991; Angst, Reference Angst1996; Swindle et al. Reference Swindle, Cronkite and Moos1998; de Graaf et al. Reference de Graaf, Bijl, Ravelli, Smit and Vollebergh2002; Iosifescu et al. Reference Iosifescu, Bankier and Fava2004; Spijker et al. Reference Spijker, de Graaf, Bijl, Beekman, Ormel and Nolen2004), severity of index depression (Katon et al. Reference Katon, Lin, Von Korff, Bush, Walker, Simon and Robinson1994; Swindle et al. Reference Swindle, Cronkite and Moos1998; Spijker et al. Reference Spijker, de Graaf, Bijl, Beekman, Ormel and Nolen2002, Reference Spijker, de Graaf, Bijl, Beekman, Ormel and Nolen2004), gender (Sargeant et al. Reference Sargeant, Bruce, Florio and Weissman1990; Benazzi, Reference Benazzi1999; de Graaf et al. Reference de Graaf, Bijl, Ravelli, Smit and Vollebergh2002; Spijker et al. Reference Spijker, de Graaf, Bijl, Beekman, Ormel and Nolen2004) and history of depression (Keller et al. Reference Keller, Shapiro, Lavori and Wolfe1982; Maj et al. Reference Maj, Veltro, Pirozzi, Lobrace and Magliano1992; Solomon et al. Reference Solomon, Keller, Leon, Mueller, Shea, Warshaw, Maser, Coryell and Endicott1997; Mueller et al. Reference Mueller, Leon, Keller, Solomon, Endicott, Coryell, Warshaw and Maser1999).
In this work we establish a method by which the random-mood parameters, Z and T, can be evaluated for different risk factor-based subcohorts. The data are organized as survival curves: the percentage of persisting MDDs in a cohort plotted versus the time elapsed since their onset. We show that survival curves of the more homogeneous risk factor-based subgroups are adequately modelled as an exponentially decaying fraction plus a constant rest group, similar to the full cohort.
The adopted procedure is then used to calibrate simulated random-mood survival curves against exponential decay and to establish their dependence on Z and T.
The results show that: (1) Z may be identified with a risk ratio of the depressed cohort and the general population; and (2) the mean duration of an MDD episode is, apart from a constant, found as the product of Z and T. This Z–T analysis is compared with commonly used tools such as the log rank test and the hazard ratio, and conclusions regarding our current understanding of MDD are discussed.
METHOD
Description of the cohort and subgroups
The data are from NEMESIS (Spijker et al. Reference Spijker, de Graaf, Bijl, Beekman, Ormel and Nolen2002), a prospective psychiatric epidemiological study in the Dutch adult population (7076 subjects, age 18–64 years) conducted in three waves, 1996 (T0), 1997 (T1) and 1999 (T2). From each selected household, one (non-depressive) respondent was chosen randomly; 4796 respondents were examined at all three waves with the Composite International Diagnostic Interview version 1.1 (Smeets & Dingemans, Reference Smeets and Dingemans1993). DSM-III-R (APA, 1987) was used for psychiatric diagnoses. New episodes of major depression (first or recurrent) were found in 273 subjects. Inclusion criteria were: diagnosis of an MDD episode between T1 and T2 but no diagnosis of 1-month prevalence between T0 and T1. Only first MDD episodes between waves 2 and 3 were used, excluding bipolar disorder and primary psychotic disorder. Using the Life Chart Instrument (LCI; Lyketsos et al. Reference Lyketsos, Nestadt, Cwi, Heithoff and Eaton1994), the duration of major depressive episodes was assessed retrospectively in 250 subjects and discretized into 1·5-month intervals. Recovery was defined as no or minimal depressive symptoms in 3 months.
In the present work we studied subgroups for six variables: severity of depression, defined as mild or moderate versus severe based on DSM-III-R criteria; co-morbid anxiety disorder, defined as having had any DSM-III-R anxiety disorder between T1 and T2; co-morbid dysthymia, defined as having had DSM-III-R dysthymia between T1 and T2; somatic co-morbidity, defined as the presence of one or more conditions from a list of 31 somatic disorders for which the subject was treated or monitored by a doctor in the last year before wave 1; history of depression, defined as first versus recurrent episodes; and gender.
Details on the random-mood model, survival analysis and significance tests are provided in the Appendix.
RESULTS
Relationship between exponential decay and the random-mood model
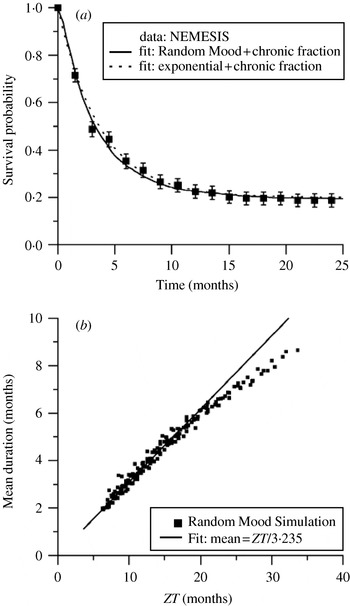
Fig. 2(a) shows the survival data for the full NEMESIS cohort, compared with exponential decay and a random-mood curve, both in combination with a 20% chronic fraction. The random-mood parameters in this calculation are (van der Werf et al. Reference van der Werf, Kaptein, de Jonge, Spijker, de Graaf and Korf2006): (1) mean time lapse between successive stimuli, D=120 days; (2) depression level=−2 munits; (3) Z=1; and (4) T=365 days, the mean of the Poisson distribution, from which relaxation times are taken. Z and T are obviously individual or group characteristics. To investigate how these influence the mean duration of an MDD, we ran the random-mood program on a grid of Z–T values to produce high-statistics simulated survival curves. D was kept at 120 days and the depression level at −2 munits, thus keeping the stressor pattern unchanged. The resulting curves were subject to a fit with single exponential decay to determine the decay time, τ, which at the same time is the mean duration.
(a) Survival curve of the full NEMESIS cohort, compared with an exponential decay fit (broken line) and with the random-mood model (solid line), both for an 80% recoverable fraction. The 20% long-term fraction, F, has been modelled as constant. The random-mood parameters are those for the general population and are the same as in Fig. 1. (b) Decay times obtained from random-mood simulated survival curves (vertical) plotted versus the product ZT. The solid line indicates the empirical scaling rule A.

Based on the near-exponential form of the random-mood curves, an approximate empirical scaling is found, as illustrated in Fig. 2(b), where mean duration has been plotted versus the product ZT. The points cluster around a straight line, at least for τ⩽6 months. As the duration is no longer for any of the subgroups, we have:
Scaling rule A: The decay time, τ, is proportional to the product ZT
For the full cohort, ZT=12 months and the decay time is τ=3·71 months. This fixes the proportionality constant:

which corresponds to the solid line in Fig. 2(b).
Another empirical scaling is observed:
Scaling rule B: Incidence (depressions/year/person) is proportional to Z, independent of T
A simple example illustrates how Z is determined by use of this scaling rule: in the general population, the numbers of men and women are about equal and the probability that a randomly picked individual will be a man or a woman is approximately one-half for both. In the depressed cohort, however, the number of women is about twice that for men. Evidently, the probability that a randomly picked subject, known to be depressed, will be a man is P(manD)≈1/3 and the probability of being a woman, P(womanD)≈2/3. The average susceptibility of the general population can be defined as Z≡1. It follows that Z(man)≈(1/3)/(1/2)=2/3 and Z(woman)≈(2/3)/(1/2)=4/3. This identifies Z as the risk ratio (RR), or likelihood ratio, for identifying an individual as belonging to a certain determinant-defined subgroup, when comparing a depressed cohort with the general population.
The same procedure can be followed for other determinants. In this work we evaluate Z as the ratio for the depressed NEMESIS cohort (n=250, recoverable cases only) and wave 1 (n=7076) of the same study.
The above man/woman example discloses a small ambiguity: the mean susceptibility of the full depressive cohort would be 〈Z〉=(1/3)(2/3)+(2/3)(4/3)=10/9=1·11, rather than Z=1, with which it was analysed. This is not surprising, as the mean susceptibility of a depressed cohort may be expected to be larger than that of the general population. By scaling rule A, the identical mean duration is then obtained by adopting T=(9/10)12=10·8 months. In practice, depending on the bipartition that is chosen, 〈Z〉 will always be slightly larger than 1, with statistical spread due to the finiteness of the sample.
For some determinants it is impossible to give a priori probabilities. An example is severe/non-severe, a distinction that can only be made when the depression already exists. Instead of dropping the analysis altogether, we prefer to proceed on a working assumption, for which we adopt Bayes' postulate of equal a priori probabilities (see, for example, Stuart & Ord, Reference Stuart and Ord1991). In the particular case of severe/non-severe, this means taking both as 50%. In summary, we have made the important identification:

Once Z is known, T is obtained by using scaling rule A and equation (1). Hence, these two scaling rules allow for separate estimates of Z and T, which are found to be group-typical parameters.
Parametric fits of subgroup survival functions
The survival function is taken as a two-parameter form that assumes a chronic fraction F and a reversible part (1 – F), with mean duration τ.

This may be considered as a limiting case of a double-exponential form, where the second decay time is long enough to make the last term almost constant over the follow-up time. In this form it is similar to multi-exponential forms as used by Von Korff & Parker (Reference Von Korff and Parker1980) and Patten (Reference Patten2002). Modelling the long-term depressive fraction as constant reduces the number of adjustable parameters to just the mean duration, τ, of the recoverable fraction and the size of the chronic fraction, F. Fitting is done by maximizing the likelihood function, which we take in the form as used by Kaplan & Meier (Reference Kaplan and Meier1958).
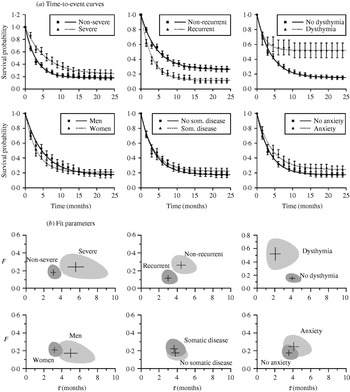
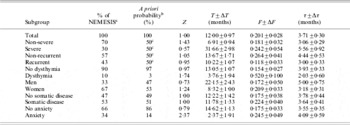
Survival curves for the different subgroups are shown in Fig. 3 (a), along with their fits. The fit parameters and their standard deviations are given in Table 1, along with the random-mood parameters, Z and T, that follow from scaling rules A and B.
(a) Survival curves for contrasted risk factor-defined subgroups. (b) 95% confidence contours (CCs) on the fit parameters of the contrasted groups. τ is the mean duration for the reversible fraction (1−F) and F is the chronic fraction. Crosses indicate standard deviations on the individual parameters τ and F.

Parametric analysis of the NEMESIS data and subgroups

NEMESIS, The Netherlands Mental Health Survey and Incidence Study; Z, susceptibility (random-mood parameter), obtained from scaling rule B; T, relaxation time (random-mood parameter), obtained from scaling rule A; F, long-lasting (chronic) fraction; τ, mean duration for recoverable fraction.
a Percentage of depressive NEMESIS cohort (n=250).
b A priori probability among the general population, estimated from wave 1 (n=7076).
c Assuming Bayes' hypothesis of equal a priori probabilities.
Fig. 3(b) shows a two-by-two comparison of the 95% confidence contours (CCs) for the subgroups that are being contrasted, drawn in the plane of τ and F. From a visual inspection of their distances and the lack of overlap of their CCs, significance is immediately apparent for the risk factors severity, recurrence and dysthymia.
Survey of the significance tests
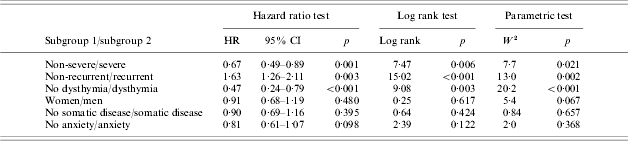
Various methods exist for testing the null hypothesis, that two different survival curves might result from a common underlying mechanism. Two commonly used statistics are the log rank test and the hazard ratio (HR), which is the output of a univariate Cox regression. Both log rank and HR are χ2 (df=1) statistics. In addition, we use a parametric test, based on the differences in the fit parameters τ and F. This statistic, which we denote as W 2, is judged against a χ2 (df=2) distribution. Its precise definition, along with a brief description of log rank and HR, is given in the Appendix.
The results for these three test statistics are listed in Table 2. All three tests indicate that the probability for the null hypothesis to be true is outside the 95% confidence interval (CI) for the following cases: (1) non-severe/severe, (2) non-recurrent/recurrent and (3) dysthymia/no dysthymia. For the women/men subgroups the HR and the log rank are well within the 95% CI, but the parametric W 2 test is close to the limit. All methods agree that the difference between somatic disease/no somatic disease is small enough to make the null hypothesis probable even inside the 63% CI. No anxiety/anxiety is within the 95% CI for all three criteria.
Significance tests for contrasted subcohorts

HR, Hazard ratio; CI, confidence interval.
Log rank test: Mantel–Cox form (df=1). Parametric test: W 2 is a χ2 (df=2) statistic. See Appendix.
Z–T classification of risk factors
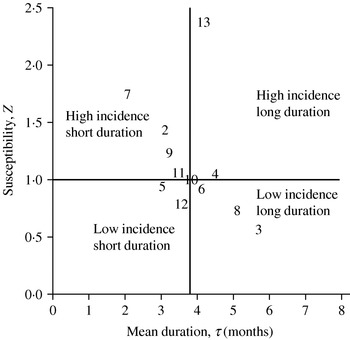
Figure 4 shows a plot of Z versus τ. On the basis of the three criteria, log rank, HR and W 2, the difference was found to be not or hardly significant for men/women, no somatic disease/somatic disease and no anxiety/anxiety. These criteria judge the difference between subgroups by the shape of their survival curves alone. When taking into account differences in incidence between the subgroups, as in the Z–T classification, very marked differences are evident; depressions in women are classified as high incidence/short duration, while in men they are of low incidence/long duration. The subgroups no anxiety and anxiety have almost identical duration, but the incidence among subjects with co-morbid anxiety is more than two times the average of the general population and three times higher than for subjects without anxiety. For the subgroups with co-morbid somatic disease/no somatic disease, the Z–T classification reveals no significant difference.
Classification by susceptibility, Z, and mean duration, τ. The numbers correspond to the subgroups shown in Tables 1 and 2: (1) total, (2) non-severe, (3) severe, (4) non-recurrent, (5) recurrent, (6) no dysthymia, (7) dysthymia, (8) men, (9) women, (10) no somatic disease, (11) somatic disease, (12) no anxiety, (13) anxiety.

DISCUSSION
The present work has demonstrated that survival curves for all subcohorts can be described by a chronic fraction, F, of typically 10–30%, and a reversible fraction (1 – F) that decays exponentially, its mean duration varying between 2·0 months (dysthymia) and 5·5 months (severe depression). We have established two empirical scaling rules, through which the exponential decay time can be connected to the random-mood model and by which its parameters Z, susceptibility, and T, relaxation time, can be determined separately. Hence the random-mood model is found to work for all subcohorts, and each of them is characterized by its own group average values of Z and T.
We have attempted to differentiate between the subgroups in three different ways: (1) by the conventional log rank and HR test; (2) by differences in parametric fits, embodied in our W 2 statistic and visual inspection of the 95% CCs [Fig. 3(b)]; and (3) by the Z–T classification, which concentrates on the non-chronic fraction and uses relative incidence as an additional tool. This Z–T classification appears to have a definite added value and brings out pronounced differences in men/women and anxiety/no anxiety, which the more conventional criteria do not or hardly detect.
In the following sections we survey the current understanding of the three characteristics, chronicity, duration and incidence, for the different risk factors.
Severe/non-severe depression
All three test statistics judge the difference between these subgroups significant outside the 95% CI. The mean duration for the severe cases is much longer than for the non-severe cases: 5·56 v. 3·06 months. In addition, the risk that the depression will become long-lasting is larger in severe depressions. The random-mood Z–T classification finds that severe depressions are of long duration and non-severe depressions of short duration. As severity is measured by the number of symptoms at baseline, these outcomes are entirely as expected and in agreement with existing literature (Katon et al. Reference Katon, Lin, Von Korff, Bush, Walker, Simon and Robinson1994; Swindle et al. Reference Swindle, Cronkite and Moos1998; Spijker et al. Reference Spijker, de Graaf, Bijl, Beekman, Ormel and Nolen2002, Reference Spijker, de Graaf, Bijl, Beekman, Ormel and Nolen2004; Barkow et al. Reference Barkow, Maier, Üstün, Gänsicke, Wittchen and Heun2003).
Recurrent/non-recurrent depression
The difference between the survival curves of these groups is found outside the 95% CI for all three test statistics. Recurrent depressions have shorter duration than first depressions, 3·00 v. 4·44 months, while the probability of developing into a long-lasting depression is also smaller. It is not intuitively evident why recurrent depressions should be shorter than non-recurrent ones. Ormel et al. (Reference Ormel, Oldehinkel and Brilman2001) have suggested that such depressions could be due to general vulnerability. In the language of the random-mood model, this would suggest that the subject has high susceptibility and that consequently the stressors must have short relaxation times. We have based our Z–T classification on Bayes' postulate of equal a priori probabilities, resulting in the near-average values Z=0·95 and T=10·22 months. Considering, however, that scaling rule A determines only their product, high susceptibility combined with short relaxation time is indeed a valid scenario.
No dysthymia/dysthymia
At only 10% of the total cohort, the dysthymia subgroup has a very different signature: the chronic fraction is large (52%), but for the recoverable part, the duration is short (2·03 months). All three test statistics indicate that the survival curves are significantly different beyond the 95% CI. In terms of the Z–T classification, the recoverable part of the dysthymia group is characterized as of high susceptibility and short duration. Dysthymia is a prolonged state of low baseline mood, in which it meets a minimum number of inclusion criteria (APA, 1987) that are in common with those for MDD, but fewer in number. When the number of inclusion symptoms increases temporarily to above the diagnostics level of MDD, the dysthymic subject is said to have a double depression. This is the situation we are considering here. In a random-mood interpretation, dysthymia might be characterized as a state of reduced distance between baseline mood and depression level, which might then be triggered by small-amplitude stimuli. This hypothesis provides a natural explanation for the high susceptibility found in our Z–T classification (Table 1, Fig. 4). It does not, however, without further assumptions, explain the very short duration of the recoverable depressive episodes (only 2·03 months). This short duration suggests that the stimuli themselves should have a reduced relaxation time, T. Both aspects might be explained by a ‘selective response’ scenario: a dysthymia patient might have (very) long relaxation times for strong negative stimuli, causing these to pile up to a negative level, which is, however, still subthreshold for MDD. For small negative stimuli the patient might then show ‘normal’ responses. In addition, impairment between coping with positive and negative daily events, one of the inclusion criteria for dysthymia, may further lower the baseline mood level.
Women/men
No major differences in survival curves for men and women are found by the HR and log rank tests. The parametric W 2 statistic is, however, at the edge the 95% CI. The difference between men and women is even more evident from the Z–T classification: about two-thirds of the full cohort are women and one-third are men. This translates into a two-times higher susceptibility for women. Although the difference between men and women in their risk of becoming depressed is generally known, some studies find no significant difference in duration and chronicity (Eaton et al. Reference Eaton, Anthony, Gallo, Cai, Tien, Romanoski, Lyketsos and Chen1997; Simpson et al. Reference Simpson, Nee and Endicott1997; Spijker et al. Reference Spijker, de Graaf, Bijl, Beekman, Ormel and Nolen2002, Reference Spijker, de Graaf, Bijl, Beekman, Ormel and Nolen2004) while others do (Sargeant et al. Reference Sargeant, Bruce, Florio and Weissman1990). In hospitalized subjects, chronicity has been observed to be more frequent in women than in men (Keitner et al. Reference Keitner, Ryan, Miller, Kohn and Epstein1991). In our study we found only a slightly higher chronic fraction for women. However, the mean duration for the recovering cases is very different: 3·18 months for women versus 5·00 months for men. This is the more remarkable because the fraction of women with severe depression characteristics at baseline is 34% compared with only 23% for men [odds ratio (OR) 1·70, p=0·051]. Oldehinkel et al. (Reference Oldehinkel, Ormel and Neeleman2000) suggested that women, once depressed, are better at putting positive life changes into effect and thus are better able than men to overcome depression. In our cohort, the percentage of women with co-morbid anxiety disorder was significantly higher than for men: 39% v. 23% (OR 2·15, p=0·004). Recurrence was also found more frequently in women than in men (46% v. 36%, OR 1·50, p=0·094), unlike the results of the study by Eaton et al. (Reference Eaton, Anthony, Gallo, Cai, Tien, Romanoski, Lyketsos and Chen1997), who found no difference in recurrence.
No somatic disease/somatic disease
None of the three test statistics indicate a significant difference between the two survival curves. Neither does the Z–T classification. This is not surprising because, for the most prevalent diseases included in the criterion list (hypertension, sinusitis, back pain and asthma), their possible association with depression has not been demonstrated. Diseases that are known risk factors (Evans et al. Reference Evans, Charney, Lewis, Golden, Gorman, Krishnan, Nemeroff, Bremner, Carney, Coyne, Delong, Frasure-Smith, Glassman, Gold, Grant, Gwyther, Ironson, Johnson, Kanner, Katon, Kaufmann, Keefe, Ketter, Laughren, Leserman, Lyketsos, McDonald, McEwen, Miller, Musselman, O'Connor, Petitto, Pollock, Robinson, Roose, Rowland, Sheline, Sheps, Simon, Spiegel, Stunkard, Sunderland, Tibbits and Valvo2005), such as cardiovascular disease, diabetes mellitus, AIDS/HIV, cancer and rheumatoid arthritis, account for less then 20% of the prevalence in the present subcohort. Even when assuming a 50% increase in duration in such cases, the net effect on the full subcohort will only be some 10%. This is in line with the observed 7% higher median duration of 3·76±0·54 months for the diseased group versus 3·52±0·49 months for the non-diseased subcohort and the 30% higher long-duration (chronic) fraction of 0·224±0·040 as compared to 0·175±0·038.
No anxiety/anxiety
The survival curves for no anxiety/anxiety do not differ significantly as judged by the log rank and HR criteria and by the W 2 test. The Z–T classification, however, reveals a remarkable difference: anxiety is associated with a very high susceptibility for becoming depressed, by far the highest of all the risk factors investigated in this study. Several studies (Wittchen et al. Reference Wittchen, Beesdo, Bittner and Goodwin2003; Spijker et al. Reference Spijker, de Graaf, Bijl, Beekman, Ormel and Nolen2004) have reported a negative effect of anxiety on the course of depression. Our investigation confirms this: we find that anxiety is more likely to lead to chronicity and also the duration for the recoverable cases is slightly higher. From subject numbers at baseline, anxiety is found to correlate strongly with co-morbid dysthymia (OR 2·76, p=0·013) and with gender, where it affects women more often then men (OR 2·15, p=0·004). In subjects with anxiety disorder, severe depression is observed almost twice as frequently as in subjects without anxiety (OR 2·49, p<0·001). These correlations suggest that anxiety may be viewed as an important cause of increased incidence and that it has an aggravating effect on severity. No significant correlation with recurrence was observed (OR 0·82, p=0·406).
CONCLUSION
Our present work further supports the conceptualization of depression as a response to randomly occurring stressors. It provides an explanation of how risk factor-defined groups of individuals may differ in their susceptibility and response time to stressors. A detailed analysis of survival data on depression, including data on relative incidence, has demonstrated the feasibility of evaluating the group-typical random-mood model parameters susceptibility and relaxation time and has established their connection with the easy-to-interpret observables risk ratio and mean duration. This Z–T classification has definite merits: in the present work it highlights differences in incidence and in the typical time course of depression between men and women, and between subjects with and without co-morbid anxiety, that have previously gone unnoticed. By combining information on incidence and duration for a given determinant, the Z–T classification differs from the Cox regression, which uses determinants to parameterize the time course of MDD, but not its incidence.
ACKNOWLEDGEMENTS
We thank Dr William R. Clark for useful discussions.
APPENDIX: METHODS OF ANALYSIS
Random-mood model
Day-to-day mood sequences, y m, are generated by (van der Werf et al. Reference van der Werf, Kaptein, de Jonge, Spijker, de Graaf and Korf2006):

The component g w(D) is gaussian white noise: stimuli randomly distributed in time with average spacing D. Z is the susceptibility and T the relaxation time. It is easiest to think of g w(D) as expressed in munits. Z is then just a number, which agrees with equation (2), where Z has been identified with a risk ratio. The random-mood simulation that matches the recoverable fraction of the full NEMESIS cohort is obtained by taking D=120 days, Z≡1, relaxation times Poisson-distributed with mean 〈T〉=365 days, and a depression line at −2 munits.
Non-parametric estimates and significance tests
At each follow-up inspection, numbered by k, we denote the number of subjects at risk as n k and those whose MDD episode has ended during the last interval, as m k. The model-independent estimate (Kaplan & Meier, Reference Kaplan and Meier1958) for the conditional probability that MDD will survive the kth interval, while already having lasted during all previous ones, is  k=(n k – m k)/n k. Its complement is the hazard: ĥ k=m k/n k. Conventionally, circumflexes are used to indicate that these are non-parametric estimates, based directly on the data. The survival probability is evaluated as the product Ŝ k=12,…,k. It is also known as a time-to-event curve. In our case, the looked-for event is the end of an MDD episode. When comparing two different survival curves, the corresponding hazards are written as ĥ jk=m jk/n jk (j=1, 2). The commonly used log rank test compares the total number of events in subgroup 1 against the number expected if, instead of ĥ 1k=m 1k/n 1k, which are the estimates of the first group on its own, the estimates of the combined group (m 1k+m 2k)/(n 1k+n 2k), would have been used. A univariate Cox regression assumes the hazards of the two groups to be just scaled versions of one another: h 2k=Ah 1k. The value of A for which this procedure gives the highest likelihood is called the hazard ratio (HR). Both the log rank and the hazard ratio only probe the global similarity or dissimilarity of two survival curves. For further details, the reader is referred to a text-book (e.g. Kleinbaum, Reference Kleinbaum1996).
Parametric significance test
Survival curves are of the form: S(t)=(1−F) exp (−t/τ)+F. Consider fits for two subgroups, τ(1), F(1) and τ(2), F(2), and their standard deviations (SD). Differences between the curves may be judged by a properly weighted distance in the (τ, F) plane [see Fig. 3(b)]. To this end, Wald statistics are formed: W(τ)=(τ1−τ2)/SD(τ1−τ2) and W(F)=(F 1−F 2)/SD(F 1−F 2). The quantity a=[W 2(τ)−2ρW(τ)W(F)+W 2(F)]/(1−ρ2) may be shown to follow a χ2 (df=2) distribution. We estimated the distribution correlation coefficient, ρ, from simulated random-mood data and found it to be very small: ρ≈−0·017. Thus W(τ) and W(F) are highly uncorrelated and the quantity W 2≡W 2(τ)+W 2(F) can serve as a χ2 (df=2) test statistic of the null hypothesis.
DECLARATION OF INTEREST
None.