INTRODUCTION
Parasitism is a complex process influenced by a multitude of environmental, host and parasite factors. For Myxobolus cerebralis, a myxozoan parasite that has a 2-spore 2-host life-cycle (Wolf and Markiw, Reference Wolf and Markiw1984), these factors may affect multiple stages during the life-cycle. Development of the myxobolus myxospore in the salmonid fish host is affected by host factors like fish species, age and size as well as environmental factors like temperature (MacConnell and Vincent, Reference MacConnell, Vincent, Bartholomew and Wilson2002). Similarly, infection of the oligochaete worm host (Tubifex tubifex) and subsequent development into a triactinomyxon actinospore can be affected by host genotype, substrate type and temperature (Kerans and Zale, Reference Kerans, Zale, Bartholomew and Wilson2002).
For many years, M. cerebralis impacted only artificial rearing facilities in Europe and the United States, where environmental factors contributing to a severe disease state were relatively obvious (mud substrates, low water flow, high host densities). However, in the 1990's free-ranging trout populations in the United States became afflicted (Bartholomew and Reno, Reference Bartholomew, Reno, Bartholomew and Wilson2002) and it was less clear what parameters dictated disease severity. Several studies have noted that high M. cerebralis infection prevalence is often observed at low-elevation sites where sedimentation is high, thus supporting high numbers of the oligochaete host (Sandell et al. Reference Sandell, Lorz, Stevens and Bartholomew2001; MacConnell and Vincent, Reference MacConnell, Vincent, Bartholomew and Wilson2002; de la Hoz Franco and Budy, Reference de la Hoz Franco and Budy2004; Krueger et al. Reference Krueger, Kerans, Vincent and Rasmussen2006), and temperatures fall within the optimal range for production and persistence of the parasite (12–15°C) (Markiw, Reference Markiw1992; El-Matbouli et al. Reference El-Matbouli, McDowell, Antonio, Andree and Hedrick1999).
It is generally acknowledged that once M. cerebralis becomes established in a system, the parasite is difficult to eradicate. The goal then becomes to reduce intensity of infection to a level where fish populations are not impacted (below occurrence of clinical disease). Risk assessment approaches are now being applied to identify steps that can be taken to control further dissemination of M. cerebralis or reduce the impacts of whirling disease in areas where it is already present (Bartholomew et al. Reference Bartholomew, Kerans, Hedrick, MacDiarmid and Winton2005). At the same time, conducting a risk assessment also identifies gaps in our knowledge about how the parasite spreads and under what conditions it may become a problem. One of the critical unknowns identified for managing systems containing anadromous fish is whether straying of infected adult fish plays a significant role in introducing M. cerebralis, and other pathogens, to new areas. This likelihood is a factor of both the rate of infection in the stray population as well as the frequency of straying, but a more basic question is whether death of a single infected fish could result in parasite establishment. A second unknown is how different water flow regimes affect establishment and propagation of the parasite. Whereas a number of environmental factors (e.g. temperature, substrate type) and their effect on the life-cycle of M. cerebralis have been investigated (Hiner and Moffitt, Reference Hiner, Moffitt, Bartholomew and Wilson2002; Blazer et al. Reference Blazer, Waldrop, Schill, Densmore and Smith2003; Kerans et al. Reference Kerans, Stevens and Lemon2005; Krueger et al. Reference Krueger, Kerans, Vincent and Rasmussen2006), the significance of water flow has been difficult to separate from temperature in field studies, and it has not been investigated in the laboratory. Understanding how flow affects the interaction between pathogens and their hosts can be incorporated in management actions, and in many rivers flow is one factor that can be manipulated.
To address these 2 issues, we took a holistic approach and investigated how flow affected the complete life-cycle (both hosts and both spore stages) of M. cerebralis. Our laboratory model began with the introduction of myxospores from a single infected fish, and compared the propagation of the parasite over 1 year under 2 different flow regimes. This experimental design enabled us to examine differences in establishment of infection in the invertebrate host (the time taken for infection to establish, prevalence of infection), effect on the invertebrate population, the subsequent prevalence of infection in fish, and the resulting severity of infection and effect on the vertebrate population. Data from this study will be useful for explaining observations from field studies and have direct relevance for risk assessment models for individual river systems.
MATERIALS AND METHODS
Experimental setup
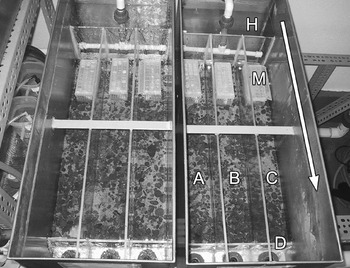
We constructed 2 identical stainless steel tanks (67 cm long) and subdivided each with Plexiglass into 3 replicate channels 10 cm wide, with a common inflow area and a 7 cm high Plexiglass dam wall near the separate outflows (Fig. 1). We used a rectangular plastic container (22×35 cm) for the control tank, which had a low flow, equivalent to the slow tank. Coarse sand was added to a depth of 3 cm to each channel (and control tank) and overlaid with a single layer of larger sediment (gravel, pebbles and several small cobbles) to provide refuge for the fry. We overlapped wire mesh above the dam to prevent escape of fish. The temperature of the inflow well water was 12·8°C.
Experimental setup of the stainless steel tanks used to represent fast flow (left) and slow flow (right) environments. The arrow indicates direction of flow. The common inflow water is split and flows into a header section (H) of each tank, then spills equally over a Plexiglass divider into the 3 replicate channels (A, B, C). The outflow passes over a Plexiglass dam wall (D) and down an outflow pipe. A mesh cage (M) secures the infected ‘stray’ rainbow trout in each channel.

Flow was measured in 2 ways: the volume of water leaving a channel (discharge rate) was measured and the velocity was obtained using a velocity meter placed on the substrate midstream (Marsh-McBirney Flowmate 2000, Marsh-McBirney, Maryland). The fast water flowed at ~6 l/min (2·0 cm/sec) per channel replicate and the slow tank flowed 100-fold less. Our flows were modelled on those naturally recorded for sections of a representative river in Oregon (USA) where M. cerebralis is endemic (e.g. Lostine River, Oregon; Lorz et al. Reference Lorz, Amandi, Banner and Rohovec1989). However, our experimental setup was restricted by the maximum allowable output through the necessary pathogen filter system and our final fast flows were 100 fold-less than those recorded in the field during summer and now represent pools or backwaters. Thus our setup could not fully emulate a natural system but does provide a basis for assessing the influence of flow. Water depth was approximately 5 cm in the fast and 4 cm in the slow channels. Because of the shallow nature of the channels, the boundary layer may extend to the surface. Flow characteristics varied between the tanks, with the fast flow channels exhibiting transitional flow characteristics and the slow flow channels having laminar flow characteristics (Allan, Reference Allan2001). In the fast flow channels we noted some re-circulation of the surface layer after modification of the dam wall.
Myxobolus cerebralis myxospores were introduced using subclinically infected rainbow trout (Oncorhynchus mykiss) to represent the infected ‘stray’ fish. These were obtained as eyed-eggs from Troutlodge Inc. (Washington) and infected in the laboratory as fry by cohabitation with parasitized Tubifex tubifex. Rainbow trout were used as our model system because they have a similar susceptibility as their anadromous form to M. cerebralis (MacConnell and Vincent, Reference MacConnell, Vincent, Bartholomew and Wilson2002; Sollid et al. Reference Sollid, Lorz, Stevens, Bartholomew, Bartholomew and Wilson2002) but, unlike steelhead, they are available commercially continually and at a constant size. Haemocytometer counts were done on 4 infected fish from the same cohort to gauge the range in number of myxospores per fish. One infected rainbow trout was euthanized in MS222, secured whole in a rectangular plastic mesh box, and placed in the substrate immediately below the inflow of each channel (Fig. 1). An uninfected trout of similar size was used in the control tank. The rate of degradation of the fish was noted visually throughout the experiment, and at termination tissue samples were examined for myxospores using a compound microscope.
Tubifex tubifex were collected from Wizard Falls Hatchery, Metolius River (tributary of the Deschutes River, Oregon). These are comparable in their ability to support the M. cerebralis life-cycle to those from Mount Whitney Hatchery (California), which are commonly used as an experimental reference group and are now in high demand but short supply. Both populations are of mitochondrial lineage III, are susceptible to the M. cerebralis myxospore and are recognized as relatively high producers of the subsequent actinospore (Beauchamp et al. Reference Beauchamp, Gay, Kelley, El-Matbouli, Kathman, Nehring and Hedrick2002; Arsan et al. Reference Arsan, Hallett and Bartholomew2007).
The worms were held in the laboratory on flowing water at 12·8°C for 2 months and monitored for M. cerebralis infection. Worms were added to each channel replicate at a density of 1600/m2 (115 worms) (Natural densities can range from less than 100 worms/m2 to more than 500 000 worms/m2 (Lazim and Learner, Reference Lazim and Learner1987; Zendt and Bergersen, Reference Zendt and Bergersen2000)). The control group consisted of 345 worms, equivalent to the total number used for each flow, and their primary purpose was to confirm that the stock was parasite-free. The worms were equally distributed along the length of the channel and the water flow was left off for several hours to allow settlement. An additional 60 worms were individually frozen in microfuge tubes for comparison of the genetic composition (mitochondrial 16S rDNA lineage) of the worm population at the beginning and end of the experiment (Beauchamp et al. Reference Beauchamp, Gay, Kelley, El-Matbouli, Kathman, Nehring and Hedrick2002).
The experiment commenced on 1 October 2004, and was followed for 1 year.
Filtering of outflow
Outflow from the tanks was filtered weekly, beginning on day 74 (Day 74; 14 December), until the end of the experiment. This starting date represents the earliest record of M. cerebralis actinospore release post-exposure (Gilbert and Granath, Reference Gilbert and Granath2001). Water flow was not interrupted during the filtering process to avoid altering the dynamics of each system. Outflow from the 3 replicate channels from each of the fast and slow tanks was combined (i.e. 1 sample per tank) until actinospores were detected; thereafter, replicates from that tank were filtered separately through 20 μm pore size Nitex mesh (CellMicroSieves, Biodesign, New York). The channels were initially screened for 1 h but this was later increased to 3 h (Day 193 onwards).
After filtering, the screen was rinsed several times and the retained material suspended in ~1 ml of well water and pipetted into a 10 ml collection tube. The final volume was adjusted during the experiment from 2 to 10 ml, depending on the expected number of spores; i.e. the volume was kept low until spores were detected. The final volume of the sample was noted then the tube was gently inverted several times and 2×50 μl drops pipetted onto a labelled frosted microscope slide and air-dried. Actinospores were counted using a light microscope and ×10 phase contrast. Two slides per sample were prepared; only 1 slide was counted unless there were fewer than 10 spores per drop or if there was considerable discrepancy between the 2 drops on a slide. The number of spores was extrapolated for the total volume in the collection tube and for each flow channel the number/l and /min was calculated.
The water flow discharge (lmin−1), temperature (°C) and dissolved oxygen (mgl−1) were measured after filtration each week.
Exposure of fish fry
As a second method to detect actinospores released from the worms in the water flow and to determine prevalence of infection in the fish host, we exposed rainbow trout sac-fry concurrently with water filtering. Well-eyed (embryo well developed) and dim-eyed eggs were ordered every 6 weeks and held at different temperatures in the laboratory (5°C–13°C) to ensure a steady supply of fry of a similar age (temperature units (TU)) each week.
Twelve fry, ~2–6 days post-hatch (~400 TU), were added to each channel at weekly intervals for 1 week exposures. This commenced on Day 73 and continued for 18 consecutive weeks. An additional 1-week exposure occurred in the final week of the experiment. We initially placed the fry directly in the channel to allow them access to all areas, but retrieval of these (with either a net or siphon) and separation from the 6-week fish (see below) proved tedious. Thus, they were later retained near the outflow inside the dam wall in a mesh (elongated hexagons of 1 mm×750 μm) handnet (Fig. 1). Following exposure, the fish were removed, rinsed with water, euthanized with MS222, and 10 were placed individually in a microfuge tube and frozen for assay by quantitative PCR (QPCR) to determine both prevalence and level of infection. Samples from 14 of the 18 consecutive collections were processed for QPCR: we began with those exposed when actinospores were detected in the water outflow and worked backwards until no infected fish were detected.
To assess differences in severity of infection (cumulative effects) between the fast and slow flow tanks, 25 sac-fry were added to each channel for a 6-week exposure. This also commenced on Day 73 and continued until the end of the experiment; 7 exposure groups in all. After exposure, the fish from the 3 replicate channels of a flow tank were differentially fin-clipped and held together in a 25 l tank for 5 months. Afterwards, the surviving fish were euthanized with MS222, sorted into replicates according to their finclip, weighed and clinical signs noted (black tail, skeletal deformities, exophthalmia). One half-head was placed in a histological cassette and into 10% buffered formalin for sectioning and histopathology and the other half-head was placed in a 50 ml tube and frozen for QPCR analysis. Fish that died during holding were preserved in 10% buffered formalin. Half-heads were processed fully only for fish groups that exhibited no clinical signs but actinospores had been detected in their water flow.
Fish were fed a diet of flake food (TetraFin Goldfish Flakes, Tetra, Melle Germany) while in the channels (to prevent fungal growth in the channel) and commercial pellet (Bio-Oregon, Astoria, USA) when moved to regular tanks.
Tubifex tubifex
At 201 days post-exposure the prevalence of infection and spore release per individual worm in each of the fast and slow channels was compared. When there were no fish in the tanks, the inflow to each was turned off, a sample of sediment was removed from each channel and 24 worms were placed individually in the wells of a 24-cell well plate. The worms were examined under a dissection microscope for hair chaetae, rinsed in fresh water and transferred to a clean plate. Excess water was removed and 1 ml of well water added. The plates were held at the same temperature as the main experiment for 48 h then worms were removed from their well using a metal hooked probe and returned to their respective channels (water flow was turned off for 1 h to allow settlement). A well-mixed 500 μl subsample from each of 20 wells per plate was air-dried on a glass microscope slide and the number of spores counted using a compound microscope under ×100 magnification and phase contrast. A total of 120 exposed and 20 unexposed control worms were processed in this manner.
Upon termination of the experiment, the flow was turned off and all worms in each channel were counted and the proportion of adults and progeny noted. The channels were divided into quarters and each segment processed separately to determine the distribution of the worms. Ten large worms from each quarter (40 per replicate channel) were checked for hair chaetae, rinsed and placed individually in a microfuge tube and frozen for QPCR. Half of these (20 per channel, 5 per quadrant) were assayed for M. cerebralis and genetic lineage was determined for a subsample (10 per channel, at least 1 per quadrant) comprising a mixture of infected and uninfected worms.
DNA extraction and PCR assays
Fish fry were digested with 400 μl of ATL buffer and 20 μl of Proteinase K at 55°C, treated with 50 μg RNAse A and the DNA extracted and purified using a QIAGEN DNeasy Tissue Kit following the Animal Tissue protocol (Valencia, California). DNA was eluted in 2 steps of 50 μl of AE buffer and stored frozen. Fish half-heads were processed as per the American Fisheries Society (AFS) Blue Book protocol (2005).
Worms were digested with 95 μl of ATL buffer and 5 μl of Proteinase K at 55°C, boiled for 5 min, and diluted 1:101 with buffer AE then stored frozen.
A QPCR assay targeting M. cerebralis was performed following the protocol of Kelley et al. (Reference Kelley, Zagmutt-Vergara, Leutenegger, Myklebust, Adkison, McDowell, Marty, Kahler, Bush, Gardner and Hedrick2004) except that 4 μl of extracted DNA was used in a final reaction volume of 20 μl. Reactions were performed in an ABI PRISM 7000 or 7500 Sequence Detection System in either ABI PRISM™ optical tubes or MicroAmp® optical 96-well reaction plates. Negative (water) and positive (spores or infected fish) controls were included in each run. Fish samples were run in duplicate; they were re-run if the standard deviation of the duplicates was greater than 1·0 or if only 1 of the pair fluoresced. Worm samples were run singly; they were re-run if the cycle threshold (Ct) value was high (39 or above) or if the amplification plot was dubious. The QPCR Ct values provided a measure of quantification of infection and a level of assessment of severity of infection.
A PCR assay targeting the different mitochondrial 16S rDNA lineages of T. tubifex was performed based on Beauchamp et al. (Reference Beauchamp, Gay, Kelley, El-Matbouli, Kathman, Nehring and Hedrick2002).
Reference samples
Sets of reference samples with known quantities of parasite (number of spores) were prepared for each host group to assess the methodology (i.e. determine minimum levels of detection and false positives). Actinospores were obtained from a concurrent exposure experiment and myxospores from a Troutlodge cohort member.
Three sets of standards were prepared for fish. For the first set, 3 replicates of 10 fry each were exposed to 1, 10 or 100 actinospores per fish for 26 h. Exposures were done in 350 ml of well water and after 1 h the water was aerated. Following exposure, the fish were euthanized in MS222, rinsed and placed individually in microfuge tubes and frozen for DNA extraction and QPCR. For the second set, triplicates of individual euthanized fry were placed in a microfuge tube with 1, 10 or 100 actinospores or myxospores and frozen for DNA extraction and QPCR as per the experimental fry. For the third set, 6 half-heads from uninfected juvenile trout were processed as per the experimental fish, except that half were spiked with 100 myxospores and the other half with 1000 myxospores after pepsin-trypsin digestion.
We also prepared triplicate sets of standard worm samples. Individual worms (unexposed Wizard Falls stock) were placed in microfuge tubes with 1, 10 or 100 actinospores or myxospores and frozen, then processed as per the experimental worms. Reference samples were run in duplicate in the QPCR and considered positive if both wells fluoresced.
Statistical analyses
Statistical analyses were performed using the software program SAS Version 9.0 (SAS Institute). Appropriate tests were performed to evaluate the assumptions of each statistical method.
Filtering of outflow
We used the proc mixed procedure to perform a repeated measure analysis to determine if there was a flow effect (random effect) on the number of actinospores detected in the outflow and if there was a time or temperature effect (fixed effects). The data (spores/min, spores/l) were log-transformed, temperature was treated as a covariant and time was divided equally into 3 periods: Days 123–200, Days 207–284, Days 291–375.
Exposure of fish
We used the proc logistic procedure with a logistic regression model to evaluate the relationship between the percentage of fish infected after 1 week exposure in the 2 different flows and time. Time was discretised i.e. divided equally into 2 periods: Days 116–158, Days 165–377. The proc mixed procedure with repeated measure analysis was used to determine if there was a difference in severity of infection in these fish between the flows (random effect) and over time (fixed effect; discretised: Days 116–158, Days 165–200 and Day 377). For the fish exposed for 6 weeks, we used the proc logistic procedure with the logistic regression model to assess whether there was a significant difference between the 2 flows in 3 parameters: the number of fish that survived the 6-week exposure, those that survived the 6 months holding, and those with clinical signs. We used the proc glm procedure with a one-way ANOVA model to assess the relationship of weight between the 2 flows. To assess whether there was a significant difference in first detection of the parasite between the 2 actinospore detection methods (water filtration and fish exposure) and flow we used the proc glm procedure and a 2-sample t-test (to assess flow differences) and the proc mixed repeated measure (to assess method differences; flow=random effect, time=fixed effect).
Tubifex tubifex
To evaluate differences in the percentage of worms releasing actinospores at Day 201 and the percentage infected at Day 375 we used the proc logistic procedure with logistic regression model. We used the proc glm procedure with a t-test to examine severity of infection (denoted by Ct value) at Day 375 and amplification of the worm population. We used the proc catmod procedure with a multinomial regression model to generate maximum likelihood predicted values for probabilities of infected worms in the different release categories, the significance of which was determined using a Chi-square test.
RESULTS
Experimental setup
Myxospore donor fish
Myxospore numbers in 4 assessed cohort members ranged from 6·6×104–3·1×106 spores/fish. There was a noticeable difference in degree of degradation between donor fish in replicate channels of a flow, but not between the flows; after 1 year, there were approximately 1/8–1/3 visible remains in all channels and myxospores were observed in these.
Temperature
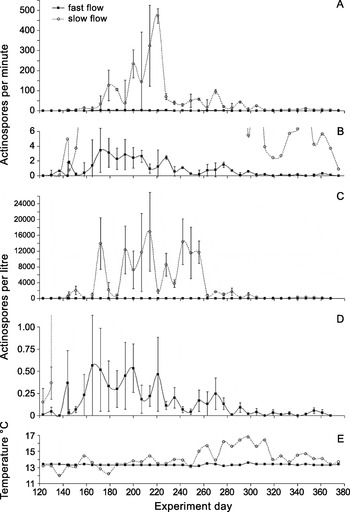
The inflow water for both flow tanks was a constant 12·8°C but the channels were subject to fluctuations in ambient temperature. Over the course of the experiment, temperature ranged from 13·1 to 13·6°C (range 0·5°C) in the fast channels, 10·8 to 17·2°C (range 6·4°C) in the slow channels and 11·4 to 16·2°C (range 4·8°C) in the control tank. The greatest difference in temperature between the fast and slow channels (mean of replicates) was 3·2°C on Day 298 (Fig. 2E).
Number of Myxobolus cerebralis actinospores (average of 3 replicate channels) detected per min (A, B) and per litre (C, D) by filtering the water outflow of the fast and slow flow channels. Weekly filtering began on Day 74 and continued for 38 weeks, until the end of the experiment on Day 375. Actinospores were first detected on Day 130. Graphs A and C are scaled for the slow flow data, B and D are scaled for fast flow data and E shows temperature. The control tank was negative. Error bars are ±1 s.e. of the average.

Filtering of outflow
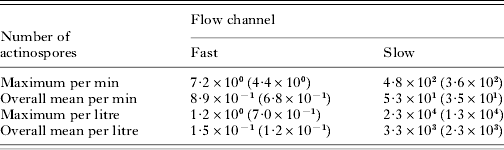
Actinospores were first detected in the outflow water on Day 130 in pooled retentates of both the fast and slow flow tanks (Fig. 2). Two weeks later (Day 144), spores were found in a second channel of the slow tank, and 2 weeks later again (Day 158), from the third channel. Four weeks (Day 158) after spores were first detected in the fast tank, a second channel became positive and spores were not detected in the outflow of the third channel until 4 weeks later (Day 186). At the end of the experiment (Day 375), spores were still being released in all 3 slow channels but none were detected in any of the fast channels (spores were detected 1 week earlier in a single fast channel) (Fig. 2). More spores were detected in the slow channels than in the fast channels. Over the 37 weeks of filtering, there were 2 orders of magnitude difference in the maximum and mean number of spores/min and 4 orders of magnitude difference in these measures/l between treatments (Table 1). More intact spores (sporoplasm present) were observed in the fast flow samples than in the slow flow (data not shown). With respect to actinospore numbers, there was a significant interaction between flow and time (spores/min P=0·0230, spores/l P<0·0001) but not with temperature (P=0·8396, 0·9647).
Summary of numbers of Myxobolus cerebralis actinospores detected in the outflow water from the fast and slow flow channels over 37 weeks of filtering
(Data are displayed as the mean of the 3 replicate channels i.e. n=3. The standard deviations are in parentheses.)

Infection of fish fry
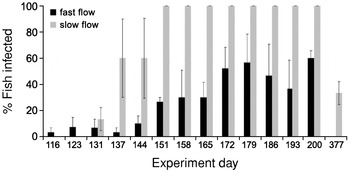
Fry first became infected during the week of Days 110–116 in the fast flow tank (1 replicate) and during Days 123–131 in the slow flow tank (2 replicates) (Fig. 3). Infection did not occur in fry in all 3 replicate channels until Days 144–151 in both flows. Prevalence of infection in all slow channels was 100% by Day 151 whereas maximum prevalence in a fast channel was 50, 80 or 100%, beginning Day 179. Myxobolus cerebralis DNA was not detected in any of the fish held in the fast flow channels in the final week of the experiment (Days 370–377) whereas it was detected in 33·3% (s.d. 15·3, n=3) of the slow flow fish. Note that in exposure weeks ending Day 123 (Fast A and B), Day 172 (Fast B), and Day 179 (Slow B and C) 9 rather than 10 fish were processed. There was a significant interaction between flow and time with respect to the percentage of fish infected (P=0·0007).
Percentage of rainbow trout fry (average of 3 replicate channels, 10 fry per replicate) exposed for 1 week in either fast or slow water flow that tested positive by QPCR for Myxobolus cerebralis. The experiment day represents the 7th day of exposure. All control fish were negative. Weekly exposures began on Day 73 for 18 consecutive weeks then in the final week of the 1-year experiment. The first positive fish was detected in the exposure week of Days 110–116; earlier negative data are not included. Error bars are ±1 s.e. of the average.

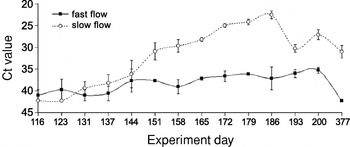
Comparison of infection levels in the fish held at fast and slow flows over the course of the experiment shows a significant interaction between the 2 flows and over time (P<0·0001). The values of the fish held in the fast flow remain relatively constant and high (little parasite DNA) whereas Ct values decrease over time (increased parasite DNA) in fish held in the slow flow except towards the end of the experiment when values increased in both treatments (Fig. 4). By Day 186 mean Ct values differed by 14 units, indicating that fish in slow flow harboured approximately 4 times more parasite DNA than infected fish in fast flow.
Severity of Myxobolus cerebralis infection in rainbow trout fry as indicated by QPCR cycle threshold (Ct) values. Data points are average Ct values (mean of mean value) of 3 replicate channels, and error bars are ±1 s.e. of the average. Ten fish per replicate were held for 1 week in either fast or slow water flow above infected oligochaete worms. Approximately 3·3 Ct units equal a 10-fold difference in DNA concentration. As Ct values are inversely proportional to the quantity of parasite DNA, groups with no positive fish were designated a Ct value of 42.

Comparison of the 2 actinospore detection methods revealed that there was a significant difference between them (F-test, P=0·0332) with fish generally positive by QPCR before actinospores were detected in the water outflow. There was a 4 (s.d. 1·7, n=3) week delay between detection in fish and water in the fast channels and a 1 (s.d. 1, n=3) week delay in the slow channels. There was no significant difference in either detection method between the 2 flows (P=0·4818 for filtration, P=0·5944 for fish).
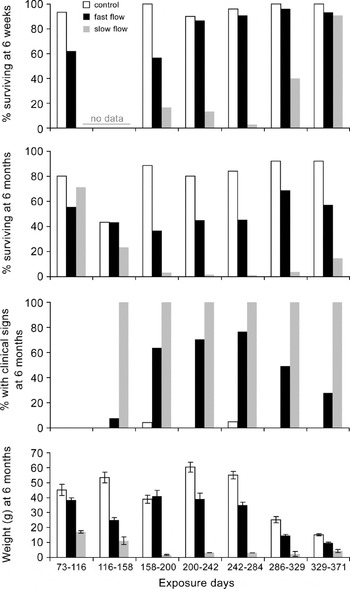
Severity of infection in the 6-week exposure fish is reflected at various stages of the experiment: survival during the exposure period, survival post-exposure, and clinical signs of disease (black tail, deformities, stunted growth) (Fig. 5). The first groups of fish exposed for 6 weeks displayed no clinical signs of disease and none tested positive by QPCR. Although both flows had similar final numbers of fish, there was a significant difference (P=0·0002) in the mean weight of these with the slow flow fish being half that of the fast flow fish. Fish from both flows in the remaining 6 groups of exposures showed clinical signs of infection. Fish subjected to the slow flow environment incurred the greatest mortality at 6 weeks (P<0·0001) and at 6 months (P<0·0001) and showed the highest level of clinical signs of infection (P<0·0001).
Severity of Myxobolus cerebralis infection in rainbow trout fry exposed for 6 weeks in fast and slow flows then held for 5 months. Severity is expressed in 4 ways: the percentage of fish that survived the 6-week exposure; the percentage that survived after 6 months; the percentage of fish with clinical signs at 6 months; and the weight of the survivors at 6 months. Channel replicates have been combined for each flow. Note that 22·7% of the fast flow fish from the Days 242–284 exposure died 6 weeks before 6 months in a water mishap. Data are absent for slow Days 73–116 and for all groups Days 116–158. Error bars are ±1 s.e. of the average.

Tubifex tubifex
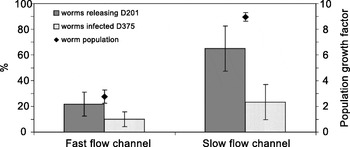
Prevalence of infection in the worm populations was assessed both mid-way through (Day 201) and at the conclusion (Day 375) of the experiment. Every flow replicate (fast and slow) contained infected worms that released actinospores during a 48 h plate-out period at Day 201 but significantly more (P<0·0001) slow worms (65% (s.d. 30·4, n=3)) than fast flow worms (21·7% (s.d. 16·1, n=3)) released spores (Fig. 6). In any replicate, the majority of infected worms (mean 63·6%, s.d. 21·2, n=6) released only low numbers of spores (up to several 100 each). Fewer infected worms (mean 25·4%, s.d. 17·2, n=6) were classified as medium releasers (several 1000 spores) and even fewer (mean 11·0%, s.d. 10·4, n=6) as high releasers (5000–10 000 spores). In either flow, infected worms had the highest probability of being low releasers (Fast: high 0·3330 s.e. 0·0232, medium 0·0667 s.e. 0·0322, low 0·1167 s.e. 0·0414; Slow: high 0·0833 s.e. 0·0357, medium 0·15 s.e. 0·0461, low 0·4167 s.e. 0·0636) and the chi-square test corroborated this, indicating unequal proportions of worms in different categories of actinospore release (P<0·0001). At Day 375, both flows still contained infected worms: on average, 10% (s.d. 10, n=3) of the fast flow worms were positive for M. cerebralis by QPCR and 23·3% (s.d. 23·6, n=3) of the slow flow worms; the difference between the flow replicates was not significant (P=0·0561). None of the 20 control worms was positive (Fig. 6). Note that the number of worms tested from the slow flow channels represents only 2% of the final worm population versus 5–8% of the fast flow worms. Severity of infection in the worms, as indicated by QPCR Ct values, was similar for both flow regimes (P=0·2811). The average Ct value for positive worms in the fast flow channels was 31·4 (s.d. 0·87, n=2 (channel C was negative)), and for the slow flow channels this was 32·4 (s.d. 0·88, n=3). Thus, according to both the level of release and parasite load data, differences in actinospore numbers detected through filtration of the water flow were the result of differences in prevalence of infection rather than severity of infection in the worms.
Prevalence (average of 3 replicate channels, 20 worms assessed per channel) of Myxobolus cerebralis infection in Tubifex tubifex from the fast and slow flow channels. Grey bars=percentage releasing actinospores during a 48-h plate-out period at Day 201 post-exposure; dotted bars=percentage positive by QPCR 1 year post-exposure. Factor is the amount of increase in total number of worms in each channel at the end of the experiment. Error bars are ±1 s.e. of the average.

In all channels, T. tubifex propagated over the 1 year of the experiment (Fig. 6). Worms at least doubled their numbers in the fast flow channels (average 2·8; s.d. 0·90, n=3) but were 8 times their original number in the slow flow channels (average 9·0; s.d. 0·59, n=3). There were 601 control worms (less than double). There was no overall apparent strong bias in distribution of the worms along the channels.
All worms sampled at the beginning and end of the experiment (60 each time) were lineage III. Thus, no further worms were assessed.
Reference samples
Fish dosage exposure
None of the fry exposed to 1 actinospore each for 26 h tested positive by QPCR for M. cerebralis whereas an average 66·7% (s.d. 15·3, n=3) of those exposed to 10 spores each (Ct values mean 34·6; s.d. 1·3, n=3) and 73·3% (s.d. 23·1, n=3) of those exposed to 100 spores each (Ct mean 36·1; s.d. 0·5, n=3) had detectable M. cerebralis DNA.
Fish and actinospores
None of the fry spiked with 1 actinospore tested positive, whereas all of those spiked with 10 (Ct values mean 34·1; s.d. 1·6, n=6) or 100 (mean 33·5; s.d. 1·8, n=6) actinospores each tested positive.
Fish and myxospores
Only 1 fry spiked with 10 myxospores tested positive (Ct mean 36·3; s.d. 1·1, n=2).
Fish half-heads and myxospores
All spiked heads tested positive for M. cerebralis; 3 fish spiked with 100 myxospores had an average Ct value of 37·3 (s.d. 1·4, n=9) and an additional 3 fish spiked with 1000 myxospores averaged 34·4 (s.d. 0·7, n=9).
Worms and actinospores
One worm spiked with 1 actinospore tested positive (Ct mean 36·7; s.d. 2·3, n=2). All of the worms spiked with 10 (Ct mean 31·2; s.d. 0·9, n=6) or 100 (Ct mean 27·3; s.d. 0·5, n=6) actinospores each tested positive.
Worms and myxospores
None of the worms spiked with 1 myxospore tested positive, whereas 1 of the worms spiked with 10 myxospores (average Ct 40·3; s.d. 3·1, n=2) and all of the worms spiked with 100 myxospores (average Ct 35·3; s.d. 1·3, n=6) tested positive.
DISCUSSION
Myxobolus cerebralis has been the focus of numerous studies that have examined different aspects of the parasite's life-history in an effort to reduce severity of infection in fish where it has become established and to contain its spread into new habitats. Water flow is recognized as an environmental factor that may have a significant influence on infection intensities in wild salmonid populations (MacConnell and Vincent, Reference MacConnell, Vincent, Bartholomew and Wilson2002). In natural systems, water flow rate is often linked to other environmental parameters, with the effects being difficult to separate. Low flows, for example, often result in increased water temperatures and deposition of fine particulates and it has been suggested that high flows might cause damage to the fragile actinospore stage and dilution effects (Kerans and Zale, Reference Kerans, Zale, Bartholomew and Wilson2002; MacConnell and Vincent, Reference MacConnell, Vincent, Bartholomew and Wilson2002; de la Hoz Franco and Budy, Reference de la Hoz Franco and Budy2004). The individual effects of temperature and substrate on the M. cerebralis life-cycle have been studied under controlled laboratory conditions, but the effects of flow rate alone have not.
To examine the effects of water flow on the establishment and propagation of Myxobolus cerebralis, we established a series of artificial stream channels, identical except for inflow regime, and investigated differences in infection in both the invertebrate and vertebrate host over 1 year. The life-cycle was initiated with the introduction of a single dead infected fish into an environment with susceptible T. tubifex. Myxobolus cerebralis myxospores are released upon the death of their fish host whereas actinospores exit their living worm host via the intestinal tract directly into the water column (El-Matbouli and Hoffmann, Reference El-Matbouli and Hoffmann1998). The tubificid host density (1600/m2) was selected to represent a population density of a stream channel rather than that of a reservoir or pond environment where oligochaete host populations might be several magnitudes higher (Zendt and Bergersen, Reference Zendt and Bergersen2000; Krueger et al. Reference Krueger, Kerans, Vincent and Rasmussen2006) and establishment of the parasite more certain.
Release and dispersal of myxospores from infected fish
By allowing the fish to degrade naturally in the tank we hoped to model the death of a stray infected salmon and determine how soon infection could occur in the worms and how long spore release might persist. Although there are no data for numbers of myxospores that would be released following death of an adult salmon, we expect that the wide range we observed in our laboratory infected trout is representative and is one of the reasons we used replicates for each flow type. We believe the overall differences in infection dynamics observed between the flow treatments are not the result of differences in the number of myxospores released. Infection data for replicates of a flow regime are more similar to each other than to a replicate of the other tank and it is unlikely that only fish with low spore loads were assigned randomly to one tank and fish with high spore loads to the other. Based on the counts of infected cohort fish, worms may have been exposed to between 574 and 26 957 myxospores each, over the course of the experiment. Stevens et al. (Reference Stevens, Kerans, Lemmon and Rasmussen2001) found no difference in total actinospore production for groups of worms (Mt Whitney strain) exposed to between 50 and 1000 myxospores each and the threshold myxospore dose resulting in infection was less than 50 per worm. In other exposure experiments using Wizard Falls' worms exposed to 500 myxospores each, 90–95% released actinospores (Arsan et al. Reference Arsan, Hallett and Bartholomew2007; authors' unpublished data). Thus, differences between the tanks are more likely to be caused by flow than by myxospore dose.
There was little difference between the 2 flow regimes in the time taken for spores to exit the infected stray fish and infect the invertebrate host as actinospores were detected in both flow regimes in the same week and there was only a 1 week difference between when infected fry were detected. In a separate study in which T. tubifex were exposed directly to myxospores, we detected actinospores in filtered water by Day 95. Therefore, detection of actinospores at Day 130 indicates it takes approximately 3 weeks for infected fish to decompose (at the temperatures in this study) sufficiently for spores to be released or for spores to reach the oligochaetes. However, this was where the similarity between the flow regimes ended; differences in prevalence of infection in both hosts and severity of infection in trout were obvious. These differences are likely caused by the higher retention (number and time period) of spores in the lower velocity environment. This is probably more applicable to the less bouyant myxospore stage than the actinospore stage, which was detected in the filtered outflow.
Our observation of myxospores in the remains of the infected fish at the end of the experiment indicates these spores were being continually added to the system. Rainbow trout fry that became infected during their 6-week exposure were unlikely to contribute myxospores back into their habitat since they were resident for only 42 days at approximately 13°C and 52 days are required at 17°C for spore development (Halliday, Reference Halliday1973).
Dynamics of the M. cerebralis life-cycle under 2 flow regimes
Actinospore release was first detected at the same time in both fast and slow flow channels, however, the number of actinospores detected in the outflow differed dramatically between the groups. Over 800 actinospores/min were detected from the outflow of the slow flow treatment versus less than 11 actinospores/min from the fast flow. Similarly, the percentage of fish that became infected in all replicates of the slow flow channels reached 100% (Day 151) and this infection prevalence was maintained for over 8 weeks while 100% infection occurred just once in a single channel of the fast flow group (Day 179, mean prevalence 56·7%; maximum mean prevalence 60% Day 200). Differences in infectious dose that the fish received was also reflected by the number of fish that developed clinical disease signs under the 2 flow regimes. After the first 6-week exposure period (Days 73–116), all fish exposed in channels with slow flow (and high actinospore counts) suffered clinical whirling disease. Clinical signs also were evident in fish held in fast flow channels, but these were not as severe.
Higher actinospore counts in the slow flow were a reflection of higher infection prevalence, rather than of heavier infections, of the oligochaete host. At the lower velocity, myxospores likely remained in the system longer and were more likely to be carried lower in the water column and to become trapped behind larger substrate or settle than those in the higher flow, all of which promote availability for ingestion by the worm host. Worm infection prevalences were similar between the 2 flows at 1 year (Day 375) but the actual number of worms infected (and thus number of spores produced) was much higher in the slow flow treatment. However, fewer worms in both flows were infected at the conclusion of the experiment than midway through the experiment (Day 201). This outcome is unexpected since at our experimental temperature T. tubifex have been demonstrated to survive and remain infected for over 1 year (Gilbert and Granath, Reference Gilbert and Granath2001). In addition, myxospores were observed in the infected ‘stray’ fish remains after 1 year, thus spores should have been available throughout the experimental period and the worms exposed continually. Neither of the 2 different quantification methods we used explains our data. We expect molecular methods (molecular detection (QPCR) of the parasite within the worm host at Day 375) to provide an overestimation of infection prevalence (e.g. false positives caused by presence of ingested myxospores which have not proliferated within the host) and visual assessment (microscopical detection of released actinospores at Day 201) to provide an underestimate (since worms may be infected but not release during observation).
At the end of the 1 year experiment, no actinopores were detected in the outflow of any of the fast channels and none of the fish exposed to the fast flow during the final week were positive but 10% of worms (s.d. 10%) sampled from 2 of the 3 channels tested positive for M. cerebralis by QPCR. In contrast, low numbers of spores (mean 0·9/min, s.d. 0·8) were detected in the outflow of all 3 slow flow channels, 33·3% (s.d. 15·3%) of the fish exposed to the slow flow tested positive for M. cerebralis by QPCR and 23·3% (s.d. 23·6%) of the worms assayed were positive. This indicates that although a low level of infection remains in the invertebrate hosts in both flow environments, the parasite is only able to maintain its life-cycle (and thus proliferate) in the slow flow.
Water flow effects
Low water flows can be expected to create an environment conducive to the establishment and propagation of parasites such as M. cerebralis. Low flow promotes retention and accumulation of parasitic infective stages in a system (see Marcogliese, Reference Marcogliese2001; Kerans and Zale, Reference Kerans, Zale, Bartholomew and Wilson2002), the settlement of salmonid carcasses, and the deposition of fine sediments that create habitat and a food source for T. tubifex (Kerans and Zale, Reference Kerans, Zale, Bartholomew and Wilson2002; Rodriguez et al. Reference Rodriguez, Martinez-Madrid, Arrate and Navarro2004). Although data on habitat preference of T. tubifex are conflicting (see McMurtry et al. Reference McMurtry, Rapport and Chua1983) and the presence of bacteria may be more important than sediment size (McMurtry et al. Reference McMurtry, Rapport and Chua1983; Lazim and Learner, Reference Lazim and Learner1987), there is evidence that substratum influences susceptibility of worms to infection by M. cerebralis. Silt and clay were shown to harbour more infected worms than other substrates (Krueger et al. Reference Krueger, Kerans, Vincent and Rasmussen2006) and worms residing in silt or mud (at the same flow) produce more actinospores than those in sand (Arndt et al. Reference Arndt, Wagner, Cannon, Smith, Bartholomew and Wilson2002; Blazer et al. Reference Blazer, Waldrop, Schill, Densmore and Smith2003). We found no difference in actinospore production between worms in the slow flow environment and the fast flow. However, prevalence of infection was at least double (and thus overall production was greater) and worm survival was 4-fold higher in the slow flow where fine particulate material had accumulated.
Krueger et al. (Reference Krueger, Kerans, Vincent and Rasmussen2006) determined that water velocity was negatively correlated to the density of infected T. tubifex. Similarly, E. R. Vincent (personal communication) found a significant inverse relationship between water flow (volume) and infection intensity in rainbow trout. Vincent attributed the effect to dilution of the infective stage and subsequent likelihood of these stages making contact with a fish. Additionally, not only was the volume increased, so too was the rate of flow which likely limits the time for the actinospore to encounter and attach to its fish host. In contrast, de la Hoz Franco and Budy (Reference de la Hoz Franco and Budy2004) found that prevalence of infection in cutthroat (Oncorhynchus clarki) and brown trout (Salmo trutta) increased with discharge (to a point), but this was linked with temperature that may have been the overriding factor.
The influence of water flow on temperature was apparent in our study: the slow flow tank was more susceptible than the fast flow tank to temperature fluctuations relative to the ambient temperature (6·4°C range versus 0·5°C). However, the greatest temperature difference between the 2 habitats in any given week was 3·2°C. In a field study, Thompson and Nehring (Reference Thompson and Nehring2000) documented lower actinospore densities when water flow increased and proposed that this was more than a simple dilution effect, attributing the relationship to water temperature which appeared to inhibit the release of spores at lower temperatures and stimulate release at higher temperatures. However, Krueger et al. (Reference Krueger, Kerans, Vincent and Rasmussen2006) found that environments with low mean temperatures had the highest prevalence of infected T. tubifex. Temperature, however, does not explain the differences we observed in spore concentrations between the 2 flows we studied.
Although survival of M. cerebralis spores in the environment and proliferation in its hosts is affected by temperature, our experimental temperatures should not have influenced survival and hence infectivity of either type of M. cerebralis spore. Myxospores are tolerant of temperatures up to 40°C and at 13°C can survive at least 5 months after release from fish host (El-Matbouli and Hoffmann, Reference El-Matbouli and Hoffmann1991). Actinospores, although more fragile, can persist for 3–4 days at 12·5°C and maintain their infectivity for 15 days at 15°C (see Wagner, Reference Wagner, Bartholomew and Wilson2002; Markiw, Reference Markiw1992; El-Matbouli et al. Reference El-Matbouli, McDowell, Antonio, Andree and Hedrick1999). Optimal temperature for development in the worm hosts is 15°C (El-Matbouli et al. Reference El-Matbouli, McDowell, Antonio, Andree and Hedrick1999). Similarly, in the fish host the optimum temperature range for parasite growth is 15–17°C (Halliday, Reference Halliday1976) and water temperature elevated from 12·5 to 17°C significantly affected mortality in infected fish (Schisler et al. Reference Schisler, Bergersen and Walker2000). Infection intensity is most severe when fish were naturally exposed between 12 and 15°C (Baldwin et al. Reference Baldwin, Vincent, Silflow and Stanek2000), which was within the ranges of our experimental flows (10·8–17·2°C for the slow flows and 13·1–13·6°C for the fast flows).
Our data also suggest that attachment of the actinospore to the fish host is affected by flow. This is supported by 2 observations. Firstly, there were more ‘empty’ actinospores (i.e. lacking sporoplasms) retrieved from the slow flow channels compared with the fast flow. Secondly, even when a similar number of actinospores were detected in the 2 flow regimes, more fish become infected in the slow flow than in the fast flow environment. For example, exposure of fish in the slow flow to as few as 1·8 actinospores/minute (average of filter results from first and last day of exposure period) to less than our level of detection resulted in 100% infection, whereas it took a mean of 5·5 actinospores/minute to result in 100% infection in the fast flow environment.
Assessment of methodology
Our experimental conditions were most similar to low flows that might be present in pools, backwaters and shallow stream margins under summer flow conditions (fast flow) and to the more static conditions of a reservoir, lake or stagnant pool (slow flow). We could not experimentally reproduce flows representative of those typical in mainstream channels of rivers and streams. However, at these relatively low flows we were able to document clear differences amongst flow treatments in prevalence of infection in worms, actinospore release and infection severity in fish. These host and parasite differences would likely be more extreme if a faster flow had been used. Both salmonid fry and tubifex worms would be expected to occur naturally in habitats similar to those we created artificially. Streams are the initial rearing habitat for most salmonid species (Quinn, Reference Quinn2005) and fry emerging from gravel redds initially prefer shallow or ‘quiet’ backwaters or stream margins (http://cybersalmon.fws.gov/csamhabitat.htm; Quinn, Reference Quinn2005). Specific parameters are sparse, but both fry and juvenile brown trout prefer velocities of less than l5 cm/sec (Raleigh et al. Reference Raleigh, Zuckerman and Nelson1986).
The presence of the waterborne actinospore, released from infected worms and infective for fish, was measured in 2 ways: filtering the outflow and examining the retained material under a light microscope, and by using fish fry as a biological filter which were then analysed by QPCR for infection. The use of fish proved to be a more sensitive detection method for actinospores than filtration of the outflow. This is likely because they ‘screened’ the water for days rather than hours. The difference may also be caused in part by the hydrodynamics of the tank set-up if spores were retained in eddies upstream from the outflow dam wall. This would be expected to be more relevant in the slow flow tank, however, the difference between the 2 detection methods was least here. The sensitivity of the methods is reinforced by the reference fish dosage study which demonstrated that we could detect infection in fish following exposure levels as low as 10 actinospores per fish in at least 50% of fish exposed for 26 h, but not as low as 1 spore per fish (this offers an optimal reference since infection success is likely to be less in the tanks with flowing water and reduced wall effects). For a 1-week exposure (10 080 min) this equates to a minimum detection level of 9·9×10−4 spores/min (10 spores/10 080 min) per fish whereas the theoretical minimum for the filtration method (1 spore observed on microscope slide in one of two 50 μl aliquots from 2 ml of retentate after 3 h of filtration=(1/2×20)/180 minutes) is 5·5×10−2 spores/min, nearly a 100-fold difference in sensitivity. This explains why, at low exposure levels, fish can become infected but spores may not be detected in filtered water. Indeed, the number of spores detected in the outflow proved not to be an accurate predictor of the prevalence of infection in the fish (or vice versa). On 1 occasion (Day 151) no spores were detected in the outflow of one slow replicate yet all the fish that were held that week (Days 144–151) in that channel tested positive for M. cerebralis by QPCR.
Reference samples of each host group containing known quantities of parasites (number of spores) were used to determine the minimum detection levels of M. cerebralis by QPCR and to distinguish between true infections versus ‘contaminated’ samples. (Note that in a QPCR assay, the Ct value is inversely proportional to the amount of target DNA present.) The following is our rationale for the designation of QPCR positive samples. Both spore types may contaminate worm samples and present false positives. Worms become infected via ingestion of myxospores with sediment, however, the mere presence of these spores does not constitute an infection, yet the sample would test positive for the parasite. The worm is not parasitized until the spore's sporoplasm has penetrated the host's gut epithelium and begun to divide. Additionally, the processes of released actinospores (which are anchor-shaped) can become tangled in worm chaetae and provide another source of contamination.
In both fish fry and worm samples we could detect 10 infectious units (actinospores and myxospores respectively). In infected hosts we could detect 100 myxospores in fish (dilutions equal to 10 myxospores were also detectable; data not shown) and 1 actinospore in worm samples. We considered the minimum level of infection (constituting a positive sample) in the worm host to be the minimum unit of parasite development, i.e. 8 actinospores (1 pansporocyst). In a QPCR assay, 10 actinospores presented Ct values of approximately 30–33. The assay indicated that a worm would need to ingest and contain at the time of sampling in excess of 100 myxospores to present a similar value, which we deemed to be an unlikely situation. Thus, we determined that worm samples presenting Ct values less than 35 represented infected individuals. In fry samples from both the dosage exposure experiment and the spiked experiment, less than 10 actinospores were not detected. Since this quantity of parasite is sufficient to result in infection in the fish host (Markiw, Reference Markiw1992), fry samples presenting any Ct value (in duplicate) were considered positive for M. cerebralis.
Management strategies
Control measures for M. cerebralis have included manipulation and treatment of water to render spores unviable, reduction or elimination of the habitat of the invertebrate host, and selective stocking of fish (less susceptible strains, larger fish). However, most of these approaches are more applicable to aquaculture (Wagner, Reference Wagner, Bartholomew and Wilson2002). In natural environments, understanding the relationship of various abiotic parameters and their effect on the life-cycle of M. cerebralis may be exploited. Other studies have established the relevance of temperature and habitat type, and our study demonstrates that water flow rate has a significant effect on the propagation of M. cerebralis and its impact on its fish host. Thus, in a system where water release is managed e.g. by dams or draw-off for agriculture or other uses, manipulation of flow may be used to reduce effects of the parasite. This was suggested by Vincent (personal communication), who proposed the use of higher water flows during critical periods in a trout's life-history to reduce infection intensities below the critical level for fish population damage. Our study supports this and suggests that even small increases in flow in critical low-flow habitats should significantly reduce infection in both hosts.
Conclusions
The death of 1 stray infected salmonid upstream of susceptible worms and fish is sufficient for establishment of M. cerebralis in the systems we studied. Habitats with lower water flow promote higher prevalence of infection (and thus parasite production) and greater proliferation of its invertebrate host leading to greater severity of infection in fish. Water flow may be exploited to reduce intensity of infection to a level where fish populations are not impacted.
We appreciate the contribution of the following people to the success of this large project: Donald Stevens helped design and construct the experimental flow tanks, the filtration pump system and fry incubator tanks; Lindsey Osborn assisted with filtering; Jenny Dubanoski performed the DNA extractions and QPCR on the fry and half-heads; Harriet Lorz ordered the rainbow trout eggs and guided the preparation of the half-heads; Kyle Thames and Stephen Atkinson prepared the reference samples; Sarah Bjork, Lan Xue and Ted Ernst assisted with the statistical analyses. This project was funded by the National Partnership for the Management of Wild and Coldwater Fishes, Whirling Disease Initiative. We appreciate the detailed input by the journal reviewers.