Introduction
Some animal data have shown that the Gunn rat, a mutant with chronic unconjugated bilirubin (UCB) high levels due to a genetic deficiency in glucuronyl transferase, may represent an interesting animal model for schizophrenia (SCZ).Reference Hayashida, Miyaoka and Tsuchie 1 These rats are subjected to chronic microglial activation due to UCB toxicity, which may contribute to behavioral and neuropathological changesReference Liaury, Miyaoka and Tsumori 2 that might be attenuated by antipsychotics, in a similar way to what happens in human patients with SCZ.Reference Tsuchie, Miyaoka and Furuya 3
On the other hand, some human data shown that Gilbert’s syndrome, a common genetic deficiency of the enzyme uridine 5′-diphospho-glucuronosyltransferase 1, that is found in up to 10% of the general population, may reach the double of its prevalence among patients with SCZ.Reference Bosma, Chowdhury and Bakker 4 Indeed, UCB high levels in early infancy, has been associated with later diagnoses of mental disordersReference Soorani-Lunsing, Woltil and Hadders-Algra 5 – Reference Bhutani and Wong 7 even when other obstetric risk factors are excluded.Reference Dalman and Cullberg 8 Follow-up studies of those exposed children have shown a higher risk for SCZ,Reference Jones, Rodgers and Murray 9 , Reference David, Malmberg and Lewis 10 and patients with SCZ with higher rates of UCB have presented a positive correlation between the UCB levels and the so called positiveReference Miyaoka, Yasukawa and Mizuno 11 and negative symptomsReference Powell and Hansen 12 in SCZ. It has also been reported that individuals with SCZ showed significantly higher UCB levels especially when acutely psychotic.Reference Miyaoka, Seno and Itoga 13 , Reference Bach, Kindler and Strik 14 Confirming these clinical data, there is an important volume of research suggesting that UCB has some neurotoxic effect on brain development and may play a role in brain tissue connectivity changes,Reference Falcão, Silva and Pancadas 15 , Reference Fernandes, Falcão and Abranches 16 an idea that is consistent with neuroimaging studiesReference Yasukawa, Miyaoka and Mizuno 17 in SCZ patients. More recent investigations have suggested that schizophrenic patients may have higher UCB levels when compared with patients with bipolar disorderReference Radhakrishnan, Kanigere and Menon 18 – Reference Pradeep, Acharya, Radhakrishnan and Srinivasan 20 and schizoaffective (SAF) disorder, even among individuals with UCB mean levels in normal range.Reference Gama Marques, Tinoco and Pedro 21 , Reference Gama Marques, Pedro and Ouakinin 22
As we stated in a very recent systematic review, regarding this topic, we believe there is a great potential in the research of UCB as a biological marker for SCZ spectrum disorders. UCB is likely implicated in many different stages of the progression of the syndrome and it could contribute to some of the central nervous system increased susceptible to neurodevelopmental injuries. It is therefore important to analyze its hypothetical role as a biological risk factor, linked with psychotic acute phases, thus making it eligible as a possible tool for early diagnosis, subsequent follow-up and even a target for new treatment strategies.Reference Pommerening Dornelles, Gama Marques and Ouakinin 23
In this study, our main objective is to assess patients suffering from acute psychosis, trying to understand if UCB mean levels may have any potential interest as a biomarker in both categorical nosological axis (SCZ vs. SAF disorder) and a severity axis (relapse vs. partial remission). Our first hypothesis is that UCB levels will be higher in patients with SCZ than in patients with SAF disorder. Our second hypothesis is that UCB levels will be higher during relapse (at ward admission) versus partial remission (at outpatient appointment), after follow-up, independently of the diagnosis of SCZ or SAF disorder.
Materials and Methods
Our study was an observational longitudinal study, with 2 assessments in 1-year time-span (2016–2017). The first assessment occurred during relapse of psychosis at the psychiatric ward admission and the second assessment during partial remission of psychosis at the outpatient appointment.
Our inclusion criteria looked for all patients with acute psychosis under the diagnosis of SCZ or SAF disorder (F20.X or F25.X ICD10 criteria), with age between 18 and 65 years old, admitted to our psychiatric ward. Exclusion criteria were hepatic, hemolytic, or cholestasis-related condition detected through blood sample analyses, as well as any important changes in lactate dehydrogenase (LDH), aspartate transaminase (AST), alanine transaminase (ALT), gamma-glutamyl transferase (GGT) values, or positive tests for hepatitis C virus (HCV) or hepatitis B virus (HBV) infection. Substance-related psychosis like cannabinoids, amphetamines, cocaine and heroin, and psychoactive substances use was detected through urine sample analyses for both assessments. Organic central nervous system disorder-related psychosis was detected in routine single computed tomography (CT) brain scan and/or routine repeated electroencephalography (EEG). As controls, we used admitted patients with acute bipolar disorder (F31.X ICD10 criteria) paired for age and sex. All patients included were able to understand and sign informed consent. Scientific and ethical approval was obtained at local Scientific and Ethical Boards and the investigation was developed according to the Declaration of Helsinki.
Sociodemographic and clinical variables collected for our patients were age, gender, occupation, education years, smoking pack-year (SPY), use of contraceptive pill, body mass index (BMI), family history of psychiatric disorder (number of affected kin), duration of psychiatric disorder (years), duration of untreated psychosis (DUP, years), mean length of stay (MLS, days) at psychiatric ward, and psychiatric medication (chlorpromazine equivalents).
Biochemistry study included calculated UCB serum levels (UCB = total bilirubin − direct bilirubin). Fasting blood samples were collected after a restful night and before breakfast, for both assessments, using vacuum S-Monovette Serum Gel Z/4.9 mL (Sarstedt AG&Co) and our analytic method was 2,4-dicloroaniline photometry. Our laboratory used hardware system ABX Pentra 400 (Horiba Group) and software system was SISLAB (Glintt).
Psychopathological instruments used were Clinical Global Impression (CGI)Reference Guy 24 for general clinical severity and Positive and Negative Syndrome Scale (PANSS)Reference Kay, Fiszbein and Opler 25 for psychosis severity. The CGI measures symptom severity and it is widely used to measure treatment response and the efficacy of treatments in studies of patients with mental disorders. It is a 7-point scale that requires the clinician to rate the severity of the patient’s illness at the time of assessment, relative to the clinician’s past experience with patients who have the same diagnosis, with possible ratings from 1 “Normal, not at all ill” up to 7 “Among the most extremely ill patients.” The PANSS is a medical scale used for measuring symptom severity of patients with SCZ. It is widely used in the study of antipsychotic therapy and it is usually accepted as the golden standard that all assessments of psychotic behavioral disorders should follow. The patient is rated from 1 “absent” to 7 “extreme” on 30 different symptoms based on the interview as well as reports of caretakers; therefore, its total score ranges from 30 to 210.
Psychosocial instruments used were Global Assessment of Functioning (GAF)Reference Endicott, Spitzer, Fleiss and Cohen 26 and Personal and Social Performance (PSP)Reference Morosini, Magliano, Brambilla, Ugolini and Pioli 27 for social functioning assessment. GAF is a numeric scale used by mental health technicians to rate subjectively the social and occupational functioning of an individual, from 1 “severely impaired” to 100 “extremely high functioning.” The PSP is a 100 points rating scale, with ratings being based mainly on the assessment of patient’s functioning in 4 main areas: (a) “socially useful activities”; (b) “personal and social relationships”; (c) “self-care”; and (d) “disturbing and aggressive behaviors,” on a 6-point scale from “absent” to “very severe.”
All scales used in our protocol were translated and validated for Portuguese language.Reference Lima, Soares and Paoliello 28 – Reference Brissos, Palhavã and Marques 31
For the SCZ and SAF patient groups, all quantitative variables were summarized through descriptive statistics. This analysis included socio-demographics characterization as well as the previously described biological, psychopathological, and psychosocial variables.
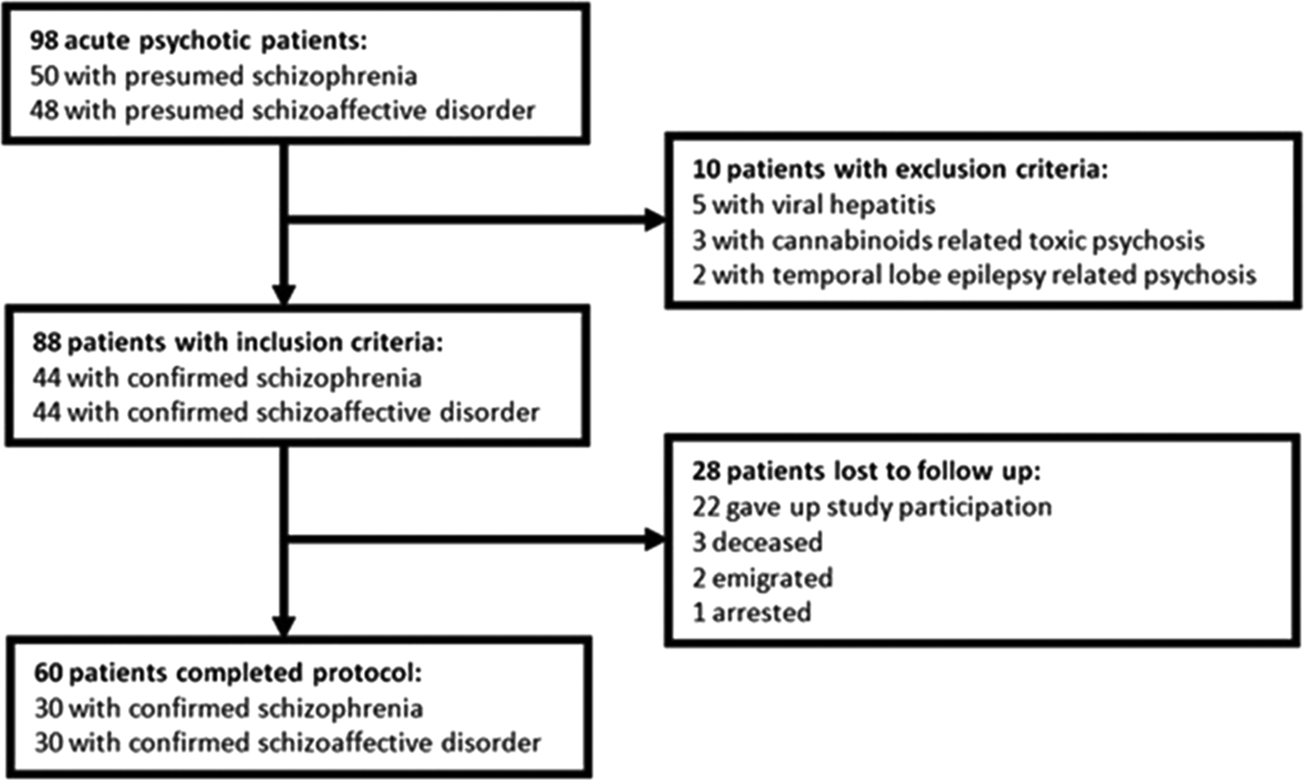
Statistics were performed using the Statistical Package for the Social Sciences software, 25th version. Our complete protocol was discussed with international reviewers and is freely available online.Reference Gama Marques and Arantes-Gonçalves 32 Patient data collection process is summarized in Figure 1.
UCB mean levels prospective study: patient data collection.

Results
First assessment (relapse at ward admission)
We had an initial number of 98 candidate patients in our study: 48 with presumptive diagnosis of SCZ and 50 with presumptive diagnosis of SAF disorder. We lost 10 patients because of exclusion criteria: 5 had at least 1 blood sample positive for HBV and/or HCV virus; 3 had at least 1 urine sample positive for cannabinoids; and 2 had at least 1 EEG exam suggesting temporal lobe epilepsy. These excluded patients received new appropriate diagnosis and treatment and were referred to specific outpatient consultations after discharge from admission, namely gastroenterology, addiction, and neurology services, respectively. The remaining 88 patients had no changes at all on their first blood and urine samples, EEG exam, and CT brain scan, so they were included in our study for follow-up.
At the end of the first assessment (relapse; at ward admission), we included 88 patients (44 with confirmed diagnosed of SAF disorder and 44 with confirmed diagnosis of SCZ). Although there was a higher prevalence of male patients in the group of patients with SCZ versus the group of patients with SAF disorder, there was no statistically significant difference between groups. Other variables like age, education, family psychiatric history (FPH), smoking pack years (SPY), and DUP also did not show statistically significant differences between the 2 groups. No female patient was taking oral anticonception pill during our study. General demographic data for the 88 patients that completed our first assessment is resumed in Table 1.
General demographic data (first assessment).

Abbreviations: FPH, family psychiatric history; DUP, duration of untreated psychosis; SPY, smoking pack years.
Regarding all clinical variables at first assessment (relapse; at ward admission), we did not find any statistically significant differences between patients with SCZ (N = 44) and SAF disorder (N = 44). General clinical data for the 88 patients that completed our first assessment is resumed in Table 2.
Clinical data (first assessment).

Abbreviations: CGI, Clinical Global Impression; CPZE, chlorpromazine equivalent; GAF, Global Assessment of Functioning; PANSS, Positive and Negative Syndrome Scale; PSP, Personal and Social Performance.
Regarding these 88 patients who completed the first assessment, we compared (ANOVA) the mean UCB levels between our 2 groups (44 patients with SCZ and 44 patients with SAF disorder) versus our control group (44 patients with bipolar disorder) and found a statistically significant difference (p = .002). After performing Bonferroni post hoc multiple comparisons, we found statistically significant differences between the 44 patients from the group with SCZ and the other 2 groups, namely the 44 patients from the group with SAF disorder (p = .05) and the 44 patients from the control group with bipolar disorder (p = .05). We found no statistically significant difference between the 3 groups for other variables such as sex, age, or MLS at the psychiatric ward (Table 3).
Mean UCB mean levels comparisons ANOVA (first assessment).

Abbreviations: MLS, mean length of stay; UCB, unconjugated bilirubin.
a p = .05.
b p = .05.
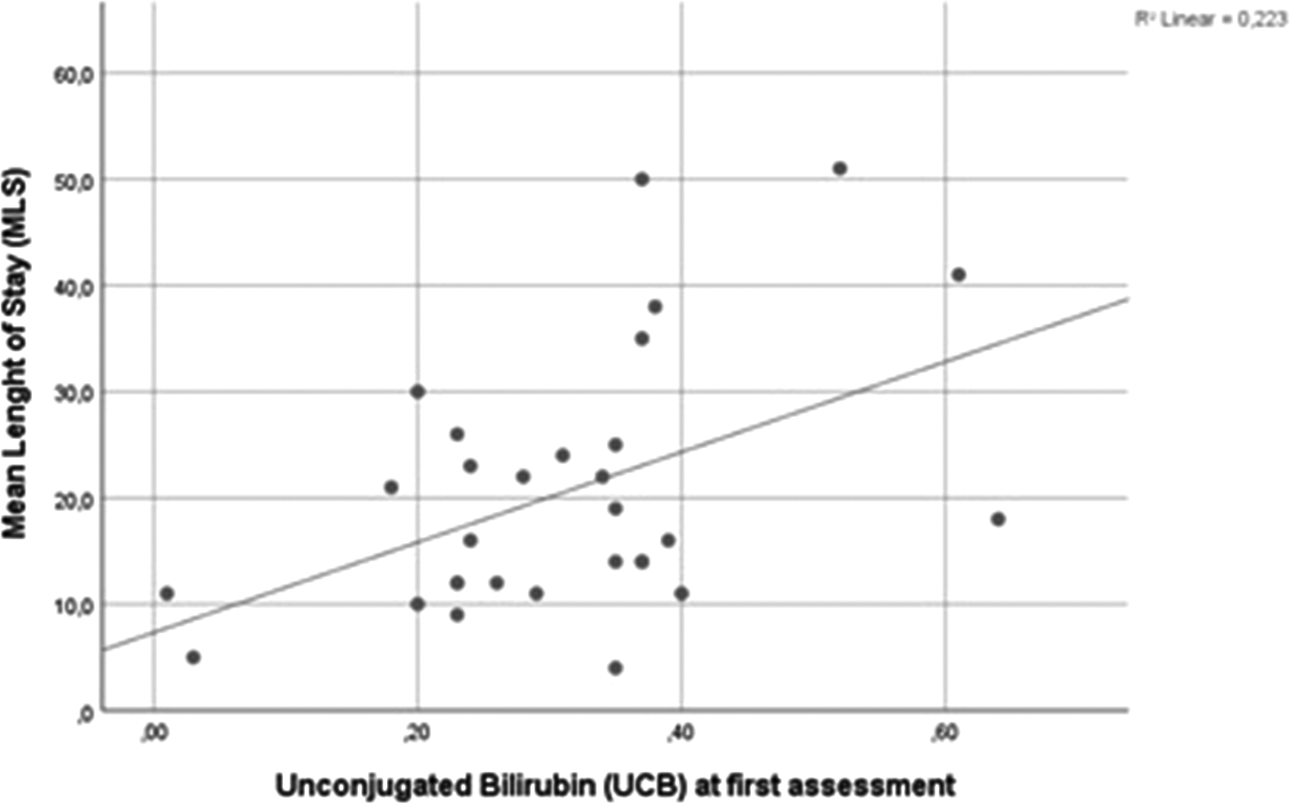
Regarding correlations between psychopathological, psychosocial scales, and laboratory data on patients who completed the first assessment (N = 88), we only found a positive correlation (Pearson’s r = .314; p = .01) between UCB mean levels and PSP item (d) “disturbing and aggressive behaviors.” When looking for linear regression models for UCB and all other variables, separately among the 2 groups of patients (SCZ and SAF disorder), we were able to find a positive correlation (R 2 = .223), with statistically significance (p = .008), between the UCB mean level at first assessment (admission) in patients with SAF disorder who completed full protocol (N = 30) and MLS (Figure 2).
Linear regression: UCB at first assessment and MLS in schizoaffective disorder (p = .008).

Second assessment (partial remission at outpatient appointment)
From the 88 patients initially included in our study (44 with diagnosis of SCZ and 44 with diagnosis of SAF disorder), we lost 28 patients: 22 quit the study before doing the second assessment (outpatient appointment); 3 died (stroke, acute renal failure and suicide by hanging); 2 traveled to live in another country; and 1 was arrested for criminal behavior. The remaining 60 patients had no changes at all on at least 2 blood and 2 urine samples, 2 EEG exams, and 1 CT brain scan so they were included on the final phase of data analysis.
Although there was a higher prevalence of male patients in the group of patients with SCZ versus the group of patients with SAF disorder, there was no statistically significant difference. Other variables like age, education, FPH, SPY, and DUP did not show statistically significant difference between the 2 groups. The median follow-up time for all sample (N = 60) was 398 ± 164 days; namely 392 ± 159 days for patients with SCZ (N = 30) and 405 ± 172 days for patients with SAF disorder (N = 30), without statistically significant difference. General demographic data for the patients that completed full protocol (both first and second assessment) versus patients who were lost to follow-up is resumed in Table 4.
General data (second assessment).

Abbreviations: DUP, duration of untreated psychosis; FPH, family psychiatric history; MFU, median follow-up; SPY, smoking pack years.
We found clinical improvement between the first assessment (relapse at ward admission) and second assessment (partial remission at outpatient appointment) for psychopathological (CGI and PANSS) and psychosocial scales (GAF and PSP). We found a statistically significant difference (p < .0001) between the first assessment (relapse at ward admission) and second assessment (relapse at ward admission) on both groups (SCZ, N = 30); and SAF disorder (N = 30) for psychopathological (CGI and PANSS) and psychosocial scales (GAF and PSP). General clinical data for the patients that completed full protocol, both first and second assessment, is resumed (Table 5).
General clinical data, paired samples t test (first and second assessments).

Abbreviations: CGI, Clinical Global Impression; GAF, Global Assessment of Functioning; PANSS, Positive and Negative Syndrome Scale; PSP, Personal and Social Performance.
abcdefgh p < .0001.
Regarding these 60 patients who finished our full protocol, we compared (ANOVA) the mean UCB levels at the first assessment between the 2 groups (SCZ, N = 30; and SAF disorder, N = 30) and the control group (bipolar disorder, N = 30), and found a statistically significant difference (p = .006). After performing a Bonferroni post hoc multiple comparison, we found statistically significant difference between the first assessment (relapse at ward admission) of patients with SCZ (N = 30) and the unique assessment (relapse at ward admission) of patients with bipolar disorder (N = 30; p = .05).
Regarding these 60 patients who finished our full evaluation protocol, we compared the mean UCB levels at the second assessment (outpatient appointment) between the 2 groups (SCZ, N = 30; and SAF disorder, N = 30; ANOVA) and found a statistically significant difference (p = .006). After performing a Bonferroni post hoc multiple comparison, we found statistically significant difference between the second assessment (partial remission at outpatient appointment) of the 30 patients with SCZ and the second assessment (partial remission at outpatient appointment) of the 30 patients with SAF disorder (p = .05). Performing a paired samples t test for these 60 patients from the 2 groups who completed the full protocol, we only found a statistically significant difference between the UCB mean levels at the first assessment (relapse at ward admission) and the UCB means levels at the second assessment (partial remission at outpatient appointment) in the group of 30 patients with SAF disorder (p = .034; Table 6).
Mean UCB mean levels comparisons ANOVA and paired samples t test (first and second assessment).

Abbreviations: MLS, mean length of stay; UCB, unconjugated bilirubin.
a p = .05.
b p = .05.
c p = .034.
Looking at correlations between psychopathological, psychosocial scales, and laboratory data on patients who completed the second assessment (N = 60), we only found a negative correlation between UCB mean levels and PANSS item G30 “psychomotor retardation” (Pearson’s r = −.399; p = .002).
Laboratory data is resumed for bilirubins (Table 7), liver function (Table 8), and metabolic syndrome (Table 9). There were no statistically significant differences for all these variables, except for the already mentioned UCB mean levels between first (relapse at ward admission) and second assessment (partial remission at outpatient appointment), among patients with SAF disorder.
Bilirubin laboratory data, paired samples t test (first and second assessment).

Abbreviations: CB, conjugated bilirubin; TB, total bilirubin; UCB, unconjugated bilirubin.
a p = .034.
Liver function laboratory data, paired samples t test (first and second assessment).

Abbreviations: ALT, alanine transaminase; AST, aspartate transaminase; GGT, gamma-glutamyl transferase.
Metabolic syndrome laboratory data, paired samples t test (first and second assessment).

Abbreviations: BGL, blood glucose level; BMI, body mass index; Col, cholesterol; TAG, triacylglyceride.
Regarding inflammation parameters (Table 10), we only found a statistically significant difference (p = .033) between creatine kinase (CK) mean levels in patients with SCZ with higher levels at first assessment (relapse at ward admission) 213.0 ± 297.2 mg/dL versus second assessment (partial remission at outpatient appointment) 106.5 ± 74.4 mg/dL.
Inflammation laboratory data, paired samples t test a (first and second assessment).

Abbreviations: CPR, C-reactive protein; LDH, lactate dehydrogenase; CK, creatine kinase.
a p = .033.
Discussion
Our study results suggest that both of our experimental hypotheses might be true. First, we confirmed that UCB mean levels are statistically significantly higher (p = .05) in relapsing psychotic patients with SCZ (N = 44; 0.38 ± 0.18 mg/dL) than in relapsing psychotic patients with SAF disorder (N = 44; 0.30 ± 0.13 mg/dL). This outcome gives us some insight on the possible role of UCB as a biomarker for categorical distinction between SCZ and SAF disorder, during an acute psychotic state, as described in our previous works. We also confirmed that UCB mean levels are statistically significantly higher (p = .05) in remitting patients with SCZ (N = 30; 0.34 ± 0.16 mg/dL) than in remitting patients with SAF disorder (N = 30; 0.25 ± 0.10 mg/dL). This outcome gives us some insight on the possible role of UCB as a biomarker for categorical distinction between SCZ and SAF disorder, during the partial remission of an acute psychotic state, and that is, to the best of our knowledge, the first time these kind of data are published. Secondly, we confirmed that UCB mean levels are higher in patients with SCZ (N = 30) on relapse (0.38 ± 0.19 mg/dL) versus partial remission (0.34 ± 0.16 mg/dL). We believe we failed to find a statistically significant difference for SCZ patients just because of our small sample size. Nevertheless, we confirmed that UCB mean levels are statistically significantly higher (p = .034) in patients with SAF disorder (N = 30) on relapse (0.31 ± 0.14 mg/dL) versus partial remission (0.25 ± 0.10 mg/dL), and that is, to the best of our knowledge, the first time this kind of data is published. This outcome gives us some insight on the possible role of UCB as a biomarker for a dimensional distinction in SAF disorder.
Besides our main objective, we were also able to notice new interesting findings. We found, for the first time, through a linear regression model applied separately for patients with SCZ and patients with SAF disorder, a statistically significant (p = .008) positive correlation (R 2 = .223) between UCB mean levels at admission and MLS in patients with SAF disorder (N = 30) suggesting that UCB may have a potential role as a biomarker for admission duration, which is widely accepted as an indirect indicator of psychosis severity. Our study was the first one to date, to the best of our knowledge, looking for a correlation between UCB mean levels and psychosocial performance (GAF and PSP). Although we did not found any correlation between UCB mean levels and GAF scale, we were able to describe, for the first time, a positive Pearson’s correlation (r = .314) with significant statistically meaning (p = .01), between UCB mean level of relapsing patients (N = 88) at the first assessment (admission) and 1 of the 4 items of PSP, the PSP item (d) “disturbing and aggressive behaviors.” Last but not least, we have also found a new negative Pearson’s correlation (r = −.399), with significant statistically meaning (p = .002), between the UCB mean level of remitting patients (N = 60) at the second assessment (outpatient appointment) and 1 of the thirty items on PANNS item G7 “psychomotor retardation.”
Interestingly enough, these 2 outcomes bring new insight to a new role of UCB level as an eventual biomarker for psychomotor agitation, both in the categorical spectrum (SCZ and SAF disorder) and the severity spectrum (relapse at admission and partial remission at outpatient appointment). One could say that psychomotor agitation could be causing changes in UCB levels, but that hypothesis is clearly excluded as we found no Pearson’s correlation between hemolysis biomarkers (eg, LDH) and rhabdomyolysis biomarkers (eg, CK). The statistically significant decrease (p = .03) of CK levels in patients with SCZ (N = 30) from the first assessment (213.0 ± 297.2 mg/dL) to the second assessment (106.5 ± 74.4 mg/dL) seem to be an independent epiphenomenon, probably secondary to the expected clinical improvement on psychomotor agitation but not contributing at all to the already mentioned Pearson’s correlations.
There are 2 important limitations we need to acknowledge. The first one is that patients with SAF disorder may be present with different clinical subtypes or with a high psychopathological diversity (eg, depressive, manic, mixed episodes). The second limitation is that patients with SAF disorder usually also take mood stabilizers more frequently than patients with SCZ. Unfortunately, we were not able to make this kind of assessment in our patients. Nevertheless we believe these 2 important limitations shall be addressed in future.
The biggest limitation of our study was the small sample size but we are also aware of other problems that should have been discussed, eg it would have been important to have: genetic tests to exclude Gilbert syndrome; cerebrospinal fluid analysis to exclude encephalitis; a more specific EEG analysis; or even a more sensitive brain scan with functional magnetic resonance imaging.
Conclusion
UCB seems to be a serious candidate for biomarker in the schizophrenia–schizoaffective–bipolar spectra. We believe that further similar studies with bigger samples will have more statistical power, yielding possibilities for replication of our results and, possibly, even more groundbreaking findings. There is some potential for other researchers to explore UCB as a biomarker for psychosis. Last but not least, we would like to propose an adaptation from a previous simple tridimensional model of oursReference Gama Marques and Ouakinin 33 (Figure 3) that might be useful for studying the role of other biomarkers candidates in psychotic spectrum disorders. This model includes a categorical axis from affective to nonaffective psychosis; a dimensional axis from personality to psychosis; and a biomarker axis from remission to relapse.
UCB as biomarker in the psychotic spectra tridimensional model.

Acknowledgments
The authors would like to thank Professor José Novais Magalhães (Instituto Superior de Gestão e Economia, Lisboa, Portugal) and Professor Filipe Leote (Instituto Português de Línguas, Lisboa, Portugal) for their precious help with the statistics.
Disclosure
João Gama Marques and Sílvia Ouakinin have nothing to disclose.