Introduction
Conservation agriculture utilizes strategies that minimize soil disturbance, combined with crop rotations or permanent plant cover to reduce soil erosion/run off and promote a more sustainable and environmentally-friendly system. For instance, integrating cover crops into the system could lead to reduced nutrient application, decreased soil erosion, improved water or gas infiltration, altered soil microbial structures and abundancies, decreased nutrient losses, increased carbon sequestration and improved pest suppression and/or crop productivity (McDaniel et al., Reference McDaniel, Tiemann and Grandy2014; Moore et al., Reference Moore, Wiedenhoeft, Kaspar and Cambardella2014).
One vital service provided by cover cropping is mitigating N losses, thereby minimizing N pollution and increasing crop productivity (Schomberg et al., Reference Schomberg, Steiner and Unger1994; Strock et al., Reference Strock, Porter and Russelle2004; Tonitto et al., Reference Tonitto, David and Drinkwater2006). Nitrogen management is especially challenging due to its complex cycle involving various chemical forms, transformation processes and pathways of loss within agroecosystems as well as relatively high-crop demand. By taking up soil mineral nitrogen (SMN) within plant tissues and promoting immobilization (in 't Zandt et al., Reference in 't Zandt, Fritz and Wichern2018), cover crops function effectively to mitigate the risk of N losses during fallow seasons (Pantoja et al., Reference Pantoja, Woli, Sawyer and Barker2016). Therefore, cover crops can reduce nutrient leaching losses by 70% on average as described in a meta-analysis of 18 studies (Tonitto et al., Reference Tonitto, David and Drinkwater2006). Despite the limited adoption of cover crops in past decades (Carlson and Stockwell, Reference Carlson and Stockwell2013; Roesch-McNally et al., Reference Roesch-McNally, Basche, Arbuckle, Tyndall, Miguez, Bowman and Clay2018), there is increased interest by farmers to integrate cover crops and other conservation practices into their system with the goal of improving N retention and soil quality (Lee et al., Reference Lee, Yeo, Sadeghi, McCarty, Hively and Lang2016; Pantoja et al., Reference Pantoja, Woli, Sawyer and Barker2016; Roesch-McNally et al., Reference Roesch-McNally, Basche, Arbuckle, Tyndall, Miguez, Bowman and Clay2018).
The efficacy of fall cover crops is dependent on the planting date, rate of N accumulation over the fallow season, N retained over the winter and N mineralization, which are all related to soil temperature and water content, soil drying/wetting, freezing/thawing process and other regional environment conditions. An early cover crop seeding date may be critical for plants to establish, accumulate biomass and uptake nutrient (Ritter et al., Reference Ritter, Scarborough and Chirnside1998; Odhiambo and Bomke, Reference Odhiambo and Bomke2007; Björkman et al., Reference Björkman, Lowry, Shail, Brainard, Anderson and Masiunas2015), which influences SMN available for loss. The planting date can influence subsequent crop yields, altering N recovery, soil moisture, soil erosion and other soil physio-biological-chemical properties (Edwards and Burney, Reference Edwards and Burney2007; Anugroho et al., Reference Anugroho, Kitou, Nagumo, Kinjo and Tokashiki2009; Farsad et al., Reference Farsad, Randhir, Herbert and Hashemi2011; Hashemi et al., Reference Hashemi, Farsad, Sadeghpour, Weis and Herbert2013). For instance, delaying cover crop planting by 1 month in the fall can reduce plant N accumulation by 100 kg N ha−1 (Ritter et al., Reference Ritter, Scarborough and Chirnside1998). In addition, cover crop species vary greatly in terms of growth response to, soil moisture and temperature conditions, length of daylight and growing period, soil nutrient status, soil texture and penetration resistance plus other related environmental factors. Few published reports from temperate climates compared the growth of various common cover crop choices planted at multiple dates though the growing season (Björkman et al., Reference Björkman, Lowry, Shail, Brainard, Anderson and Masiunas2015; Lawson et al., Reference Lawson, Cogger, Bary and Fortuna2015; Van Eerd, Reference Van Eerd2018). Therefore, information on how cover crop and planting date in a humid, temperate climate will influence crop productivity along with their effects on soil N is essential.
Likewise, there are few field studies that examined both cover crops and planting dates and their interactive effects on soil and plant N dynamics (Farsad et al., Reference Farsad, Randhir, Herbert and Hashemi2011; Hashemi et al., Reference Hashemi, Farsad, Sadeghpour, Weis and Herbert2013; Lawson et al., Reference Lawson, Cogger, Bary and Fortuna2015; Van Eerd, Reference Van Eerd2018); information about cover crop effects on N cycling remains unclear, especially in short-season vegetable rotations in Ontario. We intended to fill the knowledge gaps on optimum cover crop management that results in reduced N losses and increased N cycling.
A 2-year field experiment was conducted in a cover crop-cucumber system. We used cover crop treatment [5 species, 1 management treatment (rye biomass removal in spring (rye-Rem)) with 2 fallow no cover crop controls (NoCCs)] and planting date (early and late) to investigate their combined effects on soil N dynamics and cucumber crop yield. The aims of this study were to evaluate (1) if an earlier cover crop planting date leads to greater N retention in the fall and following spring compared to later planting; (2) which combination of cover crop and planting date would lower SMN concomitant with greater plant N accumulation and thereby mitigate potential N losses in the non-growing season and (3) to what extent do interactions between planting date and plant species impact N dynamics and crop productivity in following season. We also predicted that greater soil N retention in response to early planting date and cover crop type would correspond to less SMN available for losses in the non-growing season and increased plant available nitrogen (PAN) in the following growing season, which would impact crop yields. We predicted that legume cover crops, based on biological N fixation, would provide a greater N supply to the following crop and thus greater yields.
Materials and methods
Experimental site and design
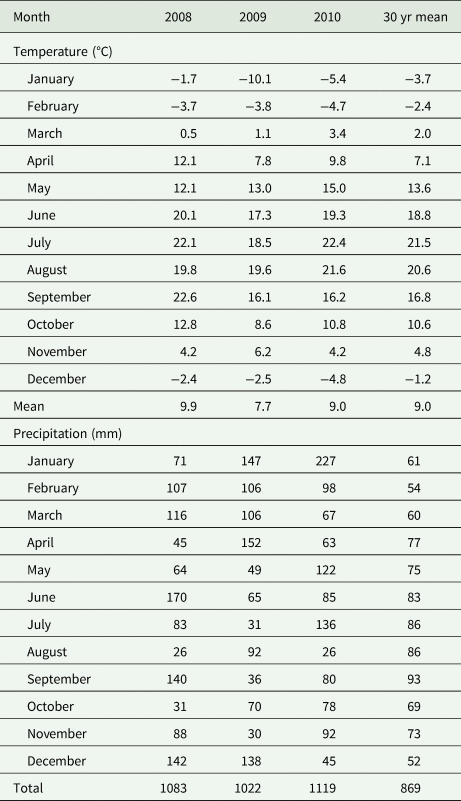
The experiment was conducted in 2008 to 2010 at the University of Guelph, Ridgetown Campus (42o46′N latitude, 81o89′W, longitude), Ontario, Canada. Air temperature and precipitation weather data were collected at the Ridgetown Environmental Canada weather station located ~1 km from the experimental site (Table 1). Surface soil (15 cm depth) was sandy loam [75% sand, 18% silt and 7% clay (according to hydrometer method)] with average (±SE) soil properties of pH 5.7 ± 0.06 (1:1 v/v method), 3.6 ± 0.10 organic matter (modified Walkley Black method), cation exchange capacity of 8.67 ± 0.37 and nutrient concentrations of P, K, Ca and Mg of 44 ± 4.62, 199 ± 26.5, 822.3 ± 54.44 and 61 ± 9.00 mg kg−1, respectively. The experiment was a partial split-plot arranged in a randomized complete block design with four replications in a cucumber-cover crop-cucumber rotation. The main- and split-plot effects were cover crop treatment and cover crop planting date, respectively. The cover crop treatments included oilseed radish (OSR), forage pea (pea), hairy vetch (vetch), oat, winter cereal rye (rye), rye with spring biomass removal (rye-Rem) and a NoCC, as well as a NoCC with a N treatment (NoCC + N) of 84 kg N ha−1 of calcium ammonium nitrate (27-0-0) broadcast applied and incorporated prior to the main crop (cucumber).
Monthly mean air temperature (°C), monthly total precipitation (mm) and 30-year mean at the Ridgetown, Ontario, Canada, in 2008 to 2010

Cover crop season
Following main crop harvest in 2008 and 2009, the trial area was sprayed with glyphosate at 810 g a.e. ha−1, ~3 days later the crop was stock chopped and cultivated. Early cover crop planting occurred 5 to 10 days after cultivation (depending on soil moisture conditions) and the late planting was approximately 1 month later. The early and late cover crop planting dates occurred on 7 August 2008 and 12 August 2009, 8 September 2008 and 9 September 2009, respectively. Oat, OSR, pea, rye and vetch were planted with an International conventional drill at 81, 13, 224, 134 and 28 kg ha−1, respectively with no fertilizer application. The NoCC treatments were kept weed free in the fall by manually hoeing. Each split plot measured 9 m by 9 m and NoCC and NoCC + N plots were 4.5 m by 9 m.
Soil and plant aboveground biomass (described below) were collected 1, 2 and 3 months after early planting (i.e. early September, early October and early November). The following spring on 16 April 2009 and 27 April 2010, soil and plant biomass (residues remaining) were sampled. Differences in the date of spring sampling and field operations were due to differences in weather and soil conditions (Table 1), which delayed field work in 2010.
To determine the impact of rye biomass on cucumber yield and N dynamics, the rye plots were further split (9 m × 4.5 m) to remove rye biomass (rye-Rem). The intention was to apply this removal treatment to vetch (i.e., both overwintering species) but there was not enough spring growth to warrant removal. On 27 April 2009 and 10 May 2010, rye aboveground biomass was cut and removed with a bagged lawnmower; total fresh and dry weights were taken.
Cucumber season
Glyphosate was applied at 810 g a.e. ha−1 to the entire trial area terminate rye, vetch and any weeds present. The entire trial area was disked and cultivated to incorporate plant residues at least two weeks prior to cucumber planting. Soil sampling occurred prior to cover crop incorporation (13 May 2009 and 10 May 2010) as well as prior to cucumber planting (1 June 2009 and 1 June 2010). On 5 June 2009 and 2 June 2010 cucumber (cv. Lafayette) was planted at 131,000 seeds ha−1. Plant row and within row spacing was 76 and 10 cm, respectively. Cucumbers were grown according to commercial machine-harvested processing industry practices for P and K fertilizer (pre-plant broadcast incorporated 78 kg P2O5 ha−1, 101 kg K2O ha−1), pest management and other field practices (E.C. Roddy, OMAFRA Horticultural Specialist, personal communication), with the exception that fertilizer N was not applied to the entire trial area. Fertilizer N was only applied to the NoCC + N control treatment. Although the recommended N fertilizer rate for machine-harvested cucumber is 110 kg N ha−1 (Van Eerd and O'Reilly, Reference Van Eerd and O'Reilly2009), 84 kg N ha−1 was applied as suggested by industry professionals (E.C. Roddy, OMAFRA Horticultural Specialist, personal communication) due to a shorter machine-harvested cucumber growth cycle.
Soil and plant samples (5 plants in each split-plot) were collected prior to vine elongation (row closure) on 8 July 2009 and 1 July 2010 and at cucumber harvest. Cucumber harvest occurred on 27 July 2009 and 22 July 2010 when ~10% of the fruit were size grade 4 (Schultheis et al., Reference Schultheis, Wehner and Walters1998) by estimate. Harvest area was 2.5 × 3 m in each split-plot; where all fruits were hand-harvested to simulate a once-over machine harvest similar to Van Eerd and O'Reilly, (Reference Van Eerd and O'Reilly2009). The yield was expressed as Mg ha−1 fresh weight based on a harvest area.
Plant measurements
At each cover crop sampling date, biomass samples from two different randomly selected 0.5 m2 quadrats were taken within each cover crop split-plot. Sampling areas were flagged to avoid soil and biomass sampling in those sampled areas later in the season. Five cucumber plants were collected from each split-plot and plant population was used to convert values to kg ha−1. All plant biomass was dried at 60 °C, and dry weights were recorded. All plant biomass data were expressed as aboveground dry weight in kg ha−1, except cucumber yield was on a fresh weight basis. A representative dry plant sample was ground with a Wiley mill to pass a 2 mm sieve. Plant total N concentration was quantified by the dry combustion method (McGill and Figueiredo, Reference McGill, Figueiredo, Gregorich and Carter2008) using the LECO CN analyzer (LECO Corporation, St. Joseph, MI, USA). Plant N was calculated as kg N ha−1 based on total N concentration (%) multiplied by dry matter content per quadrat (cover crop biomass) or per plant (cucumber biomass).
Soil measurements
Soil samples were collected at the same time as plant biomass sampling. SMN (NO3−-N and NH4+-N) concentration was determined for each treatment by taking a composite soil sample from at least five 3.5-cm-diameter soil cores to a depth of 90 cm divided into four depths (0–15, 15–30, 30–60 and 60–90 cm). In the field each soil core increment was homogenized, sealed in a plastic bag and kept in a cooler prior to storage at −18 °C until analysis. Soil NO3−-N and NH4+-N were quantified using the Maynard et al. (Reference Maynard, Kalra, Crumbaugh, Gregorich and Carter2008) method, a KCl extraction with cadmium reduction and phenate method, respectively, and quantified on an autoanalyzer (SEAL AutoAnalyzer 3; Mequon, Wisconsin, USA). SMN was calculated as kg N ha−1 based on soil bulk density (7.5 cm ring) taken from each plot. Although some differences in NH4+-N existed between cover crop treatments in both cover crop seasons from August 2008/2009 to April 2009/2010, levels were below 5 kg N ha−1. Therefore, SMN was presented as the sum of NO3−-N and NH4+-N to the 90 cm soil depth.
Plant available N
Both soil and plant N quantity are needed to gain a better understanding of N dynamics. The NoCC controls did not have plant N (i.e., no cover crops were grown); therefore, PAN was calculated to allow for comparisons with all treatments. PAN was quantified as the sum of SMN content (kg N ha−1) in the top 60 cm of soil (assumed depth of the majority of crop roots) and N accumulation of the aboveground plant tissue (kg N ha−1). If there was no plant present at the time of sampling, PAN was equal to SMN to the 60 cm depth. Thus, PAN represents the quantity of N accounted for in the system at the time of sampling.
Statistical analyses
For all parameters, years were analyzed separately because the 2009/2010 season included two additional treatments, rye-Rem and NoCC + N. A split-plot analysis was used for all data. Data were analyzed using the MIXED procedure of SAS (SAS Version 9.1; SAS Institute, Cary, NC) with cover crop treatment, planting date and sampling time as fixed effects and block as the random effect. All variables were tested for normality using the UNIVARIATE procedure. Means separation was determined using the Tukey–Kramer multiple comparison procedure at the 0.05 probability level. Outliers were determined through the Shapiro–Wilk residual analysis. When outliers were present, they were removed from the analysis only if the results were significantly affected by their removal. When there was a significant sampling time interaction with cover crop treatment and/or planting date, data were presented for each sampling time separately. Data were pooled to show main effects when there were no interactions.
Results
Cover crop biomass and N accumulation
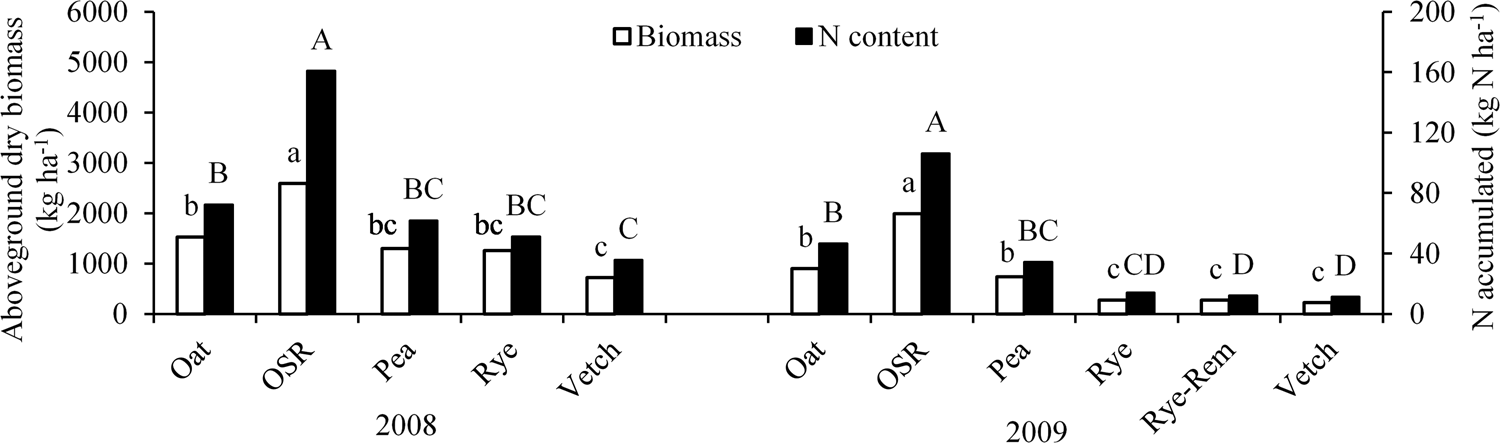
One month after planting, cover crop biomass and N accumulation ranged from 720 to 2600 kg ha−1 and 36 to 160 kg N ha−1 in 2008 and slightly less in 2009 with biomass of 220 to 2000 kg ha−1 with 11 to 110 kg N ha−1 (Fig. 1). Among the cover crops evaluated, OSR had the greatest aboveground dry biomass and N accumulation in both years (Fig. 1). In both years, both rye treatments and vetch had the least biomass and N accumulation 1 month after planting, which was indicative of slow emergence and growth. Both cover crop biomass and N accumulation followed the order of OSR > oat, pea, rye > rye-Rem, vetch. Consistent with N accumulation, there was 7 to 20 kg N ha−1 less SMN in plots with cover crops compared to the NoCC (P < 0.05) with no meaningful differences among the planted cover crops (P > 0.05) 1 month after planting.
Cover crop biomass (white bars, left axis, lower case letters) and N accumulation (black bars, right axis, upper case letters) in September 2008 (left) and 2009 (right) as affected by cover crop treatment. OSR, oilseed radish; rye-Rem, rye biomass removed. In each year and each parameter, cover crops with different letters were significantly different based on Tukey–Kramer means separation P < 0.05.

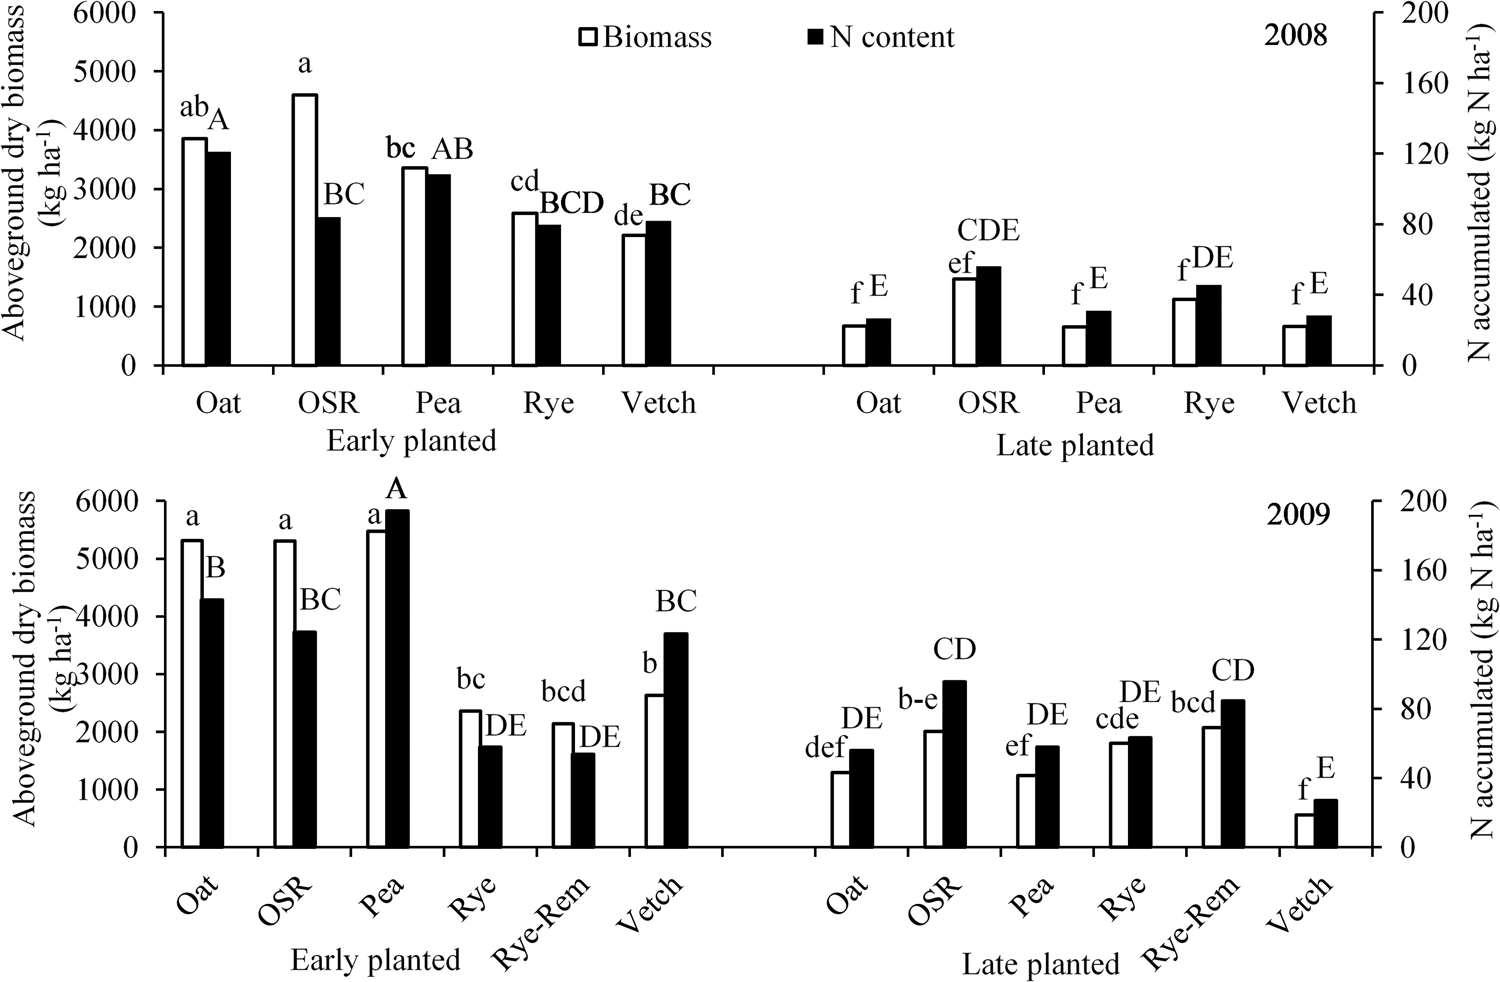
Later in the cover crop growing season, the lack of differences in cover crop biomass and N accumulation between the two autumn sampling dates (P > 0.05) suggests minimal growth or plant senescence occurred during the month between sampling. Therefore, data were pooled over October and November. In both years, all of the early-planted cover crops had greater biomass (2100–5500 kg ha−1) compared to the same cover crop planted a month later (560–1500 kg ha−1) with an exception of rye treatments in 2009, which did not differ between early and late plantings (Fig. 2). Similar to biomass, N accumulation was greater with early- than late-planted cover crops, except for OSR and rye, where there was no planting date effect.
Cover crop biomass (white bars, left axis, lower case letters) and N accumulation (black bars, right axis, lower case letters) pooled over October and November sample dates in 2008 (top) and 2009 (bottom). OSR, oilseed radish; rye-Rem, rye biomass removed. In each year and each parameter, cover crops with different letters were significantly different based on Tukey–Kramer means separation P < 0.05.

Among the early-planted cover crops, OSR and oat consistently in both years accumulated the most biomass and N (Fig. 2). Although rye had low biomass and N accumulation in the early plantings, it was similar to other cover crops in the late plantings. In contrast to early-planted cover crops, there were fewer or no differences in biomass and N accumulation among late-planted cover crops (Fig. 2). These results have implications for the ideal planting dates in temperate climates.
In the following spring, the quantity of oat, OSR and pea biomass (2310 to 2480 kg ha−1) in April 2009 was not different than the quantity measured in November 2009 (P < 0.05), indicating little decomposition over the 2008/2009 winter. Rye and vetch biomass (4300 and 3090 kg ha−1, respectively) was greater by April 2009 than the previous November (P > 0.05), reflecting the overwintering of these cover crops and indicative of growth between the two sampling times. In April 2010, similar quantities of biomass were observed as in April 2009 for oat, OSR (2100 to 2800 kg ha−1 respectively), rye and rye-Rem (4220, 4760 kg ha−1 respectively), except less biomass remained in the spring for vetch and pea (1620 and 452 kg ha−1, respectively). Biomass quantity and visual observations confirmed that vetch did not regrow in 2010. With the exception of rye, that overwintered and was growing in April, all other cover crops had less biomass in April 2010 than November 2009 (P < 0.05) indicating decomposition over the winter.
In April 2009 and 2010, the trend of N content in cover crop biomass and residues followed biomass trends (i.e., greater biomass equated to greater N content), which was in agreement with Reiss and Drinkwater (Reference Reiss and Drinkwater2018) but there was a planting date by cover crop treatment interaction. Generally, in April, the early-planted cover crops contained 50 to 85 kg N ha−1, which was 33 to 50% greater than late-planted cover crops. The exceptions were rye and rye-Rem (85 to 103 kg N ha−1 in 2009 and 54 to 83 kg N ha−1 in 2010), which were not impacted by the planting date. The lack of the planting date effect on N accumulation in rye and rye-Rem in 2010 was attributed to the growing rye cover crop that was still accumulating N. Given the differences in plant N content from November to April for all other cover crops (i.e., not rye and rye-Rem), over the winter there was mineralization and/or release of N into surface soil. Therefore, it is useful to compare SMN among cover crops to the NoCC.
Soil mineral nitrogen in fall and spring
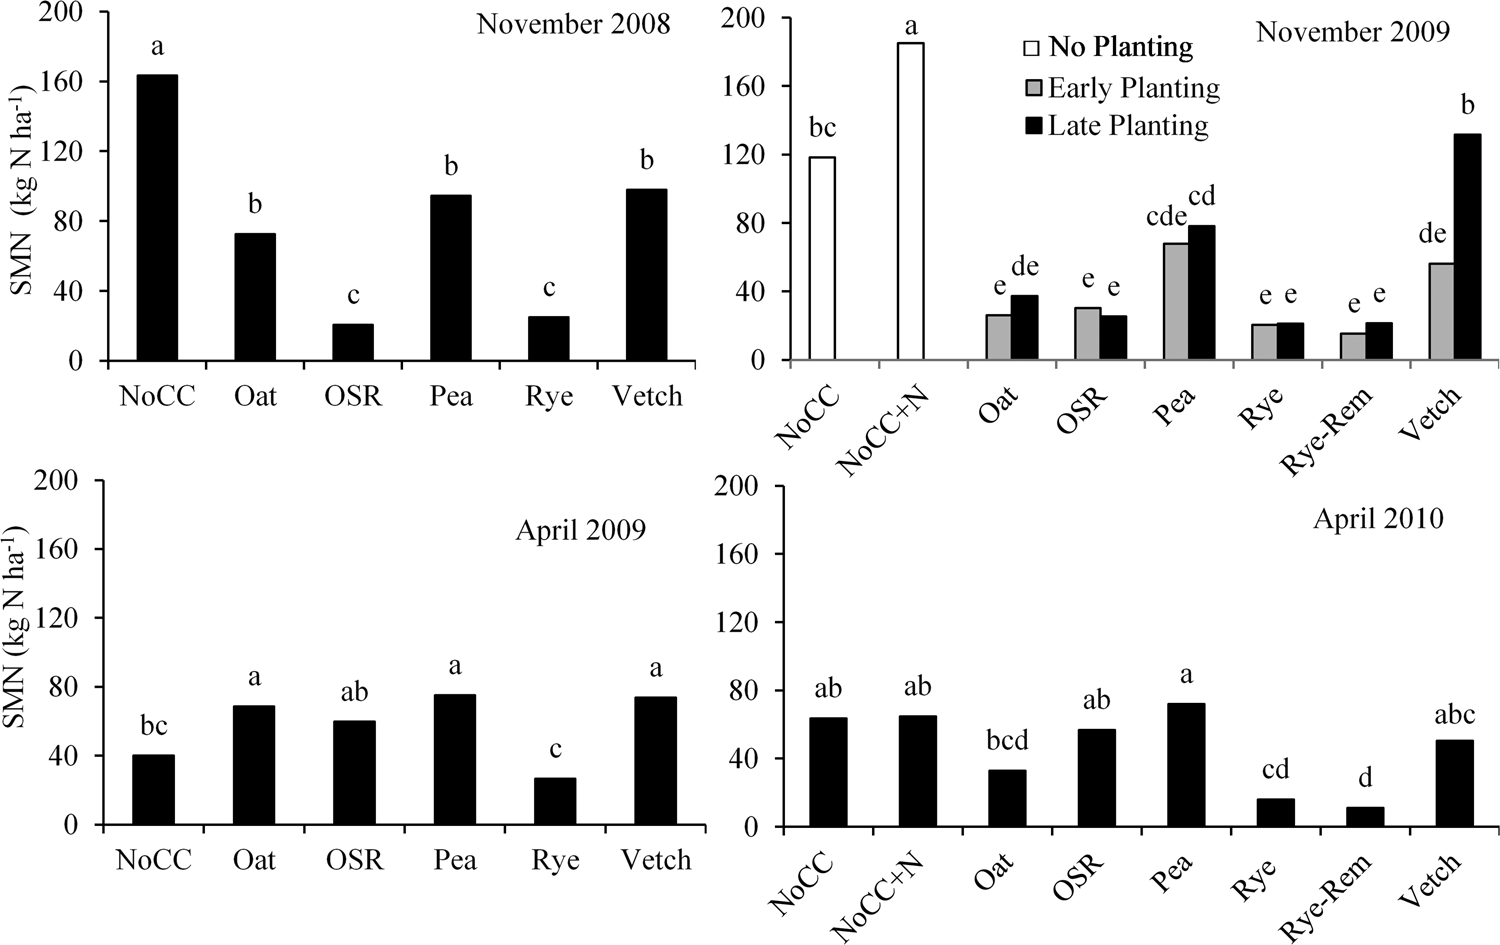
In both years by November, cover crops had 31–98% less SMN in the top 90 cm depth than the NoCC controls (Fig. 3). In November 2008, early-planted cover crops had 22 kg N ha−1 less SMN to 90 cm depth than those cover crops planted 1 month later. In 2008, OSR and rye (21 and 25 kg N ha−1, respectively) had less SMN compared to oat, pea and vetch (73 to 98 kg N ha−1) but all cover crops had less SMN than the NoCC control. Similarly, in November 2009, all cover crops had lower SMN than the NoCC controls, except late-planted vetch (Fig. 3). The cover crop by planting date interaction was due to greater SMN in late- than early-planted vetch but no differences existed between planting dates with the other cover crop treatments. In both years, a trend of SMN levels of NoCC, NoCC + N > pea, vetch > oat > OSR and rye emerged.
SMN as affected by cover crop treatment (i.e., pooled over planting date) and/or planting date. SMN was nitrate-N and ammonium-N measured from 0–90 cm in November 2008 and 2009 (top), April 2009 and 2010 (bottom). OSR, oilseed radish; rye-Rem, rye biomass removed. In each panel, bars with different letters were significantly different based on Tukey–Kramer means separation P < 0.05. Panels with only black bars indicate mean of both planting dates because there was no cover crop by date interaction.

In the spring compared to the fall, the NoCC and NoCC + N control plots had 54 to 120 kg N ha−1 less SMN to 90 cm depth (Fig. 3). Compared to November by the following spring, there were fewer differences among cover crop treatments and no influence of planting date on SMN. In both years, rye, which overwintered (spring biomass 4220 to 4760 kg ha−1), had at least 50% less SMN than other treatments, which was attributed to ongoing spring growth and N accumulation. In both springs, vetch had similar SMN as the winter-terminated cover crops tested (oat, OSR and pea); hence SMN was independent of vetch winter survival [vetch was growing (3090 kg ha−1) in 2010 but was winter-terminated in 2009 (<500 kg ha−1)].
Plant available N by spring
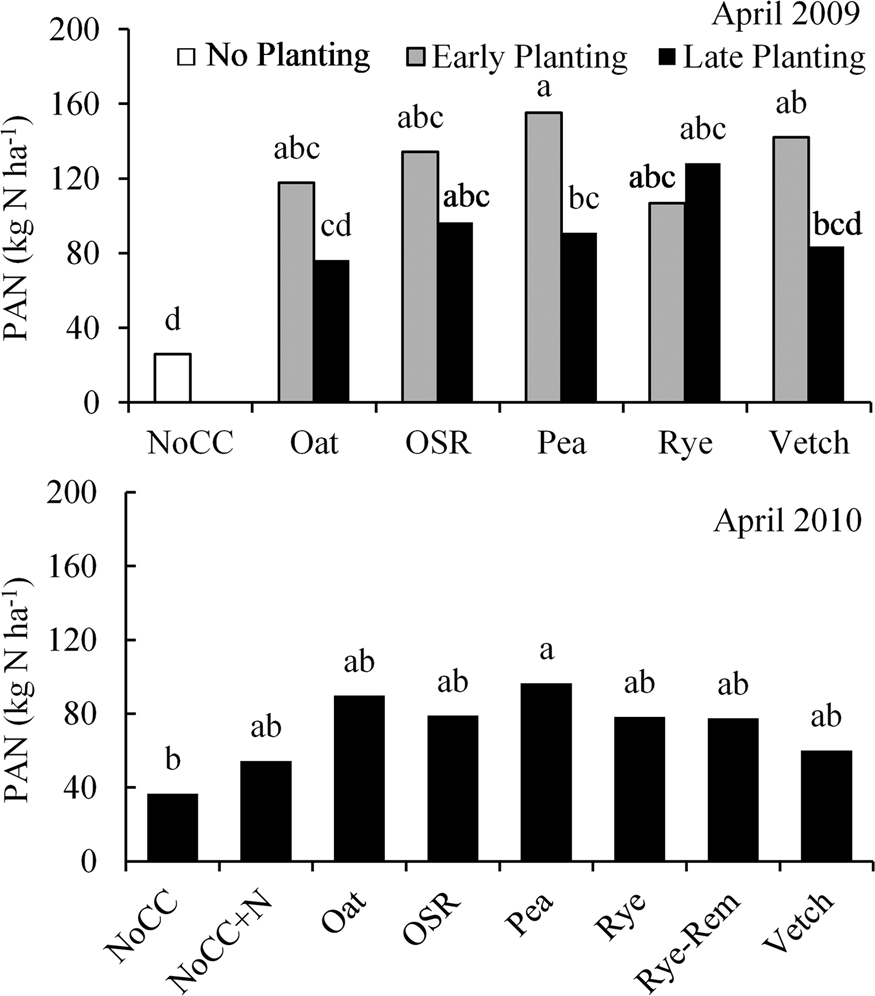
In the following spring there were both cover crop residues (dead and dried) and biomass (alive and growing), which limits meaningful comparisons among cover crops. A more useful approach of PAN was employed, that takes into account the quantity of N as SMN to the 60 cm depth and plant N either as residues or biomass. This approach also allows for comparison to the NoCC controls, which are soil N only. All cover crops had higher PAN (97 to 123 kg N ha−1) compared to the NoCC (26 kg N ha−1) in April 2009. In April 2010, all cover crops had higher PAN (77 to 96 kg N ha−1) compared to the NoCC (37 kg N ha−1) except for vetch (60 kg N ha−1), which had poor winter survivability that year.
By April 2009, all cover crops tested conserved 66 to 83% more N than the NoCC as indicated by greater PAN values (Fig. 4). Although there were fewer statistical differences in spring 2010 than 2009, PAN also trended to be greater in the planted cover crop treatments compared to NoCCs. In April 2009, the planting date by cover crop interaction was due to higher PAN levels in early- vs late-planted covers for all treatments except rye, which was not different. In April 2010, there was no impact of planting date on spring PAN levels (P > 0.05). Thus, greater PAN among the cover crops compared to the no cover controls in April was due primarily to N contained in plant residue or living plant biomass. Since control treatments do not have plants, PAN was only SMN, which is more susceptible to losses than N in living or dead plant tissues.
PAN as affected by cover crop treatment (i.e., pooled over planting date) and/or planting date in April 2009 (top) and 2010 (bottom). PAN = surface SMN to 60 cm depth plus aboveground plant N accumulation, OSR, oilseed radish; rye-Rem, rye biomass removed. In each panel, bars with different letters were significantly different based on Tukey–Kramer means separation P < 0.05. Panels with only black bars indicate mean of both planting dates because there was no cover crop by date interaction.

Cucumber season: yield and fruit N accumulation
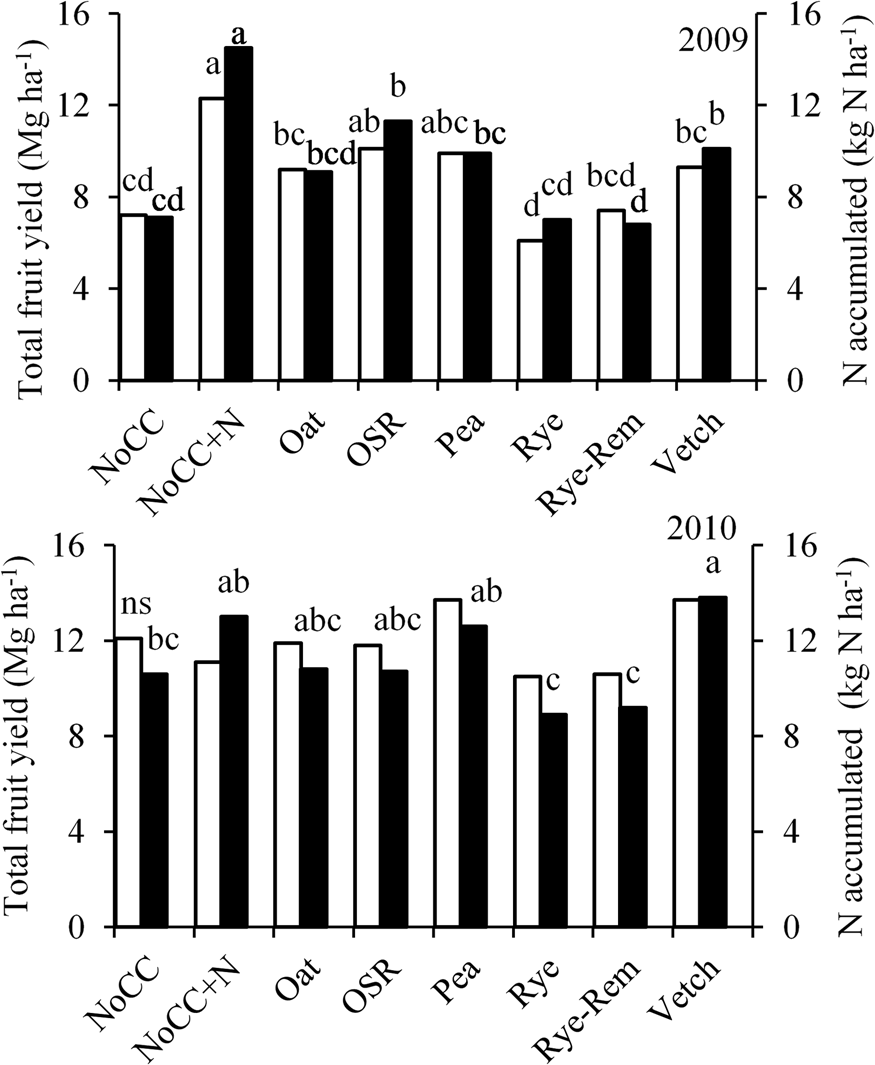
Cover crop treatment impacted cucumber yield, fruit N accumulation (Fig. 5), but planting date did not affect cucumber crop yield nor fruit N accumulation and there was no cover crop by planting date interaction (P < 0.05). Although there were marked differences in cover crop growth and N accumulation based on planting date and cover crop treatment (Figs 1–2), these differences were not exhibited in the following cucumber crop. In 2009, cucumber yield was significantly greater in NoCC + N (12.1 Mg ha−1) compared to oat, rye, rye-Rem, vetch and NoCC (Fig. 5), which was attributed to fertilizer N applied (84 kg N ha−1) and hence greater PAN in July (Table 2). Thus, in 2009, fertilizer N was needed to maximize yield. In contrast with 2009, cover crop treatment did not impact cucumber yield in 2010 (Fig. 5).
Cucumber fruit fresh yield (white bars, left axis) and N accumulation (black bars, right axis) as affected by cover crop treatment at cucumber harvest 2009 (top) and 2010 (bottom). OSR, oilseed radish; rye-Rem, rye biomass removed. In each panel and each parameter, bars with different letters were significantly different based on Tukey–Kramer means separation P < 0.05; ns, not significant.

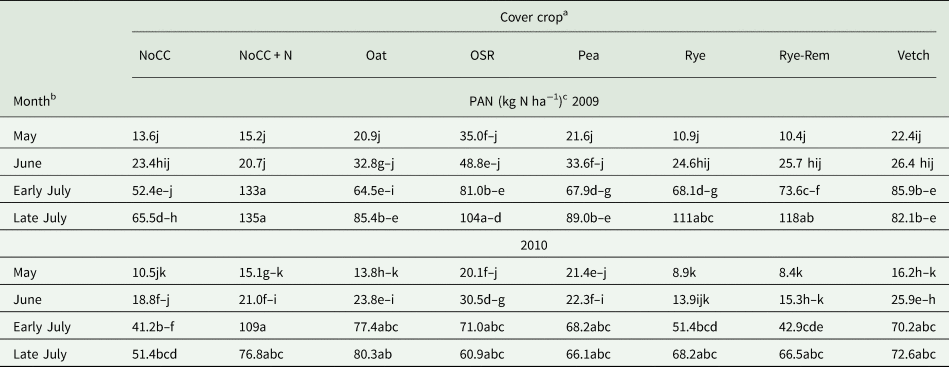
PAN as affected by cover crop treatment and sampling time during the cucumber growing season in 2009 and 2010

In each year, means with different letters were significantly different based on Tukey–Kramer means separation P < 0.05.arye-Rem, rye biomass removed.
b Field activities at the time of data collection: May = cover crop incorporation, June = cucumber planting, Early July = 37 and 35 days after planting in 2009 and 2010, respectively, Late July = cucumber harvest.
c PAN = surface soil mineral N (SMN = nitrate-N and ammonium-N) to 60 cm depth plus aboveground plant N accumulation. Note: no plants were growing (nor collected) in May or June, thus PAN = SMN.
Other than the NoCC + N control, no fertilizer N was applied to the cucumber crop in all other cover crop treatments (i.e., the planted covers and the NoCC control). When compared to the NoCC, all cover crops had equivalent to or better cucumber yields in both years (Fig. 5). In 2009, cucumber yields that followed the OSR and pea cover crop treatments were higher than the NoCC control and statistically similar to the NoCC + N control. Although not significantly different from the NoCC, rye and rye-Rem had the numerically lowest yields in both years.
In 2009, fruit N accumulation in the NoCC + N (15 kg N ha−1) was greater than in all other treatments (Fig. 5). Among the cover crops, OSR had greater fruit N accumulation compared to NoCC, rye and rye-Rem but was not different from vetch, pea and oat. In 2010, the vetch (14 kg N ha−1) cover crop had greater fruit N accumulation compared to the NoCC, rye and rye-Rem. In both years, the lowest fruit N accumulation was observed in rye treatments, which was not different than the NoCC control. These results were consistent with SMN levels in early July (data not shown). Also, there were greater cucumber shoot biomass in the rye and rye-Rem compared to the NoCC and pea (data not shown).
Plant available N in cucumber season
In both years, PAN from May to July was impacted by cover crop treatment and sampling time interaction (P < 0.0001), which was largely attributed to greater PAN values in the NoCC + N treatment throughout July due to fertilizer N application. There were no other significant interactions for PAN (P > 0.05). Thus, similar to cucumber yield and fruit N accumulation, PAN was also not influenced by planting date despite considerable differences in cover crop biomass and N accumulation in the fall (Figs 1–2).
In May and June, PAN equals SMN as cover crops were incorporated and sampling occurred before (May) or at cucumber planting (June). In both years, PAN was very low in May (approx. 10 to 20 kg ha−1) and increased numerically by June. A similar increase in PAN from May to June in the NoCCs suggests little mineralization occurred. Similar trends in PAN in both years between May and June suggest little N available for loss. It is not known if low PAN in May and June was due to conditions that delayed N mineralization or N losses from excessive rainfall in April 2009 and May 2010 (Table 1). In both years OSR had the greatest PAN and rye and rye-Rem were among the lowest in May and June (Table 2), indicating differences in net N mobilization and immobilization, respectively among these treatments.
As temperatures continued to rise from May to early July (Table 1), PAN increased among all treatments (Table 2) due to apparent N mineralization in both years as SMN deceased and plant N increased. In both years, the NoCC control had the least PAN throughout July. PAN by early July in the cover crop plots ranged from 65–86 kg N ha−1 in 2009 and 43–77 kg N ha−1 in 2010. By harvest in 2009, PAN levels increased in the rye and rye-Rem and along with OSR were not different from the NoCC + N, while all other treatments showed numerical increases in PAN (Table 2). The increase in PAN from early to late July with the cover crop treatments but no change in the no cover crop controls suggests net mineralization of cover crop residues during that time period in 2009.
Average PAN values were similar from early to late July in 2010 (Table 2), perhaps due to N losses with excessive rainfall in July 2010 (i.e., 43 mm greater rainfall than 30-yr average of 93 mm) (Table 1). Likewise, in the NoCC + N control PAN decreased by ~25% from early to late July, which further suggests apparent N losses. This trend was not observed in 2009 as conditions were drier (~2/3 less rainfall than July historic norms). Despite apparent N losses in 2010 in NoCC + N control, similar decreases in PAN from early to late July were not observed in other cover crop treatments. For instance, there was a numerical increase in PAN with rye and rye-Rem treatments and no difference with the other planted cover crops, which indicates synchrony of N mineralization with plant uptake and little apparent N losses. In early July 2010, rye and rye-Rem had PAN similar to the NoCC control but oat, pea, radish and vetch PAN was not different than the NoCC + N. By harvest in late July, these differences did not exist, which is indicative of net N mineralization.
Discussion
In both years, cover crop treatments had greater or similar cucumber yield and fruit N content compared to the NoCC controls, which was consistent with other findings (Ngouajio and Mennan, Reference Ngouajio and Mennan2005; Tian et al., Reference Tian, Liu, Zhang and Gao2010). Moreover, in 2009, OSR and pea had equivalent crop yield but lower fruit N content compared to the NoCC + N control, despite no fertilizer N applied to cover crop plots. Differences in PAN throughout the cucumber season translated into differences in cucumber yield in 2009 but not in 2010. Greater PAN in July for NoCC + N did not result in greater yield compared to OSR and pea in 2009 nor lesser yield compared with rye and rye-Rem treatments in 2010. This suggests that N use efficiency was low and there exists an opportunity to further fine tune N recommendations in cucumber production (Van Eerd and O'Reilly, Reference Van Eerd and O'Reilly2009).
Others have suggested that seasonal temperatures and precipitation have a greater influence on cucumber yield than N fertilizer rates due to differences in N mineralization rates (Guoa et al., Reference Guoa, Lia, Christie, Chena and Zhanga2007; Van Eerd and O'Reilly, Reference Van Eerd and O'Reilly2009). Weather may have had a greater effect on N mineralization in 2010 compared to 2009 due to higher spring rainfall which delayed N availability in 2010. These results, combined with the aforementioned research, suggest that weather conditions are the primary driver of cover crop mineralization and N availability to cucumbers. Although cover crop planting date did not affect PAN or yield, a 2-year rotation may not be long enough to observe the cumulative effect of an early and late-planting date. Therefore, an early-planting date is still recommended based on cover crop growth, N accumulation and potential to mitigate N losses.
As predicted, greater aboveground biomass and total N accumulation were obtained in the early-planted cover crops compared to the corresponding late-planted ones; however, this enhanced primary productivity was species dependent as cereal rye growth and N accumulation was not influenced by planting date. Observed quantities and differences in cover crop growth with planting date aligns with many previous studies, indicating that the ideal planting date to maximize growth and N accumulation varies with cover crop (Farsad et al., Reference Farsad, Randhir, Herbert and Hashemi2011; Hashemi et al., Reference Hashemi, Farsad, Sadeghpour, Weis and Herbert2013; Björkman et al., Reference Björkman, Lowry, Shail, Brainard, Anderson and Masiunas2015; Lawson et al., Reference Lawson, Cogger, Bary and Fortuna2015; Murrell et al., Reference Murrell, Schipanski, Finney, Hunter, Burgess, LaChance, Baraibar, White, Mortensen and Kaye2017; Van Eerd, Reference Van Eerd2018). If the planting date is delayed past September, only cereal rye is recommended as a cover crop in this climate, which was consistent with previous research (Van Eerd, Reference Van Eerd2018). The lack of difference between early- and late- planted rye may be due to its ability to grow under colder conditions (Hashemi et al., Reference Hashemi, Farsad, Sadeghpour, Weis and Herbert2013; Lawson et al., Reference Lawson, Cogger, Bary and Fortuna2015; Pantoja et al., Reference Pantoja, Woli, Sawyer and Barker2016; Murrell et al., Reference Murrell, Schipanski, Finney, Hunter, Burgess, LaChance, Baraibar, White, Mortensen and Kaye2017) and regrowth in the following spring.
In both years, delays in planting cover crops (i.e. from August to September) resulted in primary productivity reductions of cover crop around 50% and similar reductions in accumulated N but was species dependent. Greater plant N content for all cover crops (except for late-planted vetch in fall 2009), coincided with less SMN, which would be susceptible to loss. Likewise, the low biomass and N accumulation observed with vetch was consistent with slow fall establishment and shoot biomass in temperate climates (Thorup-Kristensen, Reference Thorup-Kristensen2001; Kuo and Jellum, Reference Kuo and Jellum2002; Brandsaeter et al., Reference Brandsaeter, Heggen, Riley, Stubhaug and Henriksen2008; Lawson et al., Reference Lawson, Cogger, Bary and Fortuna2015) and inconsistent overwintering (Brandsaeter et al., Reference Brandsaeter, Heggen, Riley, Stubhaug and Henriksen2008). Differences in biomass and N accumulation among cover crops based on planting date may be associated with differences in root architecture and rooting depth (taproot vs fibrous, respectively) between species (Thorup-Kristensen, Reference Thorup-Kristensen2001, Reference Thorup-Kristensen2006) and partially explains our observed results. Future research should address the impact of a changing climate on the length of the cover crop growing season as these will undoubtedly influence cover crop growth and N accumulation (Alonso-Ayuso et al., Reference Alonso-Ayuso, Quemada, Vanclooster, Ruiz-Ramos, Rodriguez and Gabriel2018; Van Eerd, Reference Van Eerd2018).
Weather conditions affect cover crop establishment, biomass and N accumulation and thus nutrient cycling (e.g., Hashemi et al., Reference Hashemi, Farsad, Sadeghpour, Weis and Herbert2013; Björkman et al., Reference Björkman, Lowry, Shail, Brainard, Anderson and Masiunas2015; Pantoja et al., Reference Pantoja, Woli, Sawyer and Barker2016). In November in both years compared to the NoCC control, SMN was significantly lower in all cover crop treatments (except late-planted vetch in 2010), coincided with plant N accumulation and indicates significant mitigation of potential N losses into the winter. SMN levels likely remained elevated under the NoCC and NoCC + N by November due to mineralization of crop residues and low rainfall leading to minimal N losses, while cover crops accumulated N that reduced SMN. By April, all cover crops had greater PAN compared to the NoCC control (except for the vetch which was not different in 2010). These results suggest that cover crops were capable of reducing N loss over the autumn and winter during a period that would otherwise be fallow. In the cucumber season, the cover crops were ineffective at increasing PAN compared to the NoCC + N control. This may be due to a lack of synchrony between cover crop mineralization and N demand in the cucumber crop which was likely the case in 2010 that had high rainfall, delaying the N mineralization process and possibly resulting in net N immobilization. A second factor may be that the cover crops did not accumulate enough N in the fall, particularly the late-planting cover crop growing season was too short to take up enough N to be mineralized for cucumber plant uptake. Regardless of the mechanism, compared to the NoCC and NoCC + N controls, cover crops conserved N over the cucumber growing season.
Plant residue decomposition depends on air temperature, residue quantity and quality, C/N ratio, cropping history and soil conditions such as temperature and moisture (Schomberg et al., Reference Schomberg, Steiner and Unger1994) and predicting plant biomass degradation and mineralization requires this knowledge. For instance, cover crops such as OSR and pea decomposed faster than cereal rye because of relatively lower C/N ratio and lignin concentration when compared with rye biomass (Jahanzad et al., Reference Jahanzad, Barker, Hashemi, Eaton, Sadeghpour and Weis2016; Sievers and Cook, Reference Sievers and Cook2018) and greater N content (Lawson et al., Reference Lawson, Cogger, Bary and Fortuna2015), although this would depend on the plant stage of development. In our study, rye was vegetative but oat, pea and OSR were in the reproductive phase of development and early-planted vetch was in the reproductive stage of development but the later planting was not. Although vetch did not have high biomass or N accumulation in the fall, it decomposes faster (Lawson et al., Reference Lawson, Fortuna, Cogger, Bary and Stubbs2013; Sievers and Cook, Reference Sievers and Cook2018), which impacts timing of N release. In May, all cover crops tended to have greater SMN than the NoCC control. Low SMN in 2009 and 2010 spring under rye was consistent with other research showing no net mineralization until rye was incorporated into the soil as opposed to mowing or chemical termination (Snapp and Borden, Reference Snapp and Borden2005). Moreover, the reduction in PAN from early to late July in the NoCC + N control but no other treatment along with excessive rainfall suggests nitrate losses through leaching, or denitrification.
It was surprising that the significant differences in biomass and N accumulation between planting dates among cover crops, did not translate into difference in yield nor PAN in the following year. In agreement, there was no cover crop by planting date interaction on snap bean and sweet corn yield (Van Eerd, Reference Van Eerd2018). In contrast, other researchers have observed greater crop yield following earlier- than later- planted cover crops; where yield gains were attributed to greater cover crop N accumulation associated with early planting (Hashemi et al., Reference Hashemi, Farsad, Sadeghpour, Weis and Herbert2013; Farsad et al., Reference Farsad, Randhir, Herbert and Hashemi2011). Fortunately, our observed lack of cover crop by the planting date effect on yield and PAN, makes cover crop recommendations relatively straightforward.
Conclusions
Selecting the right cover crop species and planting dates may assist in achieving environmentally, economically and socially sustainable agriculture and food systems. Both OSR and pea had yields equivalent to the NoCC + N control which was the greatest yielding treatment. When cucumber was grown without N fertilizer, all of the cover crops tested had yields as good as or better than the NoCC control. Oat, vetch and pea cover crops were more productive at the earlier planting date (i.e. early August), while OSR and rye are recommended if planting date is delayed until early September because rye grows in cooler temperatures and OSR establishes quickly setting an extensive rooting system capable of efficiently taking up N. A limitation of vetch as a cover crop in temperate climates may be its low and variable biomass and N accumulation as well as inconsistent overwintering. Rye growth and N accumulation was independent of planting date and was the only cover crop which consistently overwintered and continued to accumulate N in the spring.
Planting a cover crop in early August reduced the risk of N losses by lowering SMN and immobilizing N in cover crop biomass. Compared to late-planted, all early-planted cover crops, except rye, had greater biomass and N accumulation by November. All cover crops reduced SMN compared to the NoCC into November (with the exception of vetch in 2009). The lower SMN content and N accumulated in cover crop biomass by November suggests that a significant quantity of N was not susceptible to losses in the autumn and winter. By April all cover crops conserved more N (i.e., greater PAN values) than the NoCC, suggesting cover crops mitigated N losses over the winter. Likewise, in the subsequent cucumber season, PAN with cover crops exceeded the NoCC control and was often equivalent to the NoCC + N, which suggests cover crops mitigated N losses and conserved N in different growing seasons (dry in 2009 and wet in 2010). The higher PAN in July with the NoCC + N did not translate into higher yield compared to OSR and pea in 2009 and among all cover crops in 2010. Moreover, cucumber yield grown without fertilizer N was greater than or equivalent to the NoCC for all cover crops tested. This indicates that there is an opportunity to refine N fertilization recommendations for machine-harvested Ontario-grown cucumbers which would reduce fertilizer cost and potential N losses.
Early- and late-planted differences in cover crop biomass growth and N accumulation over the fall did not translate into differences in yield nor PAN by the cucumber season. The lack of planting date effect on crop productivity and N dynamics in the subsequent growing season suggests that planting a cover crop is more important than the quantity of aboveground growth and points to potential belowground contributions. Thus, it would be instructive to examine the long-term effect of cover cropping with weather conditions and cover crop N retention in the context of cover crop planting date.
Acknowledgements
We thank the following organizations for their financial and in-kind contribution to this research project: Ontario Ministry of Agriculture Food and Rural Affairs (OMAFRA)-University of Guelph Partnership, and Ontario Processing Vegetable Growers. The assistance and kind guidance from Mr. Mike Zink, Dr Parkin and Dr O'Halloran were greatly appreciated.