INTRODUCTION
In seasonal habitats, many species undergo periods of reduced activity, or diapause, to survive adverse environmental conditions. For parasites, host diapause may constitute a bottleneck, as survival outside the host may be impossible and strongly impair opportunities for transmission during metabolically inactive host stages such as resting eggs and seeds (Thomson, Reference Thomson1958). One strategy that parasites use to endure such periods is to undergo diapause together with their host (Thomson, Reference Thomson1958; Regniere, Reference Regniere1984; Bauer and Nordin, Reference Bauer and Nordin1989b ; Evseeva, Reference Evseeva1996; Brown et al. Reference Brown, Schmid-Hempel and Schmid-Hempel2003; Andreadis, Reference Andreadis2005). This is often achieved when the parasite is vertically transmitted (transmission between mothers and offspring) into diapausing eggs, seeds or embryos, even though these parasites may otherwise be horizontally transmitted (between hosts not related in direct line) (Regniere, Reference Regniere1984; Mink, Reference Mink1993). Generally, the ability to transmit both vertically and horizontally (=mixed mode transmission) is an efficient strategy for parasites, allowing them to persist in host populations with strongly fluctuating densities, including host diapause (Regniere, Reference Regniere1984; Lipsitch et al. Reference Lipsitch, Nowak, Ebert and May1995; Sorrell et al. Reference Sorrell, White, Pedersen, Hails and Boots2009; Ebert, Reference Ebert2013).
Little is known about the expression of parasite virulence during host diapause. Under non-diapause conditions, virulence is thought to evolve as a balance between the costs of harming the host (and parasite) and the benefits of within-host competition and transmission-stage production (Bull, Reference Bull1994; Alizon et al. Reference Alizon, Hurford, Mideo and Van Baalen2009). Based on this trade-off model, most parasites are expected to evolve intermediate levels of harm to the host (=virulence). During host diapause, however, when parasites have reduced, or zero, opportunities for transmission from the resting host they must maximize their chances of surviving together with the host. Thus it is expected that the parasite should be avirulent to ensure its and the host's survival. This is similar to when a mixed-mode transmitting parasite loses its opportunities for horizontal transmission and therefore is expected to evolve avirulence (Fine, Reference Fine1975; Stewart and Levin, Reference Stewart and Levin1984; Bull et al. Reference Bull, Molineux and Rice1991; Magalon et al. Reference Magalon, Nidelet, Martin and Kaltz2010). Here we suggest that parasites would do best to adopt strategies specific to each host life stage: to express high levels of virulence during the metabolically active phase of the host's life cycle, and to be avirulent during the host's diapause, when horizontal transmission is not possible.
Mixed-mode transmission is common among microsporidia and is often found in parasites with diapausing hosts. These parasites are typically virulent, reducing host survival and fecundity (Agnew and Koella, Reference Agnew and Koella1999; Dunn and Smith, Reference Dunn and Smith2001; Futerman et al. Reference Futerman, Layen, Kotzen, Franzen, Kraaijeveld and Godfray2006; Rutrecht and Brown, Reference Rutrecht and Brown2008). Furthermore, when transmitted from mothers to their directly developing offspring, these parasites often dramatically reduce egg hatching and embryo survival (Andreadis and Hall, Reference Andreadis and Hall1979; Andreadis, Reference Andreadis1983; Bauer and Nordin, Reference Bauer and Nordin1989a ; Becnel et al. Reference Becnel, Garcia and Johnson1995; Raina et al. Reference Raina, Das, Rai and Khurad1995). Whether the same is true for parasites that are vertically transmitted to resting eggs and embryos is not known. Vertical transmission to resting eggs and embryos is important in seasonal environments, where many microsporidia are predominantly transmitted horizontally during the host's growth season, but are vertically transmitted in the diapausing stage of the host (Thomson, Reference Thomson1958; Bauer and Nordin, Reference Bauer and Nordin1989b ; Raina et al. Reference Raina, Das, Rai and Khurad1995; Vizoso and Ebert, Reference Vizoso and Ebert2004; Ebert, Reference Ebert2013). Although these microsporidia are described as highly virulent during the host's growth season (including killing the developing eggs; references as before), nothing has been reported about virulence during the host's resting phase.
Here we test the hypothesis that a parasite that is virulent during the host's growth phase expresses low levels of virulence during host diapause, thus maximizing its likelihood of surviving diapause together with its host. We test this hypothesis using the microsporidium Hamiltosporidium tvaerminnensis (Haag et al. Reference Haag, Larsson, Refardt and Ebert2011) of the water flea Daphnia magna, which lives in a seasonal habitat. Three complementary experiments were conducted, each focusing on a different aspect of infectious disease. In the first experiment resting eggs were collected from natural rock pools. All populations were infected but the prevalence was unknown. In the second experiment infected and uninfected females collected from one natural rock pool were used to produce monoclonal populations placed in mesocosms in the field. In the third experiment infected and uninfected host clones were reared in the laboratory. By quantifying the parasite's influence on resting stage production, egg morphology and hatching, we test whether this otherwise virulent parasite expresses reduced virulence in diapausing host eggs using naturally, semi-naturally and laboratory-produced resting eggs. All three experiments confirm our hypothesis that the parasite is avirulent during the host's resting phase.
The study system
The life cycle of the crustacean D. magna includes asexual reproduction with direct development and sexual reproduction, triggered by adverse environmental conditions. Sexual eggs arrest development after about 10 cell divisions and survive as embryos inside a protective shell called an ephippium. Ephippia allow hosts and parasites to survive harsh periods of freezing or drought (Altermatt and Ebert, Reference Altermatt and Ebert2010). Resting stages hatch after environmental stimuli indicate better conditions. During the active part of their life cycle, Daphnia inhabit the plankton of freshwater ponds and lakes.
The microsporidium H. tvaerminnensis (Haag et al. Reference Haag, Larsson, Refardt and Ebert2011) (formerly called Octosporea bayeri) is an obligate parasite of D. magna. It is horizontally transmitted through environmental spores and vertically transmitted to both asexually and sexually produced host eggs (Vizoso et al. Reference Vizoso, Lass and Ebert2005; Ebert et al. Reference Ebert, Altermatt and Lass2007). Hamiltosporidium tvaerminnensis greatly reduces the competitive ability of its hosts in the planktonic phase (Lass and Ebert, Reference Lass and Ebert2006; Bieger and Ebert, Reference Bieger and Ebert2009). In vertically infected hosts, virulent effects are particularly strong, reducing lifetime reproductive success by up to 85% (Ben-Ami et al. Reference Ben-Ami, Rigaud and Ebert2011). Upon infection, Hamiltosporidium produces several million spores in the host's body. These spores are released for horizontal transmission after the host's death. Spore production is a proxy for the parasite's horizontal transmission potential and is traded-off with reduction in host fecundity, a measure for virulence (Vizoso and Ebert, Reference Vizoso and Ebert2005). Infected resting eggs do not contain fully developed, microsporidian spores, making transmission from resting eggs impossible (E. Sheikh-Jabbari, unpublished).
Infections by H. tvaerminnensis are recognized by the presence of the typical spores. To observe the spores, which are very numerous when present, whole D. magna are placed on glass slides with a drop of medium and a cover-slip is pressed upon the Daphnia with a rotating motion so as to spread the tissues evenly. These wet-mount preparations are observed using phase-contrast microscopy at 400× magnification. Spore types of H. tvaerminnensis have been described and can be easily identified and differentiated from other parasites, even from the congeneric Hamiltosporidium magnivora, also a parasite of D. magna (Vizoso et al. Reference Vizoso, Lass and Ebert2005; Haag et al. Reference Haag, Larsson, Refardt and Ebert2011). No other vertically transmitted microsporidia are known to infect D. magna in this metapopulation (Ebert et al. Reference Ebert, Hottinger and Pajunen2001). Molecular analysis confirmed that H. tvaerminnensis from these rock pool populations is one single species and multiple infections with different genotypes were never observed (Haag et al. Reference Haag, Larsson, Refardt and Ebert2011, Reference Haag, Sheikh-Jabbari, Ben-Ami and Ebert2013a , Reference Haag, Traunecker and Ebert b ).
MATERIALS AND METHODS
We present three experiments, which differ strongly in their design, but address the same questions, i.e. the impact of the parasite on host diapause. The three experiments allowed us to include field and laboratory approaches and to consider aspects of the biology of the system, which a single experiment would not be able to achieve.
Experiment 1: natural populations
In August 2009, we collected D. magna resting eggs from the sediment of five rock pools on three different islands (Halsholmen (HA1), Furuskar-North (FUN), Storgrundet (N)) within the Tvärminne archipelago of south-western Finland (Pajunen and Pajunen, Reference Pajunen and Pajunen2007). These pools had natural Daphnia populations infected with H. tvaerminnensis (Pools: HA1-1, FUN-8, FUN-15, N-43, N-86). Rock pools are small and shallow and are filled with rainwater. Permanent sediment does not accumulate, so collected ephippia are from the growth period preceding the sampling. The sediment samples with the ephippia were kept at 4 °C in the dark for 3 months. Ephippia were then collected from the samples, rinsed in water and measured for length using a dissection microscope with a scaled lens. We opened each ephippium, counted (0, 1 or 2) and collected the resting eggs and measured their length and width. Each egg was placed in 2 mL of artificial culture medium (ADaM, Ebert et al. Reference Ebert, Zschokke-Rohringer and Carius1998) under a constant dark : light cycle of 8 : 16 h and 25 °C to initiate hatching. Containers were checked daily for hatchlings over a period of 3 weeks, as preliminary experiments had indicated that 93% of eggs hatch in week 1, 6% in week 2 and 1% in week 3.
After the animals hatched, we placed them in 100 mL of medium with a dark : light cycle of 8 : 16 h at 20 °C and fed them regularly with unicellular green algae Scenedesmus sp. On day 12, all hatchlings were checked for the presence of H. tvaerminnensis spores using squash preparation (400×magnification, phase contrast). From Population FUN-15, only seven eggs hatched (four infected and three uninfected), so we excluded this population from the analysis on infection status and hatching success.
Experiment 2: monoclonal populations
To determine whether infection affected resting egg production and hatching success, we propagated two groups of clones – one infected and one uninfected – in semi-natural condition. On 17 May 2008, we collected 100 egg-bearing females from rock pool N-49 on the island of Storegrunded. Each female was placed individually in 30 mL medium and kept until the young from her brood chamber were released. The female was then tested for H. tvaerminnensis infection. If the mother was infected, all offspring were assumed to be infected, as vertical transmission is known to be 100% efficient to asexual offspring (Ebert et al. Reference Ebert, Altermatt and Lass2007). We took 15 offspring each from 12 healthy and 13 infected females and placed them in buckets (25 total buckets, one for each female's offspring). The buckets were filled with 6 L of rock pool water and placed near natural rock pools on the island Furuskär. On 1–3 September 2008, all ephippia were collected from the buckets. Five populations had not produced any ephippia, leaving us with 12 infected and 8 uninfected monoclonal populations. Ephippia were stored in the dark at 4 °C. In 2009, ephippia were counted and treated as described in Experiment 1.
Experiment 3: host clones under laboratory conditions
To determine whether a host's genetic background affects the relationship between parasitism and resting egg characteristics, we performed a laboratory experiment using infected and uninfected populations from identical host genotypes. Five clones were collected from different islands (Skallotholmen (SK-1), Oeren (OER), a small unnamed island south-east of Melanskar (LAG), Furuskar-North (FUN) and a small unnamed island north of Skallatholmen (SMF)) infected with H. tvaerminnensis (rock pool: SK-58-2, OER-3-3, LAG-4-9, FUN-15-3 and SMF-2-6). For each clone a single-infected female D. magna from a sample collected from rock-pool populations was allowed to reproduce clonally to produce iso-female host lines (=clones). After reproducing, the mother was dissected to verify its infection by H. tvaerminnensis. Each clone was segregated into two lines, one of which was cured from the parasite using fumidil B (Zbinden et al. Reference Zbinden, Lass, Refardt, Hottinger and Ebert2005), while the other remained infected. This resulted in five pairs, each comprised of one infected and one uninfected line with identical genotypes. All lines were kept under standardized conditions for several generations prior to the experiment. The experiment was set up with three replicate populations per clone and infection status, resulting in a total of 30 (3×2×5) replicate populations. For each replicate, seven juvenile females were moved to a 1-L jar filled with artificial culture medium (ADaM) and kept under 16 : 8 h light : dark cycle at 20 °C. Jars were randomly distributed on a shelf in a controlled temperature room, and each jar was fed with 108 algae three times per week. After 2 months, all ephippia were counted and stored at 4 °C in the dark. The infected lines of clones OER-3-3 and SMF-2-6 either did not produce any ephippia, or the population went extinct. For clone SK-58-2, one infected and one uninfected replicate were lost, leaving us with a total of eight infected and eight uninfected replicates from three clones. Ephippia were treated as before.
Data analysis
We calculated egg volume, assuming the egg to be an ellipsoid with two shorter axes of the same length (prolate spheroid), and egg shape, calculated as the ratio of egg length to width. Because many ephippia contained two eggs with similar volume, shape and time to hatch, we randomly chose only one egg per ephippium for analysis to avoid pseudo-replication. Total number of eggs was calculated by multiplying the total number of ephippia produced with (1 – proportion of empty ephippia) and this was then multiplied with the mean number of eggs per egg-containing ephippium. Before analysis, we transformed time to hatching to 1/time to hatch to reach normal distribution. All other traits were normally distributed. For all three experiments, we analysed the traits in two different sets: those based on individual ephippia and eggs (ephippia length, egg volume, egg shape and hatching time), and those based on population-level estimates (total ephippia production, proportion of empty ephippia, number of eggs per ephippia, total egg production and proportion of hatched eggs (hatching success)).
For experiment 1, we analysed traits based on the individual ephippia using a two-way ANOVA, where infection status, population of origin and their interaction were included as fixed effects. Because infection status was only determined for hatchlings, not for unhatched eggs, some traits were analysed without infection status. For experiment 2, we used nested ANOVA with infection status of the bucket population as a fixed effect and clone nested within infection status as a random effect. For experiment 3, we also used nested ANOVA with infection status, Daphnia clone and their interaction as fixed effects, and replicate populations nested within the infection status-clone combination as a random effect. For the population-level analysis from experiments 2 and 3 (ephippia production, proportion of empty ephippia, number of eggs per ephippium, total egg production and hatching success), we compared infected and uninfected population traits (population is the unit of replication) using one-way ANOVA based on population means (Table 2).
All statistics were performed in R (version 2.12.2, www.R-project.org) using least-squares estimation; appropriate error terms for F-ratios were calculated as per Quinn and Keogh (Reference Quinn and Keogh2002). Analyses involving random effects were also performed using a mixed model with the lme4 package in R (Bates et al. Reference Bates, Maechler and Dai2008). We present here the least-squares analyses, as the clone within treatment terms is more readily interpretable; however, our results were confirmed using the mixed model analyses to ensure that imbalances in replication did not influence our findings (see Table S1 supplementary material).
RESULTS
We describe the results on a trait-by-trait basis, rather than experiment-by-experiment, as this highlights their similarity across the three experiments and emphasizes the biology of the system.
Morphology
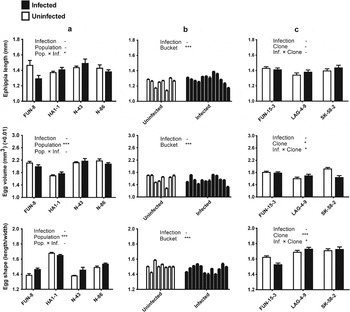
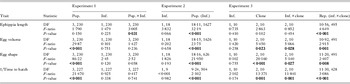
The analysis of ephippia length, egg volume and egg shape (morphological traits) primarily revealed differences between populations and clones, but no parasite effect (Table 1, Fig. 1). In experiment 1, egg volume and shape were significantly different between the five natural populations, while ephippia length showed only a marginal significant effect of the population by infection interaction (Table 1, Fig. 1). In experiment 2, ephippia length, egg volume and shape varied strongly among the monoclonal bucket populations, but not between infected and uninfected populations (Table 1, Fig. 1). In experiment 3, egg volume and shape varied significantly among clones and also showed marginal significant clone by infection interactions. Significant effects were also seen among replicate populations within treatment groups, stressing the presence of unexplained variation for all morphological traits (Table 1).
Influence of infection status on ephippia length (mm), egg volume (mm3) and egg shape (egg length/egg width ratio) in the three experiments. Graphs are organized in rows (representing traits) and columns (representing experiments). Column (a) corresponds to the five natural populations of experiment 1, (b) the infected and uninfected bucket populations of experiment 2, and (c) the infected and uninfected clones of experiment 3. A summary of the statistical analysis is given in each graph, with the symbols meaning: – P>0·05, *P<0·05 and ***P<0·01.

Summary statistics (analysis of variance) for ephippia length (mm), egg volume (mm3), egg shape and 1/time to hatch (day) for three experiments. Experiment 1 shows how the different traits varied based on population effect, infection status and their interaction. Experiment 2 shows the comparison of each trait between infected and uninfected populations, and population nested within infection status. Experiment 3 shows the same traits compared between infected and uninfected populations, Daphnia clone and the replicate nested within the infection and clone combinations. Pop. = population, Inf. = infection and Rep. = replicate population

Hatching
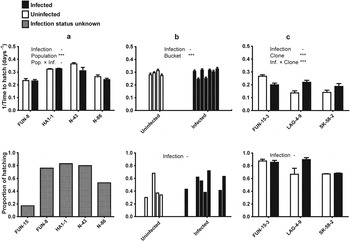
In experiment 1, the proportion of ephippia that hatched varied from 18 to 85% among the five natural populations. We cannot compare the hatching success of infected and uninfected natural resting eggs because we did not assess the infection status of those eggs that did not hatch (Fig. 2). In experiment 2, nine populations did not hatch – four of eight uninfected (50%) and five of 12 infected (42%) (this difference is not significant: Fisher exact test: P = 0·33). In the other populations in experiment 2 offspring hatching was between 30 to 68%, with no difference among infection treatments. The same was true for hatching in experiment 3 (Table 2 and Fig. 2).
Influence of infection on the 1/time to hatch (days) (top row of graphs) and comparison of hatching rate (bottom row) for each experiment. Columns correspond to experiments with (a) five natural populations of experiment 1, (b) infected and uninfected bucket populations of experiment 2, and (c) infected and uninfected clones of experiment 3. For the lower left graph, it was not possible to separate infected from uninfected, because the proportion of infected eggs that did not hatch was unknown. A summary of the statistical analysis is given in each graph, with the symbols meaning: – P>0·05, *P<0·05 and ***P<0·01.

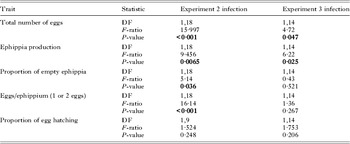
Effects of infection on total egg production, ephippia production, proportion of empty ephippia, eggs/ephippium (with at least one egg) and proportion of egg hatching

In all three experiments, time to hatch varied significantly between populations and clones, but infection showed no clear effect on this trait. Only in experiment 3 did we find a significant clone×infection interaction (Table 1, Fig. 2).
Ephippia and egg production
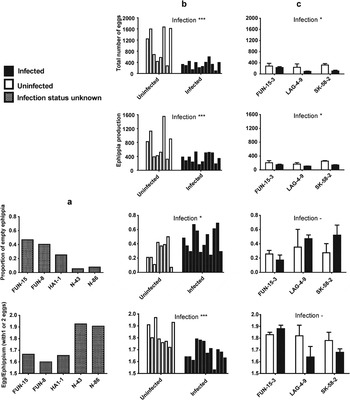
In experiments 2 and 3, infected populations produced significantly fewer ephippia (egg cases) than uninfected populations (Table 2, Fig. 3). The proportion of empty ephippia and the number of eggs per ephippium were significantly lower in the infected monoclonal bucket populations in experiment 2. This effect was not observed, however, in experiment 3 (Table 2, Fig. 3). Taken together (experiments 2 and 3), infected populations produced about 40% fewer resting eggs (total count of eggs within all ephippia) than uninfected populations (Fig. 3, top).
Comparison of total number of eggs, ephippia production, proportion of empty ephippia, and egg number/ephippium (with at least one egg) in the three experiments. Graphs are organized in rows (representing traits) and columns (representing experiments). Column (a) corresponds to the five natural populations of experiment 1, (b) the infected and uninfected bucket populations of experiment 2, and (c) the infected and uninfected clones of experiment 3. For experiment 1 (left row of graphs 1), it was not possible to separate infected from uninfected. A summary of the statistical analysis is given in each graph, with the symbols meaning: –P>0·05, *P<0·05 and ***P<0·01.

Relationships among resting egg characteristics
We assessed the relationship between resting egg morphology and hatching characteristics using regression analysis. In our models, we considered only egg volume as an estimate of morphology, as it correlated positively with ephippia size (overall correlation range 0·455 to 0·609), and egg shape and volume are both calculated using the same resting egg length and width data. We found no significant correlation between hatching probability and egg volume in either experiment 1 (β = 50·59, P = 0·20), experiment 2 (β = 4·33, P = 0·88) or experiment 3 (β = 12·04, P = 0·77). Similarly, no correlation was found between egg volume and time to hatch in experiment 1 (β = −2·27, P = 0·16), experiment 2 (β = −0·17, P = 0·91) or experiment 3 (β = 1·02, P = 0·45).
For experiments 2 and 3, we also tested if the observed relationship between egg volume and hatching characteristics varied with infection status or host genotype. This would be seen by a significant interaction between any of these terms and egg volume in the regression model. For experiment 2, infection did not influence either hatching success (χ 1 = 0·23, P = 0·63) or hatching rate (F 1,380 = 0·06, P = 0·81). Likewise for experiment 3, there was no evidence of differences in slopes between infected and uninfected resting eggs (hatching success: χ 1 = 1·15, P = 0·28; hatching rate: F 1,371 = 0·76, P = 0·38) or Daphnia clones (hatching success: χ 1 = 0·52, P = 0·77; hatching rate: F 2,371 = 0·34, P = 0·72).
DISCUSSION
In this study we contrasted the high parasite virulence expressed in vertically infected D. magna during their planktonic life phase (Lass and Ebert, Reference Lass and Ebert2006; Bieger and Ebert, Reference Bieger and Ebert2009; Ben-Ami et al. Reference Ben-Ami, Rigaud and Ebert2011), with the level of virulence expressed in the host's vertically infected resting stages. The results of three independent experiments support our hypothesis that the parasite is avirulent during the host's resting phase. Neither hatching rate nor time to hatching differed among infected and uninfected resting stages. The same was true for three morphological traits of the resting stage. At the same time, we confirmed the parasite's virulence during the planktonic phase of the host life cycle, in which it reduced total egg production by about 40%.
Virulence in different host life stages
Microsporidian parasites are known for their diverse effects on hosts, including reduced survival, fecundity and competitive ability, as well as feminization and selective offspring killing (Dunn and Smith, Reference Dunn and Smith2001). Several studies have described their highly virulent effects on directly developing host eggs and embryos (Andreadis and Hall, Reference Andreadis and Hall1979; Andreadis, Reference Andreadis1983; Bauer and Nordin, Reference Bauer and Nordin1989a ; Becnel et al. Reference Becnel, Garcia and Johnson1995; Raina et al. Reference Raina, Das, Rai and Khurad1995). In contrast to these studies, our work focused on parasite effects during host diapause. We found that H. tvaerminnensis had an effect on neither resting egg hatching success, time to hatching, nor on ephippia and egg morphology. High virulence, expressed in a directly developing egg, may yield some fitness gain for the parasite through horizontal transmission (e.g. cannibalism or scavenging of dead eggs or embryos), thus suggesting how virulence during this stage could be adaptive (Raina et al. Reference Raina, Das, Rai and Khurad1995). However, horizontal transmission from Daphnia resting stages is very unlikely: hatchlings neither produce transmission stages until they are nearly mature (about 8–10 days old; Vizoso and Ebert, Reference Vizoso and Ebert2004), nor can there be transmission through cannibalism, as the filter-feeding planktonic hosts cannot ingest the resting eggs encapsulated in an ephippial shell.
In contrast to the absence of any virulence during the resting phase, H. tvaerminnensis is virulent for hosts during the active phase of the host's life cycle. Ephippia from infected females contain on average fewer eggs than those from healthy hosts (Fig. 3). Earlier, reduced parthenogenetic fecundity was shown to be traded-off in this system with higher rates of environmental spore production, which facilitates horizontal transmission (Vizoso and Ebert, Reference Vizoso and Ebert2005). The same may be true for resting egg production: infected females produce parasite transmission stages, but pay a cost in terms of fewer resting stages. Experiments have shown that without horizontal transmission during the host's planktonic phase, the parasite goes extinct because infected hosts are rapidly outcompeted by healthy hosts (Lass and Ebert, Reference Lass and Ebert2006). Thus, there is strong selection for the production of environmental transmission stages, and, consequently, for higher virulence. This argument follows the classic trade-off argument for the evolution of virulence, where parasite fitness evolves to maximize horizontal transmission (Anderson and May, Reference Anderson and May1982; Bull, Reference Bull1994; Alizon et al. Reference Alizon, Hurford, Mideo and Van Baalen2009). Although this model does not fully apply to our parasite, which has vertical and horizontal transmission, the need for horizontal transmission is so strong that some level of virulence is unavoidable (see Lipsitch et al. Reference Lipsitch, Siller and Nowak1996 for a discussion).
While our model suggests that low virulence during host resting is an adaptation, we cannot exclude that this trait is a “boring by-product” (Dawkins, Reference Dawkins1982), which might be caused by the low metabolic rates of the resting eggs. However, even if low virulence during host resting is a by-product, its beneficial function for host and parasite would stabilize this trait and selection would not work against it.
Planktonic females suffer from the parasite, but produce resting eggs, which seem unaffected by the parasite. The ephippium, the resting egg shell, is part of the mother's carapace. Larger mothers produce larger ephippia (r 2 = 0·92, P<0·001, unpublished data) and invest more resources into their eggs (Boersma et al. Reference Boersma, Boriss and Mitchell2000; Arbaciauskas, Reference Arbaciauskas2004). But it is currently unclear if larger eggs have a fitness advantage (Boersma et al. Reference Boersma, Boriss and Mitchell2000; Arbaciauskas, Reference Arbaciauskas2004; Pfrender and Deng, Reference Pfrender and Deng1998 for Daphnia; Liu and Niu, Reference Liu and Niu2010 for a Rotifer). As egg size seems unrelated to hatching under laboratory conditions, we speculate that larger eggs may be beneficial for aspects of diapause usually not addressed in the laboratory, e.g. a survival advantage under stressful or long diapause conditions (Arbaciauskas, Reference Arbaciauskas2004). The parasite-induced reduction in resting egg number without a change in resting egg size suggests that keeping egg size constant is more important than maintaining a high quantity of eggs. The eggs deposited in the ephippia by both infected and healthy hosts seemed to be of uniform quality, suggesting a strategy not to compromise the ability of the resting stage to survive diapause. Thus, the high parasite virulence expressed in mothers apparently does not affect the quality of the resting eggs produced by these mothers, although maternal effects for ephippia formation are known from D. magna (De Meester et al. Reference De Meester, Cousyn and Vanoverbeke1998; Boersma et al. Reference Boersma, Boriss and Mitchell2000).
The clonal populations in the second and third experiment produced resting eggs by selfing, which is known to cause inbreeding depression in Daphnia (Caceres et al. Reference Caceres, Hartway and Paczolt2009), including a reduction of hatching success (De Meester, Reference De Meester1993). However, we believe that inbreeding depression did not influence ephippia production in our experiments because it is expected for the offspring, not for the female producing the inbred offspring. Inbreeding may play a role, however, in the population and clone-level effects on hatching parameters reported for experiments 2 and 3. This effect was independent of the parasite, however.
Epidemiology of H. tvaerminnensis
Hamiltosporidium tvaerminnensis shows characteristic seasonal cycles with low to intermediate prevalence during spring hatching and very high prevalences in summer (Lass and Ebert, Reference Lass and Ebert2006). A number of reasons have been suggested for the marked decline from summer to the following spring, among them the hypothesis that the parasite causes mortality in the resting hosts during diapause (Lass and Ebert, Reference Lass and Ebert2006). Our results allow us to reject this hypothesis, a finding consistent with the results of Lass et al. (Reference Lass, Hottinger, Fabbro and Ebert2011), who compared population-wide hatching success in mesocosm populations of D. magna.
On the other hand, our finding that infected populations with 100% prevalence produce fewer resting stages than uninfected populations can help to explain the prevalence decline across diapause. If we assume that infected females also produce fewer resting eggs than healthy females in populations where prevalence is less than 100%, these results explain, at least partly, the strong decline in prevalence associated with diapause in this system (Lass and Ebert, Reference Lass and Ebert2006). If the proportion of infected resting eggs is lower than the proportion of infected females in the current season, then the disease prevalence among hatchlings in the following season will be lower than the population's prevalence in the previous season (Lass et al. Reference Lass, Hottinger, Fabbro and Ebert2011).
CONCLUSION
Our virulence model combines two aspects of previous models for the evolution of virulence: first, the general prediction that the fewer opportunities that exist for horizontal transmission, the lower the optimal virulence will be (Lenski and May, Reference Lenski and May1994; Alizon et al. Reference Alizon, Hurford, Mideo and Van Baalen2009). Second, the idea that virulence can be plastic, and its expression may depend on the current environmental or host conditions (Kaltz and Koella, Reference Kaltz and Koella2003; Bedhomme et al. Reference Bedhomme, Agnew, Vital, Sidobre and Michalakis2005). Here we tested and confirmed the hypothesis that the expression of virulence depends on the life stage of the host and that virulence is lowest in the stage with the lowest horizontal transmission potential. The high virulence expressed in metabolically active mothers was not apparent in the resting eggs produced by these mothers. This is unlike systems in which microsporidian parasites show high virulence in eggs and embryos when transmitted to directly developing offspring (Andreadis and Hall, Reference Andreadis and Hall1979; Andreadis, Reference Andreadis1983; Bauer and Nordin, Reference Bauer and Nordin1989a ; Becnel et al. Reference Becnel, Garcia and Johnson1995; Raina et al. Reference Raina, Das, Rai and Khurad1995). Our model of plastic, life stage-dependent virulence also applies to other host life phases where horizontal transmission is impossible, e.g. dispersal and diapause of adults (Gill and Mock, Reference Gill, Mock, Rollinson and Anderson1985; Tinsley, Reference Tinsley1995). This result links parasite virulence to host development, a topic not yet addressed in the virulence literature.
SUPPLEMENTARY MATERIAL
To view supplementary material for this article, please visit http://dx.doi.org/S0031182014000456 followed by article doi number.
ACKNOWLEDGEMENTS
We thank Jürgen Hottinger and Urs Stiefel for assistance in the laboratory. This work is part of project No. 97524006 at Tvärminne Zoological Station. We thank Suzanne Zweizig for improving the language of the manuscript.
FINANCIAL SUPPORT
The study was supported by the University of Basel Foundation and by the Swiss National Science Foundation.