Introduction
It is now broadly recognised that economic growth is the best way to address poverty in the long run (The Economist, 2013). It is also widely accepted that all countries need a modicum of social protection, because economic growth alone cannot entirely eliminate poverty (OECD, 2001; UNRISD, 2006; Wiman et al., Reference Wiman, Voipio and Ylonen2007). Notwithstanding the broad agreements, debates among scholars and practitioners persist on the extent to which governments should focus on social protection and the form the protection should take. The debate is particularly divisive over the extent to which the benefits should be available on a universal or targeted basis.
China's impressive record in reducing poverty makes it an excellent case for shedding light on the debates over poverty alleviation. Yet little is known about the extent to which social protection programmes have contributed to the decline of poverty in China. The present study seeks to close the gap by empirically examining the effects of the Minimum Living Standard Assistance (MLSA) or Dibao, the key social protection programme in China, on poverty alleviation. The findings will contribute to the ongoing debates on the determinants of poverty reduction in China and elsewhere (Kenworthy, Reference Kenworthy1999; Devereux and Sabates-Wheeler, Reference Devereux and Sabates-Wheeler2007). In addition to shedding light on the theoretical debates, the article is intended to contribute to evidence-based policy making as China moves forward to strengthen its social protection system.
Dibao was established first as a pilot in the early 1990s, and as a nationwide programme in 1999, to provide income support to the poor. MLSA benefits are in the form of cash transfers to households sufficient to cover the cost of basic necessities (OECD, 2011). To receive benefits, households must meet both income and assets criteria set by their local governments. The number of MLSA beneficiaries rose from 0.9 million in 1997 to around 23 million in 2000 and has broadly remained at that level since (Ministry of Civil Affairs of the People's Republic of China, 1999–2011). The increase in coverage and benefits was accompanied by increased government spending, which rose from CNY 2.72 billion in 2001 to CNY 61.73 billion in 2011 (Solinger, Reference Solinger2008; Ministry of Civil Affairs of the People's Republic of China, 1999–2011). Other benefits, such as subsidies for medical and education expenditures, have been offered to Dibao recipients in recent years (Peng and Ding, Reference Peng and Ding2012). Coverage and expenditures are likely to increase further in future as the government expands the programme to the countryside.
The initial motivation for establishing MLSA was to contain the fallouts from the restructuring of state-owned enterprises that were causing financial hardships for households and threatening social and political order. Its launch not only provided some financial relief to households, but also helped state enterprises by absolving them of responsibility for looking after retrenched workers (Solinger, Reference Solinger2008: 38). However, the launch was not a commitment on the part of the Chinese government to establish a comprehensive or long-term social protection system in the country. It was instead seen as a residual arrangement to assist those adversely affected by economic reforms. Indeed, in 1999 the government stated unequivocally that MLSA was a temporary programme and that the policy to promote ‘self-support’ remained unchanged (Solinger, Reference Solinger2008: 38). Notwithstanding the government's hesitation, the Dibao programme has gradually transformed into a core component of the Chinese government's long-term poverty alleviation strategy (Chan, Reference Chan2010; Ngok, Reference Ngok2010).
Despite the vast size of the MLSA programme in terms of both population coverage and fiscal spending, its effects on poverty alleviation have not been subjected to comprehensive and systematic analysis. In this article, we seek to overcome the limitations of subjective data on poverty reduction in China by combining micro-level individual and household data with macro-level objective regional data.
To fully understand the poverty reduction effects of MLSA, we conducted both time series and cross-sectional analysis of the China Health and Nutrition Survey (CHNS) panel data for six rounds of survey between 1993 and 2009. By using panel survey data to track changes at both household and regional levels over time, the study was able to investigate the effects of the MLSA programme on poverty in China in ways not possible using traditional methods. The drivers of poverty and its reduction involve complex patterns of variability which can only be studied through multilevel analysis capable of handling the nested sources of variability (Snijders and Bosker, Reference Snijders and Bosker2012). The multilevel analysis employed in this article allows us to highlight nested relationships between variables which standard linear analysis cannot exploit. The analysis shows that the poverty rate declined at a faster rate in provinces with higher spending on MLSA, indicating that cash transfer programmes are an effective tool for reducing poverty.
The debate on universal versus targeted programmes
There are two broad approaches to providing social protection: universal and targeted. Universal social protection programmes offer ‘a minimum level of income or consumption granted as a right by the state to all citizens and residents of a country’ without means-tests or conditions (UNRISD, 2010: 136). They serve as a social contract between citizens and the state, with the latter assuming the responsibility for caring for its citizens. Its proponents argue that universal programmes are more effective in addressing ‘the underlying causes of poverty or to achieve adequate levels of coverage’ (UNRISD, 2010: 134). Critics, however, argue that universal programmes are wasteful, expensive and distortionary, in addition to undermining self-reliance on the part of the beneficiaries (see Herd, Reference Herd2005).
Targeted social protection programmes, on the other hand, aim to provide temporary income support to the neediest residents within a jurisdiction. Under such arrangements residents with no or insufficient income, identified through means and/or asset tests, are provided with income support to assist with maintaining a minimum standard of living. The stated rationale for the selectivity is to promote self-reliance, maintain the work incentive and cause minimum market distortions (UNRISD, 2010). Proponents argue that such programmes reduce poverty and promote social inclusion while causing less economic and other distortions than universal programmes (Devereux and Sabates-Wheeler, Reference Devereux and Sabates-Wheeler2007; Sabates-Wheeler and Devereux, Reference Sabates-Wheeler and Devereux2007). Critics of targeted programmes respond that such programmes stigmatise and marginalise recipients, involve substantial administrative costs and suffer from targeting errors. Drawing on cross-national evidence from low- and middle-income countries, Ulriksen (Reference Ulriksen2012) suggests that universal social protection systems are more effective in reducing poverty than targeted pro-poor programmes.
The broader debate on the superiority of targeted or universal programmes has parallels in China. Some Chinese point out that the MLSA programme involves substantial administrative costs and mis-targeting and needs to be completely overhauled.Footnote 1 Others argue for greater selectivity so that benefits are available only to those who truly need them.
However, both the proponents and opponents of targeted programmes overstate their case. The effectiveness of any social protection programme depends as much on the surrounding social, economic and political contexts as on specific programme design elements (Gentilini, Reference Gentilini2009). Instead of engaging in broader theoretical or ideological debates, it would be more useful for policy makers and scholars to acknowledge that there are problems and move on to focussing on how to design and implement workable targeted programmes (Ravallion, Reference Ravallion2003). Findings from this study suggest that the MLSA programme is effective in reducing poverty and that reforms should focus on improving it rather than finding an alternative.
Empirical tests
Data
The study analysed the China Health and Nutrition Survey (CHNS) data collected in 1993, 1997, 2000, 2004, 2006 and 2009 (http://www.cpc.unc.edu/projects/china) and the newly available fiscal data on MLSA spending (http://www.mca.gov.cn/) to understand the links between social protection programmes and poverty alleviation in China. The CHNS data provides longitudinal information on health, nutrition and family characteristics, and offers reliable information for studying patterns of poverty and inequality in China over time (Zhang and Wan, Reference Zhang and Wan2006; Liu, Reference Liu2008). High-quality panel data are a rarity in developing countries, making CHNS a valuable resource for understanding socio-economic patterns in developing economies. It is especially useful when used in conjunction with other data sets, such as the MLSA spending data.
Similar to panel surveys in developed economies, the CHNS utilises a multistage, random cluster process to survey about 4,400 households in nine provinces (Liaoning, Heilongjiang, Jiangsu, Shandong, Henan, Hubei, Hunan, Guangxi and Guizhou provinces). Though the CHNS does not contain a national representative sample, the population of the nine provinces accounts for 42 per cent of the total population of mainland China. The provinces vary greatly with regard to economic development, socio-economic indicators, fiscal capacity and social welfare spending. County unitsFootnote 2 in the provinces are stratified by income, and a weighted sampling scheme is used to randomly select four counties in every province. Urban/suburban neighbourhoods are selected in urban areas, while villages and townships comprise rural areas. Since 2000, the survey has included 216 primary sampling units comprising thirty-six urban neighbourhoods, thirty-six suburban neighbourhoods, thirty-six towns and 108 villages.Footnote 3
Poverty trends in China
The poverty rate in any given locality depends substantially on the poverty line used to measure it. In developed countries, it is common for poverty to be measured in terms of the share of population living below a certain percentage (usually 50 per cent) of median income. In developing countries, on the other hand, poverty is typically measured as the share of population living on income below the minimum level necessary to sustain a healthy existence. In line with the bulk of existing studies on poverty in China, this study uses an absolute poverty rate. China is still a developing country with a significant share of the population unable to afford basic necessities, which is best captured by absolute poverty measures. Indeed it is difficult to construct meaningful relative poverty measures for China given the lack of regional household or individual income data necessary for calculating relative poverty rates.
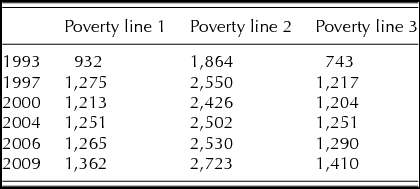
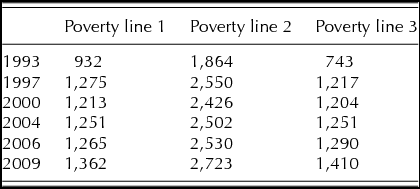
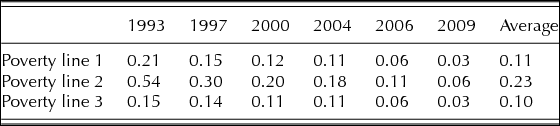
Following Chen and Ravallion (Reference Chen and Ravallion2008), we employ three absolute poverty lines to estimate poverty rate in China. Poverty line 1 refers to the share of the sample population living under the poverty line of US$1 a day at 2005 PPP.Footnote 4 Poverty line 2 refers to the share of sample population living below US$2 a day at 2005 PPP. Poverty line 3 is set, following Ravallion and Chen (Reference Ravallion and Chen2007), at CNY 1,200 per month for urban areas in 2002 prices. As is evident in Table 1, Poverty line 3 broadly mirrors poverty line 1.
Poverty lines, Income per person per month, PPP CNY, 1993–2009
Source: authors’ calculations.
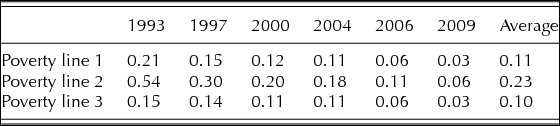
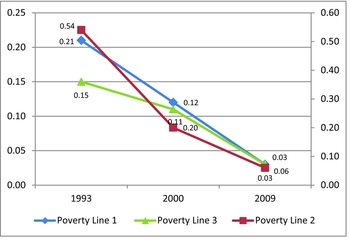
Poverty in China has declined consistently against all three measures over the past sixteen years, as shown in Table 2 and depicted in Figure 1.Footnote 5 The decline in extreme poverty (lines 1 and 3) is remarkable, in that it nearly halved over the seven years between 1993 and 2000, halved again between 2000 and 2006 and halved yet again in the following three years from 2006 to 2009. The proportion of the population that is poor or near-poor, measured by line 2, also declined drastically, albeit at a slightly slower rate.
Poverty headcount ratio by year, 1993–2009
Source: authors’ calculations.
Poverty headcount ratio, 1993–2009 Source: authors’ calculations.

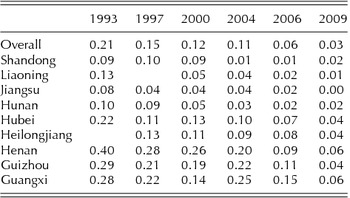
The poverty trends by region show a similar picture (Table 3). While all provinces included in the data made progress in poverty eradication, Henan and Guizhou provinces in inland China were more successful in doing so over the period 1993 to 2009. Footnote 6On the other hand, provinces such as Guangxi experienced only modest success in poverty reduction between 1997 and 2006.
Poverty headcount ratio, poverty line 1, by region

Source: authors’ calculations.
However, the shifts in poverty levels discussed above offer only a superficial picture of poverty trends in China. Further analysis of the drivers of the trends is required to understand poverty dynamics and to draw policy-relevant conclusions. In the next section, we use panel data analysis and multilevel analysis to investigate the effects of social protection programmes on poverty reduction in China.
Methodology
To observe shifts in poverty across households and regions and over time, it is necessary to examine the determinants of poverty at the household level. We use fixed-effects and random-effects logit models to estimate poverty at household level and ascertain what works in reducing poverty.Footnote 7 The CHNS panel data used in this study offers exceptional opportunities for analysis. As Hsiao and Tahmiscioglu (Reference Hsiao and Tahmiscioglu2008: 2698) point out, panel data offer rich potential for investigating the complexity of social phenomena by ‘blending inter-individual differences and intra-individual dynamics’. We used the Hausman specification test in this study to assess random-effects versus fixed- effects in the panel data and confirmed that the fixed-effects model should be preferred in this study. Therefore, in the following section, the findings refer mainly to fixed-effects models.
Our dependent variable is Poverty line 1 (US$1.00 a day at 2005 PPP prices). While Poverty lines 2 and 3 were also tested, only the results from analysis employing Poverty line 1 are reported in this article because the regression results showed insignificant differences. A number of independent variables are examined to understand changes in the dependent variable. Drawing on previous studies (Gao et al., Reference Gao, Garfinkel and Zhai2009; Gustafsson and Deng, Reference Gustafsson and Deng2011; You, Reference You2011), the household head's age, completed years of formal education, occupation and firm type of employment are incorporated in the model. On the occupation category and firm type of employment, we follow Goh et al. (Reference Goh, Luo and Zhu2009).Footnote 8 Household head with cadre status is also included in the specifications on the assumption that that political status and connections to the Chinese Communist Party (CCP) matter in determining individual and household income and other benefits (Morduch and Sicular, Reference Morduch and Sicular2000). We further incorporate household size, the number of children under the age of eighteen years and the number of household members above the age of sixty years, because they affect patterns of income and expenditure in households. As elaborated later in the article, household size is expected to positively affect poverty reduction, while a larger number of children and older people in the family affect it negatively.
As poverty is a complex phenomenon, teasing out the nestedness in determinants of poverty – not only factors related to household, but also other compounding factors – is crucial. We apply a hierarchical linear model (HLM) to individual and household level data as well as macro demographic data in the region, to explore the relationship between MLSA spending and poverty reduction (Raudenbush and Bryk, Reference Raudenbush and Bryk2002; Albright and Marinova, Reference Albright and Marinova2010). In the implementation of HLM, we follow Albright and Marinova's (Reference Albright and Marinova2010) approach in this study. Recognising that both government and family support play a role in alleviating poverty, the HLM model employed in this study combines household level poverty data with provincial governments’ spending on MLSA to assess their respective impact on poverty reduction.
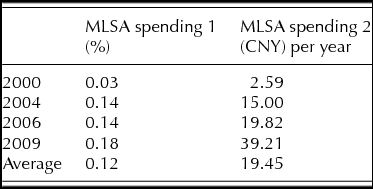
More specifically, in line with the HLM model used in this study, we analyse two-level data in this study. Level 1 variables include all data in fixed-effects and random-effects logit models, while level 2 variables include two types of MLSA spending: MLSA Spending 1 refers to MLSA spending as a percentage of local GDP, whereas MLSA Spending 2 denotes MLSA spending per capita.
As a first step, using a panel data analysis with only one level of data, we analyse the impact of household characteristics on poverty. Next, we analyse government spending on MLSA as a proxy for governments’ poverty reduction efforts. When controlling for household characteristics (level 1 data), the multilevel analysis aims to assess the extent to which MLSA spending (level 2 data) affects poverty reduction.
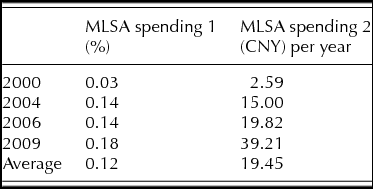
Table 4 indicates that the total MLSA spending as a percentage of GDP in China is still modest, despite the increase from 0.03 per cent in 2000 to 0.18 per cent in 2009. The average spending on MLSA over the 2000 to 2009 period was 0.12 per cent of GDP, which is considerably below other countries in East Asia.Footnote 9
MLSA spending as a percentage of GDP and per capita, per year, 2000–09
Source: authors’ calculations.
Results
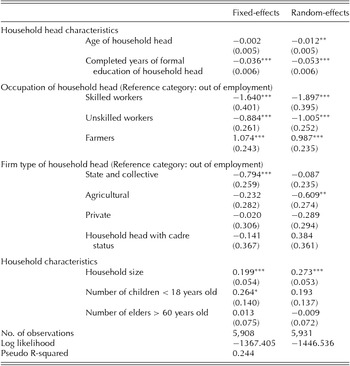
Table 5 contains the results of the application of fixed-effects and random-effects logit models on poverty levels. A variance inflation factor (VIF) test shows no significant multicollinearity problems. The fixed-effects approach reveals that the education level of household head contributes to poverty reduction, other things being equal, in line with other studies showing a positive link between human capital development and poverty reduction (You, Reference You2011). The employment skill level of the household head is significantly and negatively associated with poverty in China. There is also a positive and significant correlation between farming household heads and poverty status. These correlations suggest that households with heads who are less educated and are farmers face a high likelihood of living in poverty. Conversely, households with heads who are educated and formally employed are less likely to be poor. Households with heads working in state and collective enterprises also face less likelihood of living in poverty.
Fixed-effects and random-effects logit models on poverty status

Notes: 1. *** p < 0.01, ** p < 0.05, * p < 0.1; 2. The standard errors are shown in parentheses; 3. Poverty line 1 is used in this analysis.
The cadre status of household head shows no discernible effect on poverty status in our regression analysis, despite the widespread perception that Communist Party membership bestows significant advantages to members. Our finding in this respect is consistent with previous studies on the linkage (Nee, Reference Nee1991; Sicular et al., Reference Sicular, Yue, Gustafsson and Li2007).
This study also finds that the size of household affects poverty eradication as household size is significantly and positively associated with poverty status. Large household size, it is sometimes reasoned, is conducive to poverty reduction, as demand for food and other daily necessities declines with household size in per capita terms (see Drèze and Srinivasan, Reference Drèze and Srinivasan1997; Deaton and Paxson, Reference Deaton and Paxson1998). However, the bulk of literature on poverty alleviation in developing countries indicates that larger families tend to suffer from higher incidence of poverty (De Silva, Reference De Silva2008).Footnote 10 In China, the positive relationship between household size and poverty may be due to economic reforms that saw the elimination of food price subsidies, which used to take household size into account. After the reforms, income and other benefits have depended on individualised, salaried employment, which reduced the effects of household scale economies (see Meng et al., Reference Meng, Gregory and Wan2007).
The dependency ratio in China is associated with poverty, with number of children in the household being positively and significantly related to poverty status. This is consistent with findings of other studies that find a positive relationship between child dependency and incidence of poverty (Baulch and McCulloch, Reference Baulch and McCulloch2002). Surprisingly, our study shows that the number of elders does not affect households’ poverty status, which is in line with the finding of Riskin and Gao (Reference Riskin and Gao2009) using a different dataset.
Our regression results using fixed-effects and random-effects logit models are consistent with many findings in existing research (Meng et al., Reference Meng, Gregory and Wan2007; Riskin and Gao, Reference Riskin and Gao2009). However, to understand how the nature and extent of poverty is changing in China, there is a need to analyse the drivers of poverty reduction in China, as undertaken in the following discussion.
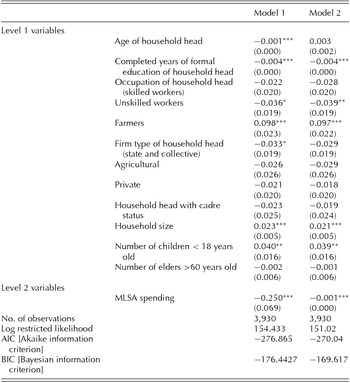
The results of applying a Hierarchical Linear Model to the provincial government's spending on Dibao are reported in Table 6. HLM Model 1 in the table uses the government's total spending on MLSA as a percentage of provincial GDP, whereas Model 2 uses MLSA spending as a percentage of the total population in a given province. After controlling for the variations in economic activities and the total population in a given province, the impact of MLSA spending on poverty reduction reveals the linkage between government policy and policy outcome, regardless of the level of economic development and population size. For example, a high total spending on MLSA in a rich province may still form only a small share of local GDP, compared to a poor province where the total spending may be lower but nevertheless form a larger share of local GDP. Indeed a key finding of our study is that poorer provinces have a superior poverty reduction record compared to their richer counterparts, confirming the correlation between government policy and poverty reduction.
Hierarchical linear models on poverty status

Notes: 1. *** p < 0.01, ** p < 0.05: * p < 0.1, 2. Standard errors are shown in parentheses; 3. The AIC and BIC statistics suggest that the models are preferable compared with the models using poverty line 2 and poverty line 3.
Results regarding the impact of household demographic characteristics on poverty status in Table 6 are comparable to those shown in the fixed-effects logit models in Table 5. Both household size and the number of children in the household increase the likelihood of poverty in urban China. The education attainment of household head serves as an effective deterrent to poverty. There is a slight difference with regard to the occupation of household head on poverty reduction between the HLM models and logit models. Occupational skills are negatively correlated with poverty status, but not significantly in the HLM models. Households headed by individuals working in state and collective firms are not significantly associated with poverty reduction in the HLM specification using MLSA spending per capita.
More importantly, MLSA spending has a strong impact on poverty reduction in both HLM models. Indeed the significance levels are higher than 0.1 per cent in both scenarios. The HLM analysis reveals that although the MLSA amount is small, the cash transfer has a positive impact on poverty reduction in China. While Table 6 only shows results using poverty line 1, testing the data using poverty lines 2 and 3 shows similar results. The analysis clearly shows that differences in provincial governments’ spending on MLSA account for much of the variation in poverty reduction experiences of different provinces in China.Footnote 11
Discussion
The analysis in the article using fixed-effects and random-effects logit models as well as hierarchical linear models shows that both favourable household characteristics and targeted cash transfers play significant roles in reducing poverty in urban China. In the face of scepticism about the effectiveness of targeted cash transfer programmes in reducing poverty, the study shows that the MLSA programme in China has contributed significantly to poverty eradication in urban areas in the country.Footnote 12 Significant effects have been achieved despite the relatively small benefits offered by MLSA programme and the relatively modest overall expenditures they involve. In 2001, the national average MLSA poverty line was lower than 30 per cent of the average income of urban dwellers (Shang and Wu, Reference Shang and Wu2004). Similarly, MLSA spending on average formed a mere 0.18 per cent of local GDP in 2009.
While post-Mao Chinese leaders have expressed a commitment to looking after the poor (Mok et al., Reference Mok, Wong, Walker, Zhang, Mok and Ku2010), they never made a commitment to introducing a universal social protection system in the country. The low Dibao benefits were a deliberate choice of policy makers, especially those at the Ministry of Civil Affairs, who feared that generous social welfare would perpetuate the old order and impede economic reforms (Lei and Walker, Reference Lei and Walker2013). Indeed, even during the central planning era, cash transfer to the poor was a marginal programme, with the primary responsibility for income support left to work units. The notion of maintaining public assistance as residual benefits for the poor persisted after the collapse of central planning and firm-based welfare to be gradually replaced by fragmented programmes for assisting older people and the poor. The fragmented programmes eventually led to the emergence of a consolidated MLSA programme for all poor during the 1990s, which matured in the following decade. Although it remains a relatively small programme in terms of the size of benefit it offers, MLSA plays a significant role in reducing poverty. According to some recent studies, the MLSA performs better in terms of narrowing the poverty gap and reducing poverty severity than lowering the poverty rate (Gustafsson and Deng, Reference Gustafsson and Deng2011; Gao and Zhai, Reference Gao and Zhai2012).
MLSA has contributed measurably to poverty reduction despite severe implementation problems. Empirical studies have shown that only one-third to one-half of those eligible for MLSA benefit actually receive it, suggesting widespread inclusion and exclusion errors in implementation (Gao and Zhai, Reference Gao and Zhai2012). Furthermore, for various reasons, beneficiaries only receive a quarter of the benefits to which they are entitled (Gao et al., Reference Gao, Garfinkel and Zhai2009; Gao and Zhai, Reference Gao and Zhai2012). It can be reasonably concluded that poverty levels in China would be considerably lower if the nearly one-half of the poor population who do not currently receive MLSA benefits began to receive the benefit, and even more if they received the full amount to which they are entitled.
Conclusion
With one of the largest numbers of poor people in the world, China's success at reducing poverty has implications for global poverty rates. It is therefore vital that poverty and the forces that drive it in China are analysed, understood and acted upon. The objective of the article has been to contribute to the understanding by studying the MLSA programme using different analytical tools.
Our findings show that MLSA, which benefits more than 70 million people overall and 23 million urban residents, plays a substantial role in reducing poverty, despite the small benefit amount it offers and the light fiscal burden it imposes on the government. Our analysis shows that the poverty rate in China has consistently declined since 1993, even during the financial crisis of 2008–09 (on the impact of financial crises on poverty in the developing countries, see Nikoloski, Reference Nikoloski2011). It also shows relationships between household characteristics and poverty. More importantly, the study shows that public spending on MLSA is positively and significantly related to poverty reduction.
The Chinese government has expressed commitment to expanding the scope and level of social protection it provides to citizens. The MLSA programme (along with expanded health insurance) already forms a solid foundation for protecting the population from poverty. The next level of challenge is to direct the programme benefits to households more vulnerable to poverty: the less educated and the unskilled, and farming and large households. These household characteristics are long-term drivers of poverty that need to be addressed through long-term programmes, in addition to short-term public assistance. To provide effective social protection, policy makers also need to improve programme implementation so as to more effectively identify needy households and channel appropriate benefits to them.
Acknowledgements
Research for this article was supported by the Research Grants Council of the Hong Kong Special Administrative Region, China (HKIEd 751510). The research uses data from the China Health and Nutrition Survey (CHNS) published by the Carolina Population Center. The authors would like to thank Ka Ho Mok, Zhirong Zhao, Shufa Du, Robert Walker, Quin Gao, Matthew Gray, Jiantuo Yu, Maggie Lau, and Xiaofang Wu for helpful input.